The FoodImageTM Smart Phone App: A Tool for Assessing Food


14 Slides3.82 MB
The FoodImageTM Smart Phone App: A Tool for Assessing Food Acquisition, Consumption & Waste Brian E. Roe,* Danyi Qi,a Robbie A. Beyl,b Karissa E. Neubig,b Corby K. Martinb†, & John W. Apolzan,b† * Corresponding Author: Ohio State University, [email protected] a Department of Agricultural Economics and Agribusiness, Louisiana State University b Pennington Biomedical Research Center
Acknowledgments & Competing Interests The authors would like to thank H. Raymond Allen for his assistance. Funding: This work is supported in part by the following grants: 2017-6702326268 from the USDA National Institute of Food and Agriculture, U54 GM104940 from the National Institute of General Medical Sciences of the National Institutes of Health, which funds the Louisiana Clinical and Translational Science Center, and NORC Center Grant # P30DK072476 entitled “Nutrition and Metabolic Health Through the Lifespan” sponsored by NIDDK. The content is solely the responsibility of the authors and does not necessarily represent the official views of the U.S. Department of Agriculture or the National Institutes of Health. The intellectual property surrounding FoodImage is owned by The Ohio State University and Pennington Biomedical Research Center / Louisiana State University and BER, JWA, and CKM are inventors of the technology. These authors report no other competing financial interests or personal relationships. DQ, RAB, and KEN have no known competing financial interests or personal relationships that could have appeared to influence the work reported.
How To Understand the Food Environment Available primary data sources in U.S. are fragmented & compartmentalized Acquisition National Household Food Acquisition and Purchase Survey (FoodAPS) Single year available, though others in planning stages Nielsen or other scanner data sources Available over time, but only purchases (no donations, Food Away from Home) Consumption What We Eat in America/National Health & Nutrition Examination Study (NHANES) Know general source of food (At Home vs. Away from Home), but no prices Waste One USDA survey from the 1970s (see Smith and Landry 2019 & 2020) Also had consumption for nearby days NRDC 3 city diary results No linked acquisition or consumption data
Tracks entire HH food ecosystem Purchase/acquisition - Shop Preparation – Prep Consumption – Eat Including leftover selection and use Discard – Toss Including reasons and destination
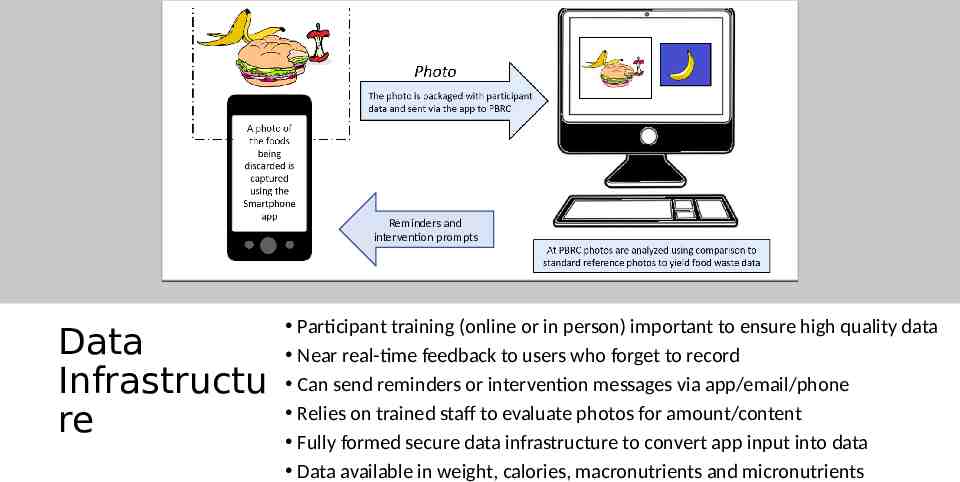
Reminders and intervention prompts Data Infrastructu re Participant training (online or in person) important to ensure high quality data Near real-time feedback to users who forget to record Can send reminders or intervention messages via app/email/phone Relies on trained staff to evaluate photos for amount/content Fully formed secure data infrastructure to convert app input into data Data available in weight, calories, macronutrients and micronutrients
Validity, Burden & Satisfaction vs. Diaries Roe et al. (2020) Methods Implemented FoodImage Pen/Paper Diary User visually estimates quantities User uses scale for quantities Order counterbalanced But scale always last Measurement Tasks Tested Waste during food preparation Plate waste Fridge clean out quantities Performance Setting 24 adults from Baton Rouge area 22 women, 65% Caucasian Had iPhone & could download apps Provided consent Trained with equal intensity to perform three measurement approaches and achieved comparable mastery Staged waste amounts in lab’s test kitchen for 3 tasks Quantities of waste and types of food randomized across participants Objective weights measured by staff by scale Raters blinded from these quantities
Sample Data Capture FoodImage Train users to ensure that each picture: Contains a reference card to improve rater’s ability to assess quantity Lids and other obstructions removed Drinks and other items in clear packages or finger points to level remaining Taken at similar distance and angle to aid in assessing quantity
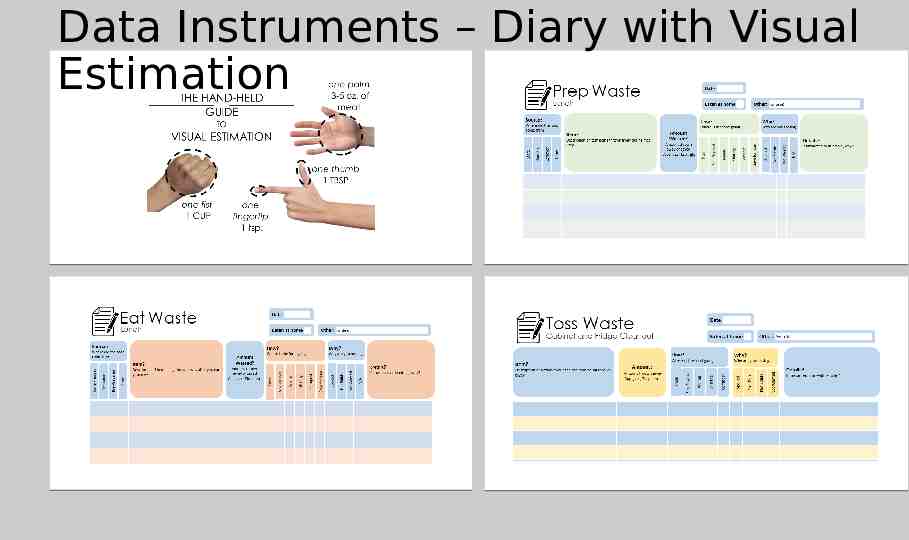
Data Instruments – Diary with Visual Estimation
Data Instruments – Diary with Scale
Performance Criteria Validity Equivalence tests Which methods yield weights 20g of objective measures? By task 20g threshold determined prior to study # items not recorded # phantom items recorded Time Burden Seconds to perform each task Cumulative time difference Satisfaction Participants asked to assess if paper/pencil diaries or app Had a lower time burden Was more accurate Was the method they would prefer to use
Equivalency Tests: Which Methods are 20g of Objective Weights by Task 60 20 Prep Black cross: all participant mean, Eat Diary: Scale Diary: Visual FoodImage Diary: Scale Diary: Visual -60 * ** FoodImage -40 Diary: Scale -20 ** Diary: Visual 0 FoodImage Grams 40 Toss Red cross: adherent participant mean, vertical line 95% conf. int. **The 95% confidence interval for diary with scale confidence interval extends in both directions beyond the region depicted on the graph. *The mean and entire 95% confidence interval for diary with scale lies above the region depicted on the graph.
Missed & Phantom Items All Participants Diary: Visual App Items Missed Prep (N 54) Eat (N 73) Toss (N 190) Phantom items Prep Eat Toss 0a 0a 0a 0a 0a 0a Diary: Scale % Items Not Measured 0a 0a 6.8a 5.5a 4.7b 3.2b Item count 2a 2a 0a 0a 2a 2a *Numbers within a row that share a superscript are not significantly different from one another
Time Burden & Satisfaction FoodImage Diary: Visual Estimation Diary: Scale Prep 69.1a 94.1b 101.0b Eat 74.7a 94.1b 100.5b Toss 138.4a 244.3b 277.4c User preferred method (%) Perceived lower time burden (%) 100.0a 100.0a 0.0b 0.0b Perceived more accurate (%) 69.6a 30.4b Time Burden (sec) *Numbers within a row that share a superscript are not significantly different from one another
Summary and Plans Advantages Challenges Moving Forward Permits connections to be tracked across HH food ecosystem Highly granular Permits near real-time reminder and intervention delivery via app Compared to pen/paper diaries Data management & cost Scaling for larger studies Respondent burden Address toss accuracy Less actual and perceived burden As or more accurate Lower than diaries But still higher than retrospective (oneoff) surveys Only available for IOS (Apple) Better instructions Improving data management efficiency RCTs evaluating a tailored smart food waste reduction intervention the affect of free fresh fruits & veg provision on waste both with and without a smart food waste intervention