Module 6 Defining, Measuring, and Monitoring Behavior Jennifer
73 Slides1.82 MB
Module 6 Defining, Measuring, and Monitoring Behavior Jennifer Freeman, PhD Don Briere, PhD Brandi Simonsen, PhD
Acknowledgements Much of the content shared in this module was developed by members of the OSEP-funded National Technical Assistance Center for Positive Behavioral Interventions and Supports. Thank you to: Members of classroom workgroup: Brandi Simonsen, Jennifer Freeman, Jessica Swain-Bradway, Robert Putnam, Heather George, Steve Goodman, Barb Mitchell, Kimberly Yanek, Kathleen Lane & Jeffrey Sprague Members of the Northeast PBIS Network: Susannah Everett, Adam Feinberg, George Sugai, Brandi Simonsen & Jennifer Freeman
Orientation to Module Tools and Resources Module Videos Module Workbook Module Readings and Additional Resources
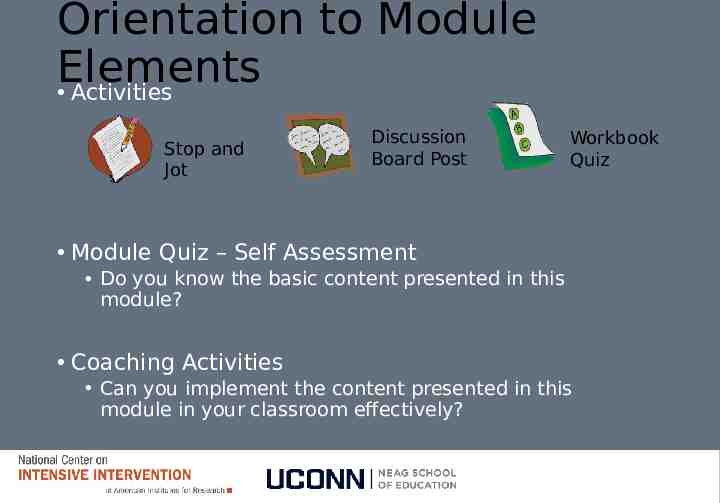
Orientation to Module Elements Activities Stop and Jot Discussion Board Post Workbook Quiz Module Quiz – Self Assessment Do you know the basic content presented in this module? Coaching Activities Can you implement the content presented in this module in your classroom effectively?
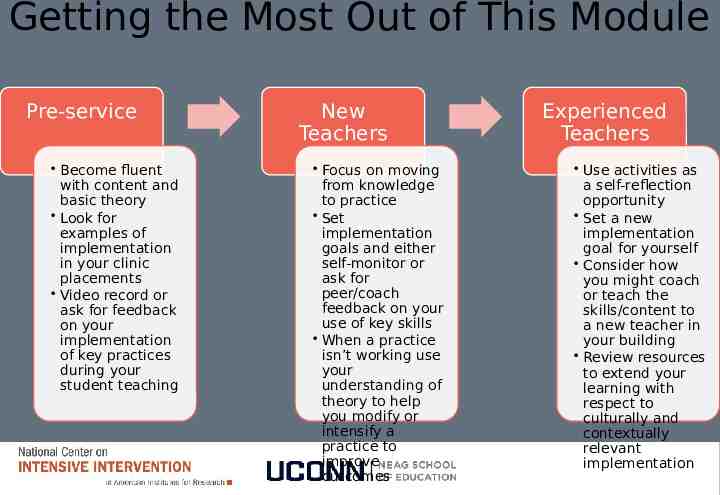
Getting the Most Out of This Module Pre-service Become fluent with content and basic theory Look for examples of implementation in your clinic placements Video record or ask for feedback on your implementation of key practices during your student teaching New Teachers Focus on moving from knowledge to practice Set implementation goals and either self-monitor or ask for peer/coach feedback on your use of key skills When a practice isn’t working use your understanding of theory to help you modify or intensify a practice to improve outcomes Experienced Teachers Use activities as a self-reflection opportunity Set a new implementation goal for yourself Consider how you might coach or teach the skills/content to a new teacher in your building Review resources to extend your learning with respect to culturally and contextually relevant implementation
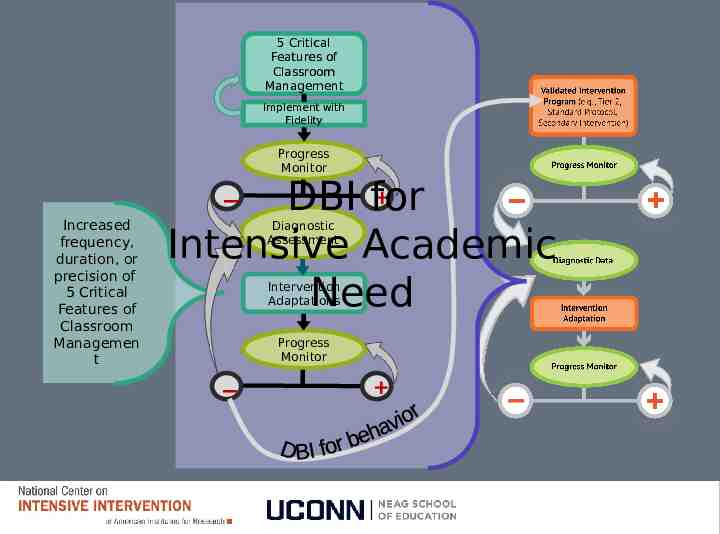
5 Critical Features of Classroom Management Implement with Fidelity Increased frequency, duration, or precision of 5 Critical Features of Classroom Managemen t Progress Monitor DBI for Intensive Academic Need Diagnostic Assessment Intervention Adaptations Progress Monitor
Module Objectives By the end of Module 6 you should be able to: Part 1 Part 2 select an appropriate target behavior write an operational definition for a Part 3 target behavior Part 4 identify relevant dimensions of behavior Part 5 choose a measurement system based on relevant dimensions of behavior use graphing conventions to create meaningful visual displays of data
Defining, Measuring, and Monitoring Behavior Part 1 How do we select an appropriate target behavior?
Module Objectives By the end of Module 6 you should be able to: Part 1 Part 2 select an appropriate target behavior write an operational definition for a Part 3 target behavior Part 4 identify relevant dimensions of behavior Part 5 choose a measurement system based on relevant dimensions of behavior use graphing conventions to create meaningful visual displays of data
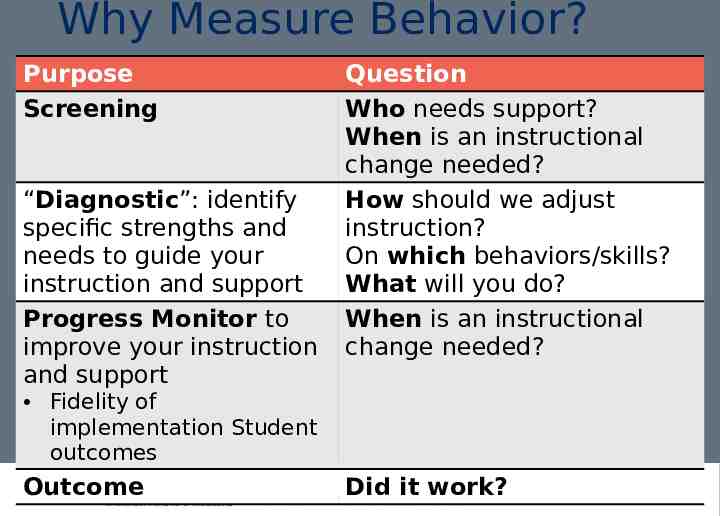
Why Measure Behavior? Purpose Screening “Diagnostic”: identify specific strengths and needs to guide your instruction and support Progress Monitor to improve your instruction and support Question Who needs support? When is an instructional change needed? How should we adjust instruction? On which behaviors/skills? What will you do? When is an instructional change needed? Fidelity of implementation Student outcomes Outcome Did it work?
Key Steps in Measuring Behavior 1. Select target behavior(s) 2. Define target behavior(s) 3. Identify relevant dimension(s) of behavior(s) 4. Determine best procedure(s) for measuring behavior(s) given definition, dimensions, and context. 5. Summarize data visually to guide decision making
1. Selecting a Target Behavior: Social Significance Does it increase access to reinforcement from natural environment? from others? other (less restrictive) environments where other behaviors can be learned/performed? Is it important as a prerequisite for another functional skill? behavioral cusp or pivotal behavior? Is it age appropriate? If a behavior is targeted for reduction, is there an adaptive replacement? Do you have the “right” behavior (not a related or verbal (Cooper, Heron, & Heward, 2007, pp. 55-61) one)?
1. Selecting a Target Behavior Prioritizing Behaviors 1. “Does this behavior pose any danger to student or others?” 2. “How often” does (or will) the behavior occur? 3. “How long-standing is the problem or skill-deficit?” 4. “Will changing this behavior produce higher rates of reinforcement for the person?” 5. “What will be the relative importance of this target behavior to future skill development and independent functioning?” 6. “Will changing this behavior reduce negative or unwanted attention from others?” 7. “Will this new behavior produce reinforcement of significant others?” 8. “How likely is success in changing this target behavior? (Cooper, Heron, & Heward, 2007, pp. 62-63, emphasis added) 9. “How much will it cost to change this behavior?”
Activity 6.1: Stop and Jot: Selecting an appropriate target behavior Identify a behavior concern for a student you have worked with. Which behavior(s) are higher priority? Why? Please Pause Video & Complete Activity 6.1
Activity 6.1: Review Remember to consider the social significance of a target behavior and consider how you will prioritize behavior(s) to address Once you have prioritized your behavior(s), you will now look to establish a clear definition
Defining, Measuring, and Monitoring Behavior Part 2 How do we write an operational definition?
Module Objectives By the end of Module 6 you should be able to: Part 1 Part 2 select an appropriate target behavior write an operational definition for a Part 3 target behavior Part 4 identify relevant dimensions of behavior Part 5 choose a measurement system based on relevant dimensions of behavior use graphing conventions to create meaningful visual displays of data
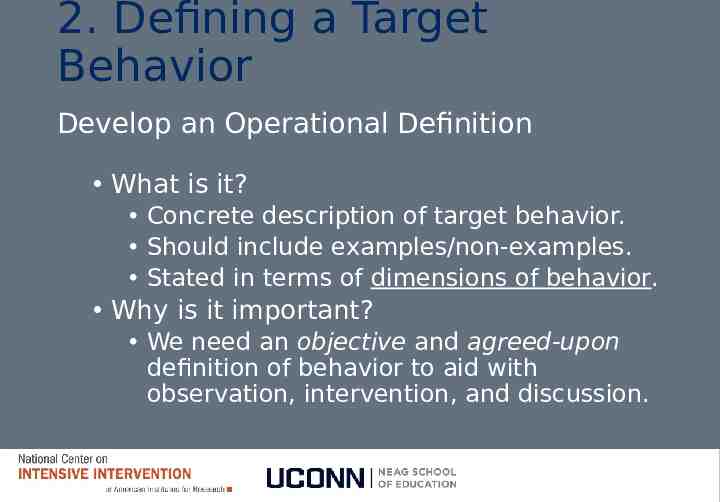
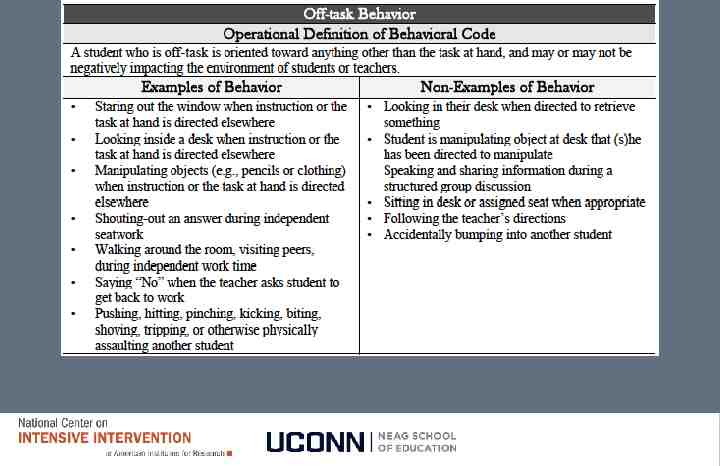
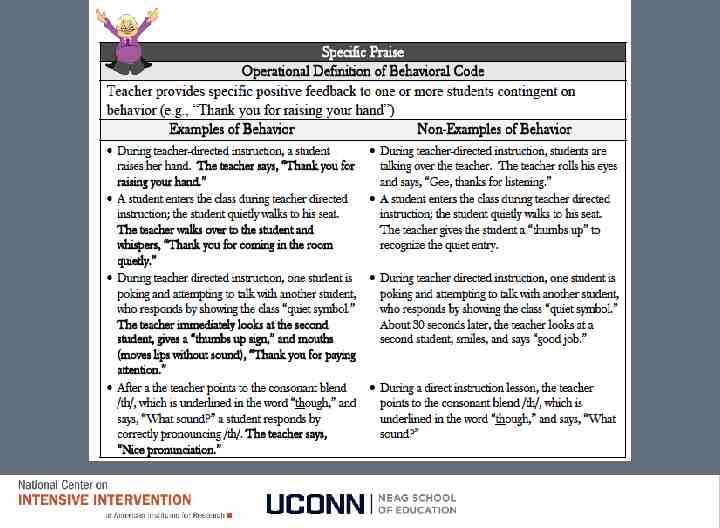
2. Defining a Target Behavior Develop an Operational Definition What is it? Concrete description of target behavior. Should include examples/non-examples. Stated in terms of dimensions of behavior. Why is it important? We need an objective and agreed-upon definition of behavior to aid with observation, intervention, and discussion.
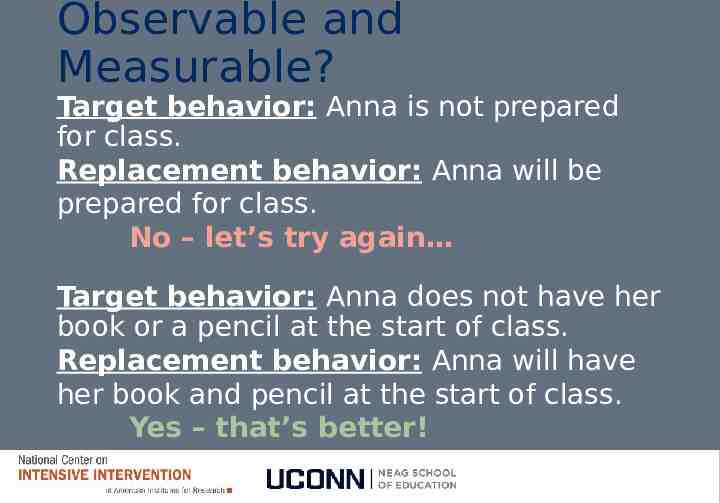
Observable and Measurable? Target behavior: Anna is not prepared for class. Replacement behavior: Anna will be prepared for class. No – let’s try again Target behavior: Anna does not have her book or a pencil at the start of class. Replacement behavior: Anna will have her book and pencil at the start of class. Yes – that’s better!
Activity 6.2: Stop & Jot: Write an operational definition Return to the behaviors you identified in Activity 6.1 Develop an operational definition for your target behavior, including examples and non examples. Please Pause Video & Complete Activity 6.2
Activity 6.2: Review Check your Operational Definition Is it? Concrete description of target behavior. Should include examples/non-examples. Stated in terms of dimensions of behavior. Remember We need an objective and agreed upon definition of behavior to aid with observation, intervention, and discussion.
Defining, Measuring, and Monitoring Behavior Part 3 How do we use the dimensions of behavior to help us refine our definition?
Module Objectives By the end of Module 6 you should be able to: Part 1 Part 2 select an appropriate target behavior write an operational definition for a Part 3 target behavior Part 4 identify relevant dimensions of behavior Part 5 choose a measurement system based on relevant dimensions of behavior use graphing conventions to create meaningful visual displays of data
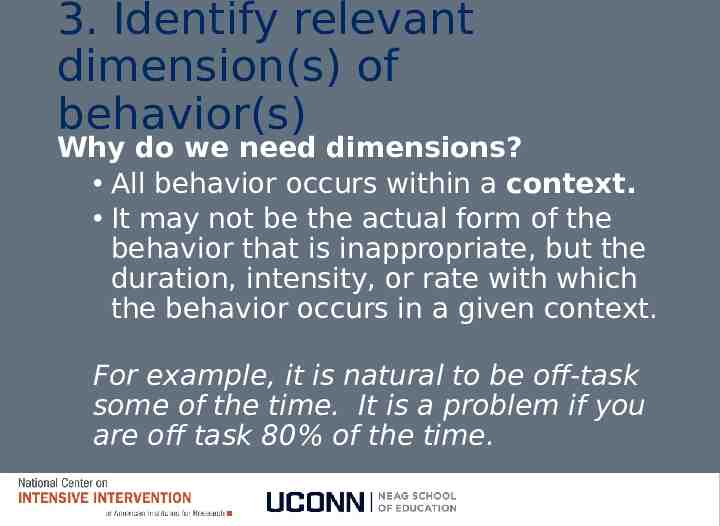
3. Identify relevant dimension(s) of behavior(s) Why do we need dimensions? All behavior occurs within a context. It may not be the actual form of the behavior that is inappropriate, but the duration, intensity, or rate with which the behavior occurs in a given context. For example, it is natural to be off-task some of the time. It is a problem if you are off task 80% of the time.
7 Dimensions of Behavior 1. Frequen cy 2. Rate 3. Duration 4. Latency 5. Topogra phy 6. Force 7. Locus
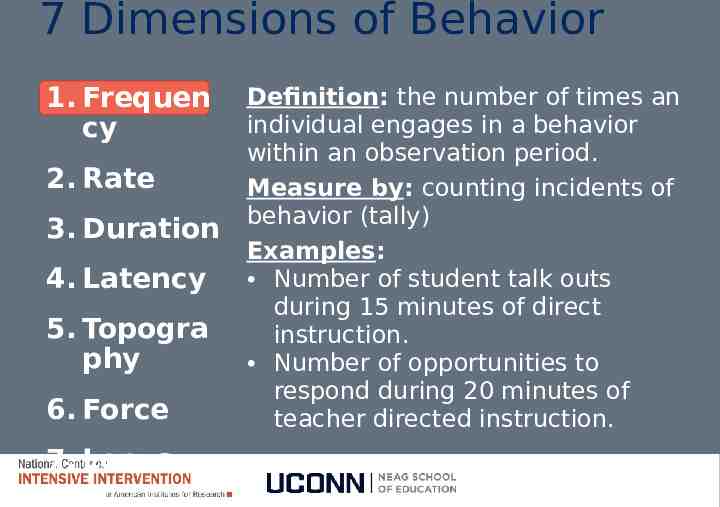
7 Dimensions of Behavior 1. Frequen cy 2. Rate 3. Duration 4. Latency 5. Topogra phy 6. Force 7. Locus Definition: the number of times an individual engages in a behavior within an observation period. Measure by: counting incidents of behavior (tally) Examples: Number of student talk outs during 15 minutes of direct instruction. Number of opportunities to respond during 20 minutes of teacher directed instruction.
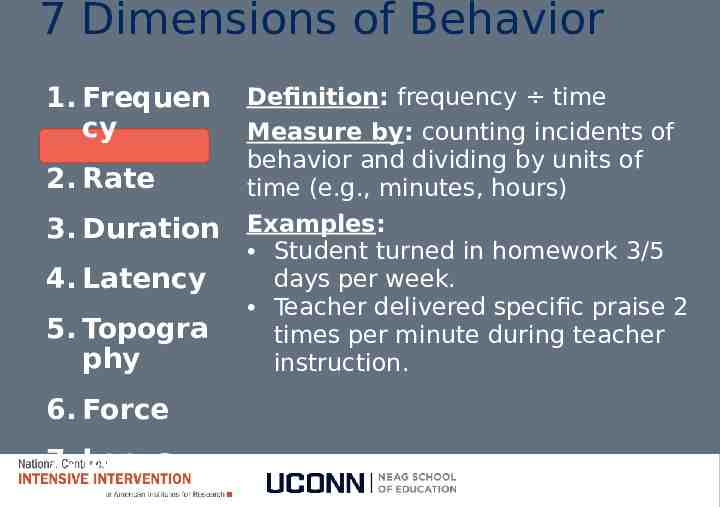
7 Dimensions of Behavior 1. Frequen cy 2. Rate 3. Duration 4. Latency 5. Topogra phy 6. Force 7. Locus Definition: frequency time Measure by: counting incidents of behavior and dividing by units of time (e.g., minutes, hours) Examples: Student turned in homework 3/5 days per week. Teacher delivered specific praise 2 times per minute during teacher instruction.
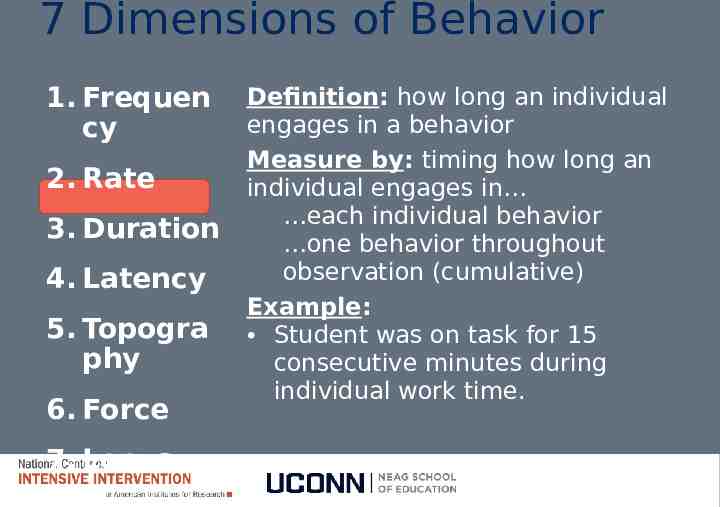
7 Dimensions of Behavior 1. Frequen cy 2. Rate 3. Duration 4. Latency 5. Topogra phy 6. Force 7. Locus Definition: how long an individual engages in a behavior Measure by: timing how long an individual engages in each individual behavior one behavior throughout observation (cumulative) Example: Student was on task for 15 consecutive minutes during individual work time.
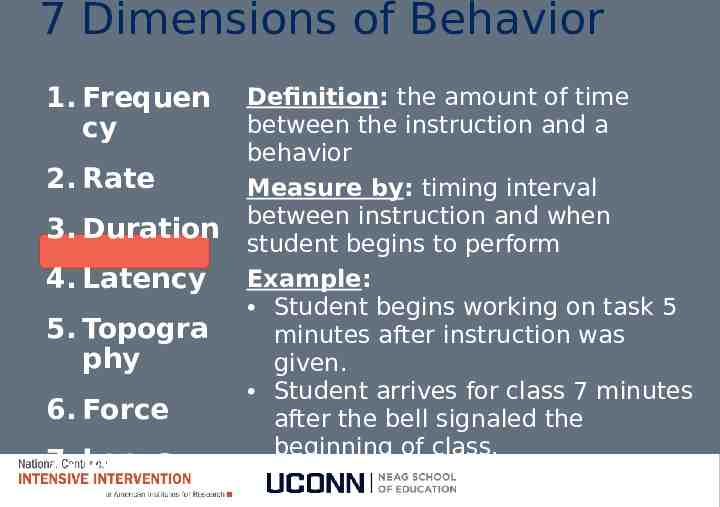
7 Dimensions of Behavior 1. Frequen cy 2. Rate 3. Duration 4. Latency 5. Topogra phy 6. Force 7. Locus Definition: the amount of time between the instruction and a behavior Measure by: timing interval between instruction and when student begins to perform Example: Student begins working on task 5 minutes after instruction was given. Student arrives for class 7 minutes after the bell signaled the beginning of class.
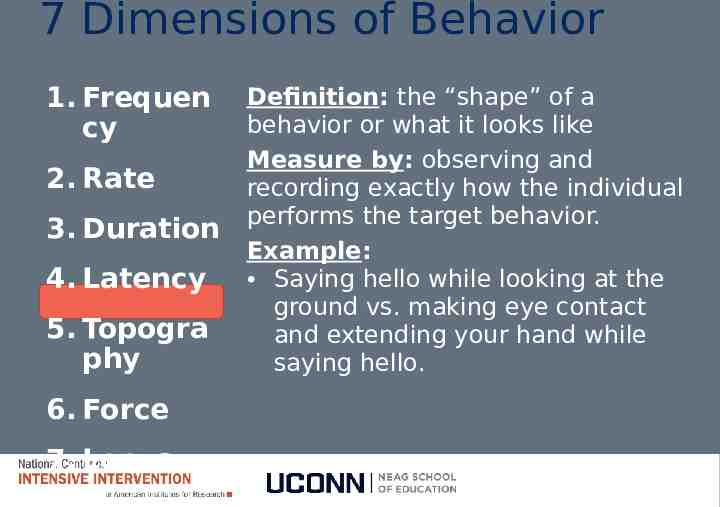
7 Dimensions of Behavior 1. Frequen cy 2. Rate 3. Duration 4. Latency 5. Topogra phy 6. Force 7. Locus Definition: the “shape” of a behavior or what it looks like Measure by: observing and recording exactly how the individual performs the target behavior. Example: Saying hello while looking at the ground vs. making eye contact and extending your hand while saying hello.
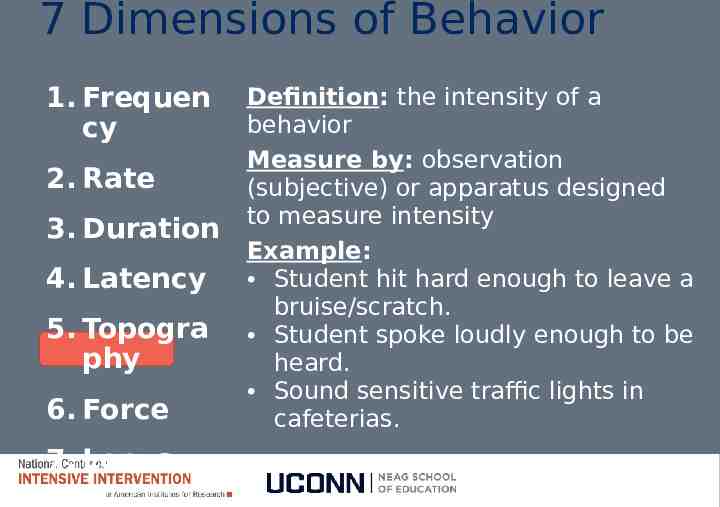
7 Dimensions of Behavior 1. Frequen cy 2. Rate 3. Duration 4. Latency 5. Topogra phy 6. Force 7. Locus Definition: the intensity of a behavior Measure by: observation (subjective) or apparatus designed to measure intensity Example: Student hit hard enough to leave a bruise/scratch. Student spoke loudly enough to be heard. Sound sensitive traffic lights in cafeterias.
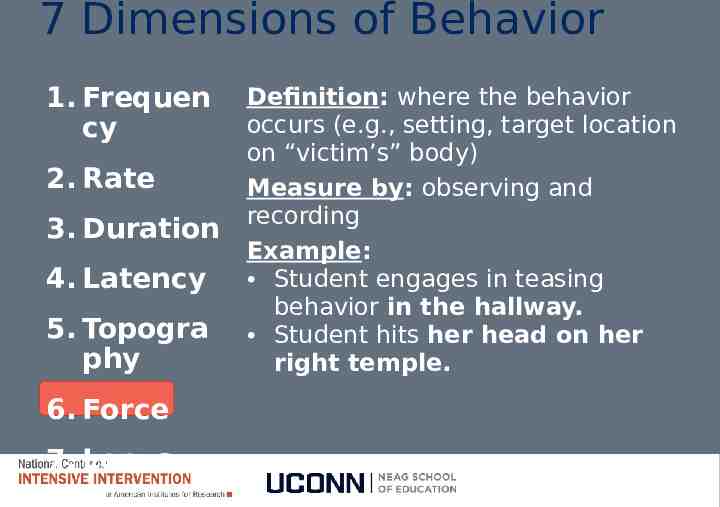
7 Dimensions of Behavior 1. Frequen cy 2. Rate 3. Duration 4. Latency 5. Topogra phy 6. Force 7. Locus Definition: where the behavior occurs (e.g., setting, target location on “victim’s” body) Measure by: observing and recording Example: Student engages in teasing behavior in the hallway. Student hits her head on her right temple.
Activity 6.3: Discussion Board Refine your definition Return to the operational definition you developed in Activity 6.2. Identify (one or more) key dimensions that are particularly relevant for your setting. Refine your operational definition using your identified dimensions. Please Pause Video & Complete Activity 6.3
Activity 6.3: Review Which dimensions did you focus on? Is your operational definition more explicit now? Is it observable/measurable? Did you consider how you might measure your behavior now that you have selected dimensions? Some operational definitions may use multiple dimensions Multiple dimensions may require multiple measurement approaches
Defining, Measuring, and Monitoring Behavior Part 4 How do we choose a measurement system?
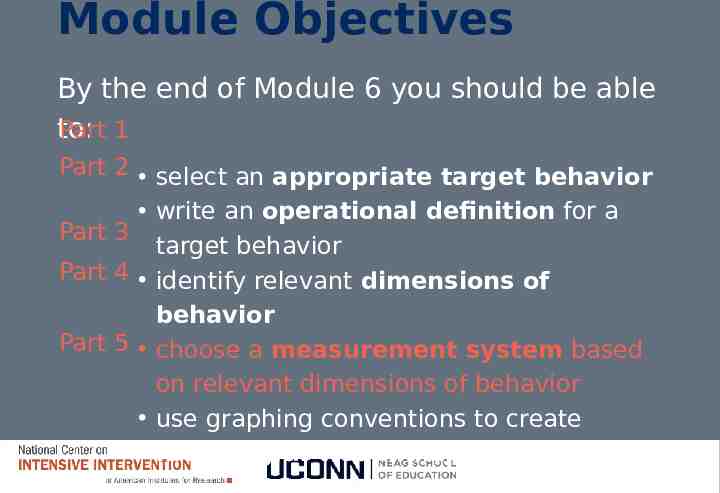
Module Objectives By the end of Module 6 you should be able to: Part 1 Part 2 select an appropriate target behavior write an operational definition for a Part 3 target behavior Part 4 identify relevant dimensions of behavior Part 5 choose a measurement system based on relevant dimensions of behavior use graphing conventions to create meaningful visual displays of data
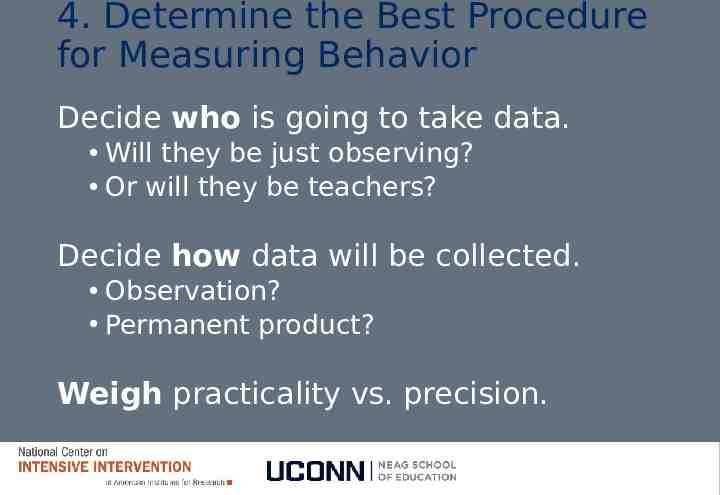
4. Determine the Best Procedure for Measuring Behavior Decide who is going to take data. Will they be just observing? Or will they be teachers? Decide how data will be collected. Observation? Permanent product? Weigh practicality vs. precision.
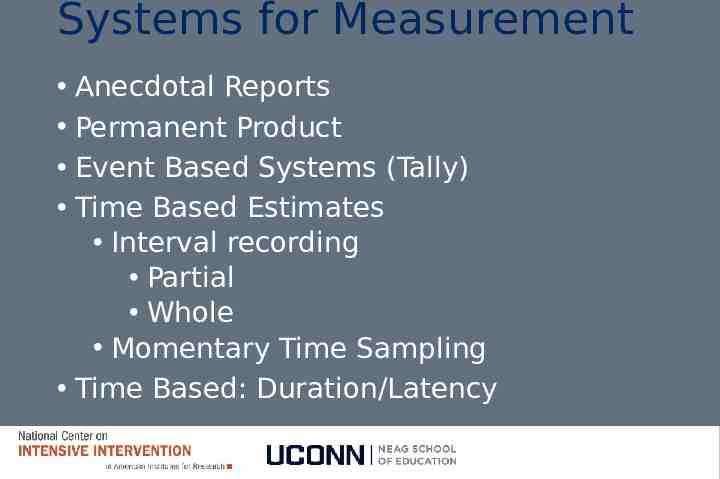
Systems for Measurement Anecdotal Reports Permanent Product Event Based Systems (Tally) Time Based Estimates Interval recording Partial Whole Momentary Time Sampling Time Based: Duration/Latency
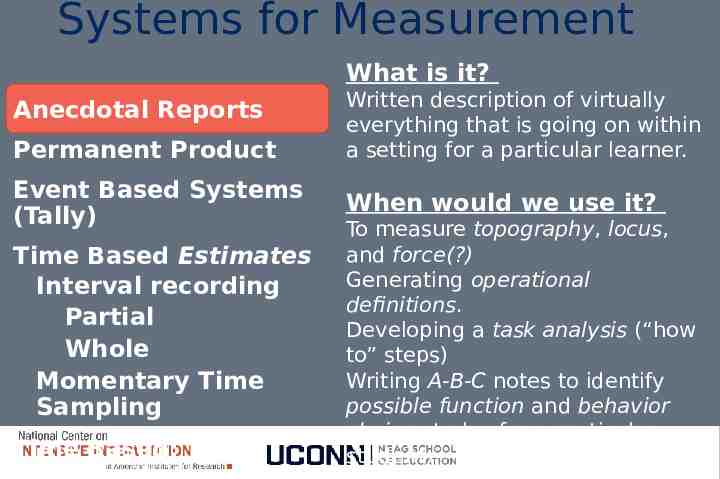
Systems for Measurement What is it? Anecdotal Reports Permanent Product Event Based Systems (Tally) Time Based Estimates Interval recording Partial Whole Momentary Time Sampling Time Based: Written description of virtually everything that is going on within a setting for a particular learner. When would we use it? To measure topography, locus, and force(?) Generating operational definitions. Developing a task analysis (“how to” steps) Writing A-B-C notes to identify possible function and behavior chains at play for a particular student.
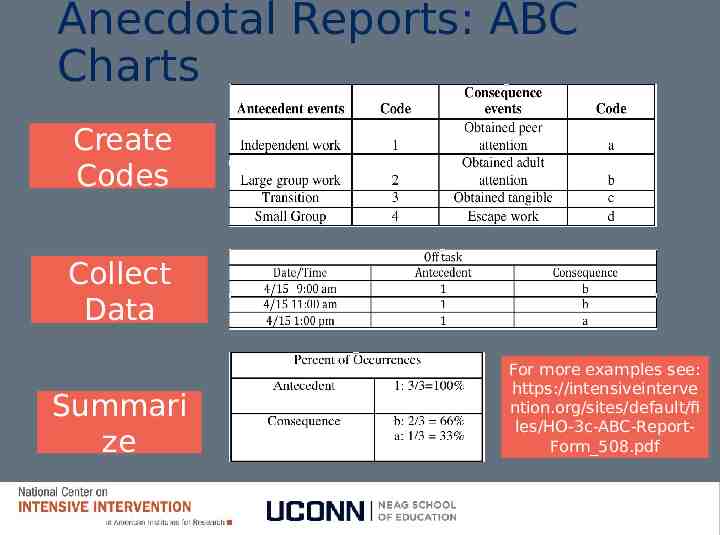
Anecdotal Reports: ABC Charts Create Codes Collect Data Summari ze For more examples see: https://intensiveinterve ntion.org/sites/default/fi les/HO-3c-ABC-ReportForm 508.pdf
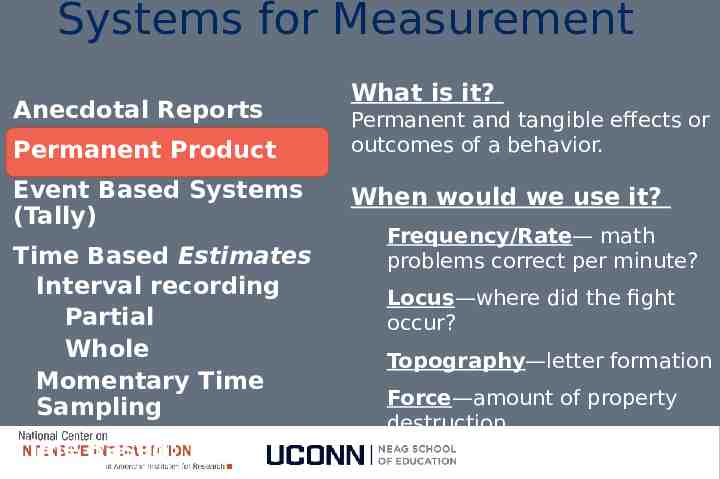
Systems for Measurement Anecdotal Reports Permanent Product Event Based Systems (Tally) Time Based Estimates Interval recording Partial Whole Momentary Time Sampling Time Based: What is it? Permanent and tangible effects or outcomes of a behavior. When would we use it? Frequency/Rate— math problems correct per minute? Locus—where did the fight occur? Topography—letter formation Force—amount of property destruction
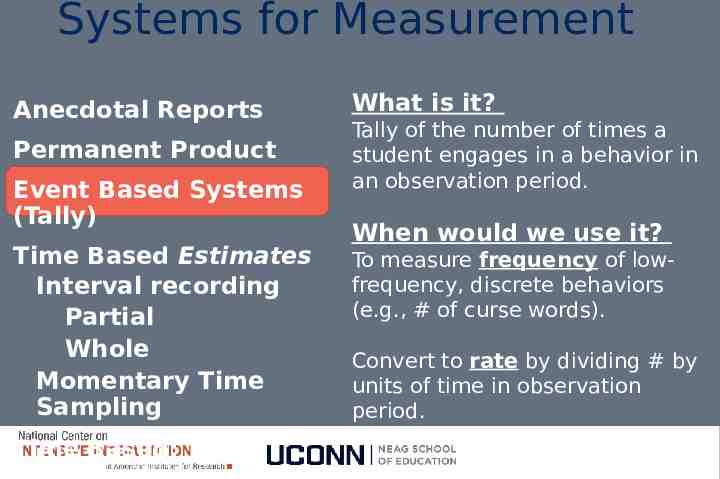
Systems for Measurement Anecdotal Reports Permanent Product Event Based Systems (Tally) Time Based Estimates Interval recording Partial Whole Momentary Time Sampling Time Based: What is it? Tally of the number of times a student engages in a behavior in an observation period. When would we use it? To measure frequency of lowfrequency, discrete behaviors (e.g., # of curse words). Convert to rate by dividing # by units of time in observation period.
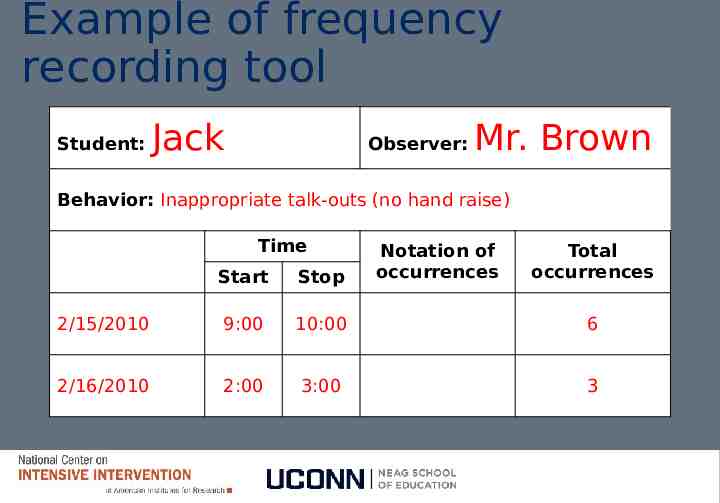
Example of frequency recording tool Student: Jack Observer: Mr. Brown Behavior: Inappropriate talk-outs (no hand raise) Time Start Stop 2/15/2010 9:00 10:00 2/16/2010 2:00 3:00 Notation of occurrences Total occurrences 6 3
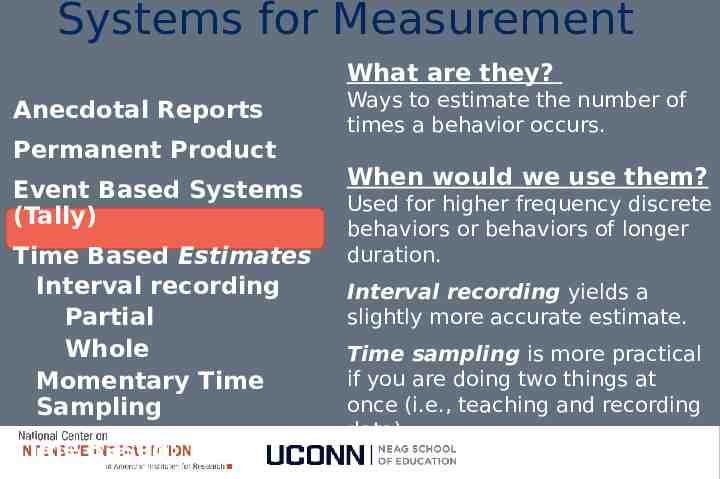
Systems for Measurement What are they? Anecdotal Reports Permanent Product Event Based Systems (Tally) Time Based Estimates Interval recording Partial Whole Momentary Time Sampling Time Based: Ways to estimate the number of times a behavior occurs. When would we use them? Used for higher frequency discrete behaviors or behaviors of longer duration. Interval recording yields a slightly more accurate estimate. Time sampling is more practical if you are doing two things at once (i.e., teaching and recording data).
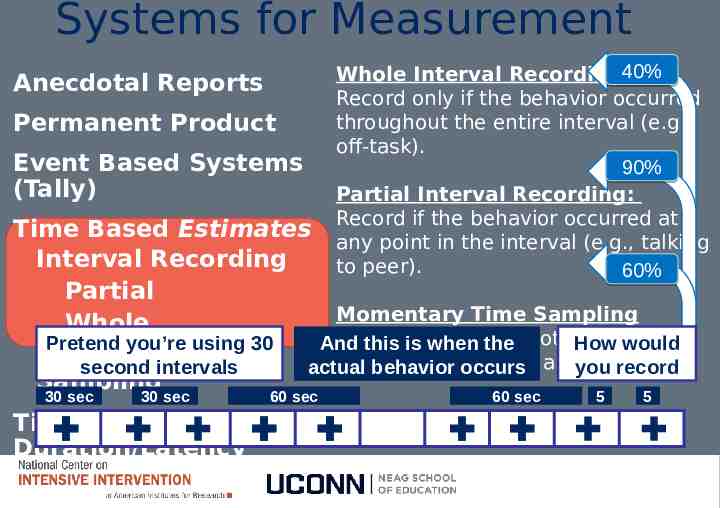
Systems for Measurement Anecdotal Reports Permanent Product Event Based Systems (Tally) Whole Interval Recording:40% Record only if the behavior occurred throughout the entire interval (e.g., off-task). 90% Partial Interval Recording: Record if the behavior occurred at any point in the interval (e.g., talking to peer). 60% Time Based Estimates Interval Recording Partial Momentary Time Sampling Whole Record whether or not aHow behavior Pretend you’re using 30 And this is when the would Momentary Time occurs at theoccurs end of an interval. second intervals actual behavior you record Sampling 30 sec 30 sec Time Based: Duration/Latency 60 sec 60 sec 5 5
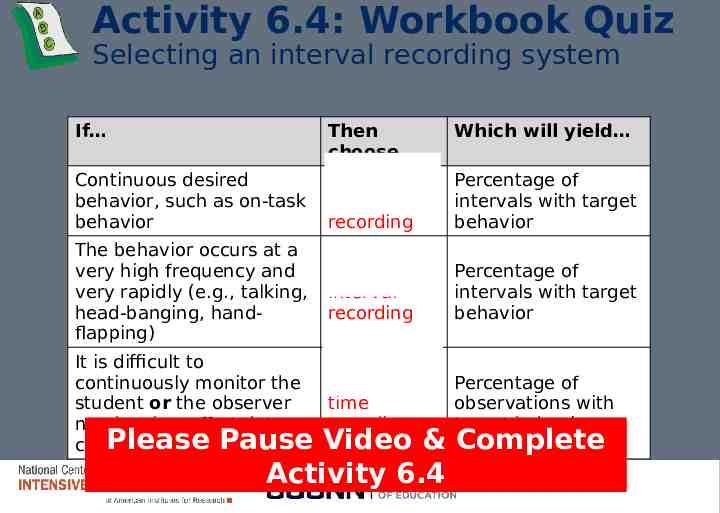
Activity 6.4: Workbook Quiz Selecting an interval recording system If Then choose Which will yield Continuous desired behavior, such as on-task behavior Wholeinterval recording Percentage of intervals with target behavior The behavior occurs at a very high frequency and very rapidly (e.g., talking, head-banging, handflapping) Partialinterval recording Percentage of intervals with target behavior It is difficult to continuously monitor the Momentary Percentage of student or the observer time observations with needs a low-effort data sampling target behavior Please Pause Video & Complete collection method Activity 6.4
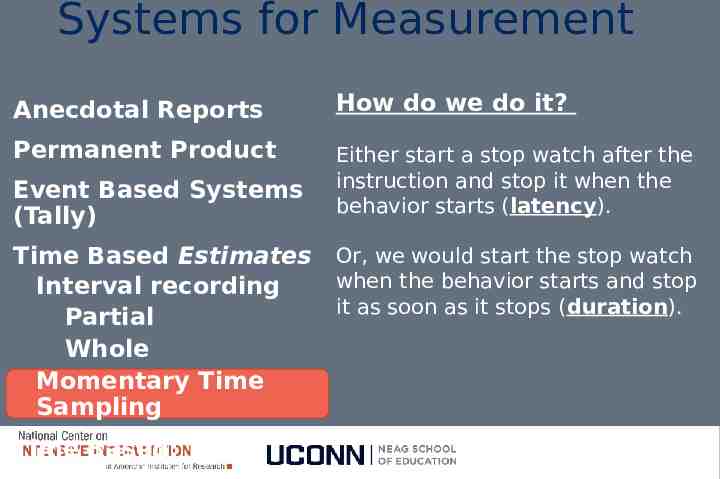
Systems for Measurement Anecdotal Reports How do we do it? Permanent Product Either start a stop watch after the instruction and stop it when the behavior starts (latency). Event Based Systems (Tally) Time Based Estimates Interval recording Partial Whole Momentary Time Sampling Time Based: Or, we would start the stop watch when the behavior starts and stop it as soon as it stops (duration).
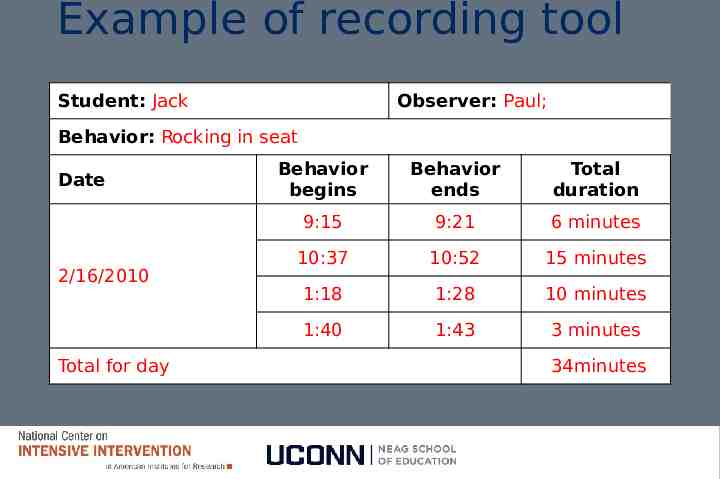
Example of recording tool Student: Jack Observer: Paul; Behavior: Rocking in seat Date 2/16/2010 Total for day Behavior begins Behavior ends Total duration 9:15 9:21 6 minutes 10:37 10:52 15 minutes 1:18 1:28 10 minutes 1:40 1:43 3 minutes 34minutes
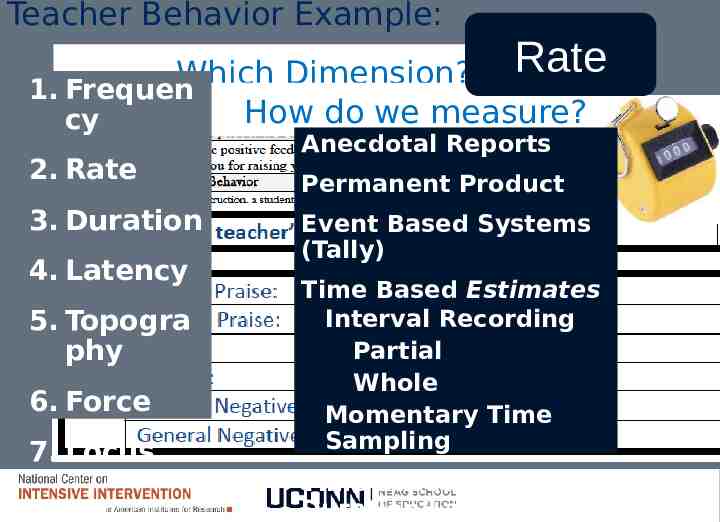
Teacher Behavior Example: Rate Which Dimension? 1. Frequen How do we measure? cy 2. Rate 3. Duration 4. Latency 5. Topogra phy 6. Force 7. Locus Anecdotal Reports Permanent Product Event Based Systems (Tally) Time Based Estimates Interval Recording Partial Whole Momentary Time Sampling Time Based: Duration/Latency
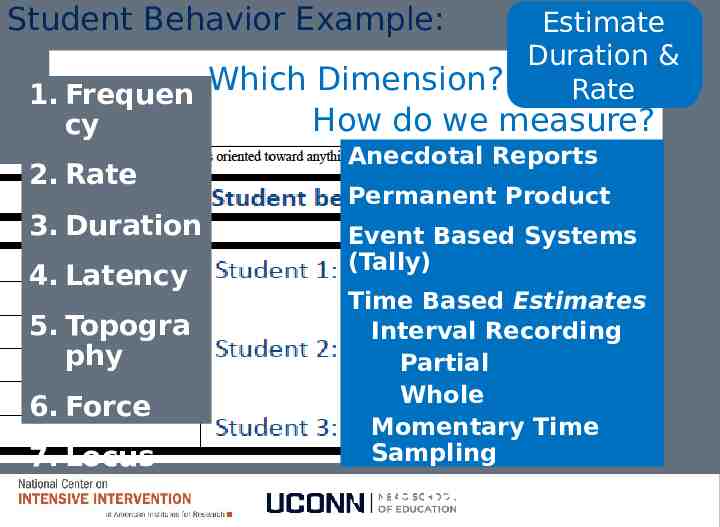
Student Behavior Example: Estimate Duration Duration & &Rate Rate Which Dimension? 1. Frequen How do we measure? cy 2. Rate 3. Duration 4. Latency 5. Topogra phy 6. Force 7. Locus Anecdotal Reports Permanent Product Event Based Systems (Tally) Time Based Estimates Interval Recording Partial Whole Momentary Time Sampling Time Based:
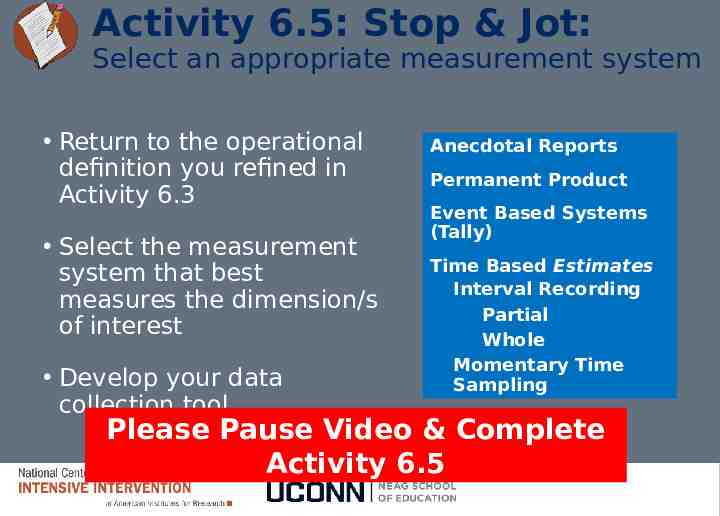
Activity 6.5: Stop & Jot: Select an appropriate measurement system Return to the operational definition you refined in Activity 6.3 Select the measurement system that best measures the dimension/s of interest Develop your data collection tool Anecdotal Reports Permanent Product Event Based Systems (Tally) Time Based Estimates Interval Recording Partial Whole Momentary Time Sampling Time Based: Please Pause Video & Complete Duration/Latency Activity 6.5
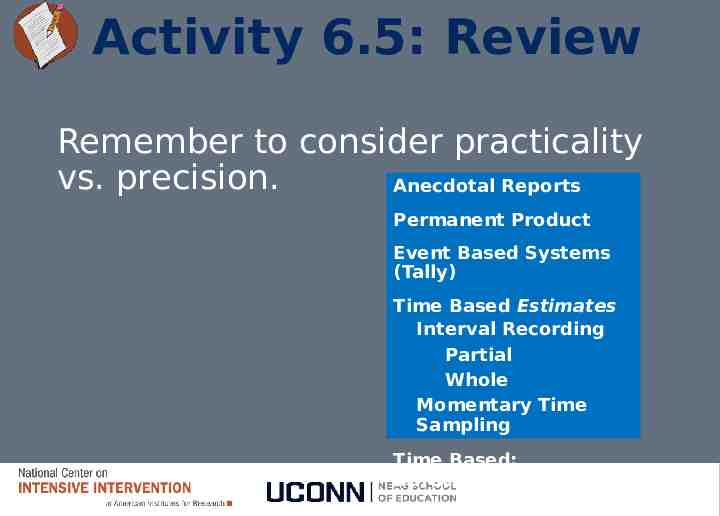
Activity 6.5: Review Remember to consider practicality vs. precision. Anecdotal Reports Permanent Product Event Based Systems (Tally) Time Based Estimates Interval Recording Partial Whole Momentary Time Sampling Time Based: Duration/Latency
Defining, Measuring, and Monitoring Behavior Part 5 How do we summarize our data to guide decision making?
Module Objectives By the end of Module 6 you should be able to: Part 1 Part 2 select an appropriate target behavior write an operational definition for a Part 3 target behavior Part 4 identify relevant dimensions of behavior Part 5 choose a measurement system based on relevant dimensions of behavior use graphing conventions to create meaningful visual displays of data
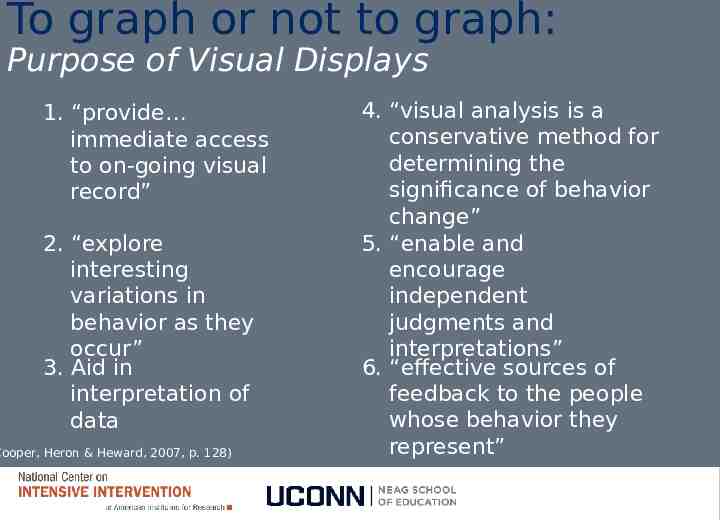
To graph or not to graph: Purpose of Visual Displays 1. “provide immediate access to on-going visual record” 2. “explore interesting variations in behavior as they occur” 3. Aid in interpretation of data Cooper, Heron & Heward, 2007, p. 128) 4. “visual analysis is a conservative method for determining the significance of behavior change” 5. “enable and encourage independent judgments and interpretations” 6. “effective sources of feedback to the people whose behavior they represent”
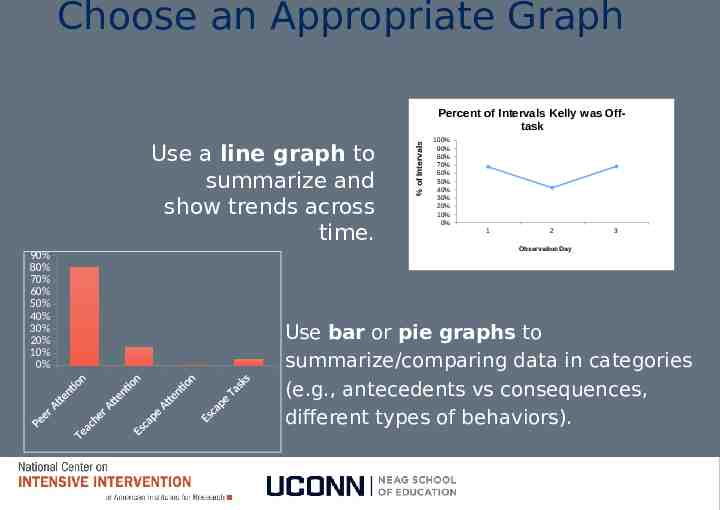
Choose an Appropriate Graph Use a line graph to summarize and show trends across time. 90% 80% 70% 60% 50% 40% 30% 20% 10% 0% % of Intervals Percent of Intervals Kelly was Offtask 100% 90% 80% 70% 60% 50% 40% 30% 20% 10% 0% 1 2 3 Observation Day Use bar or pie graphs to summarize/comparing data in categories (e.g., antecedents vs consequences, different types of behaviors).
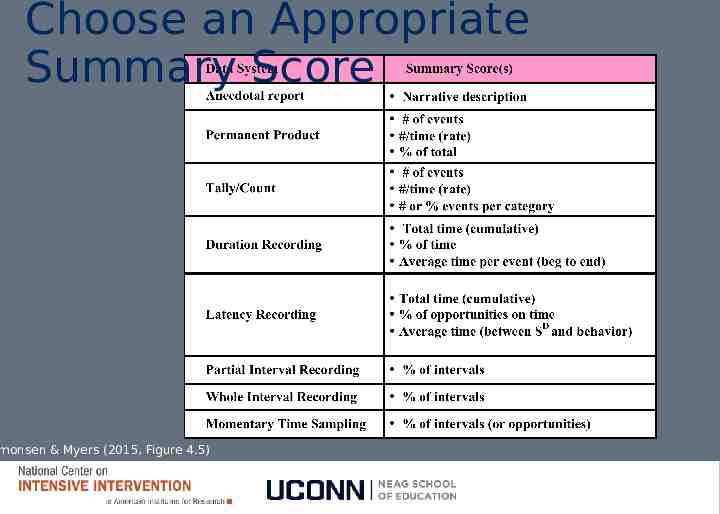
Choose an Appropriate Summary Score monsen & Myers (2015, Figure 4.5)
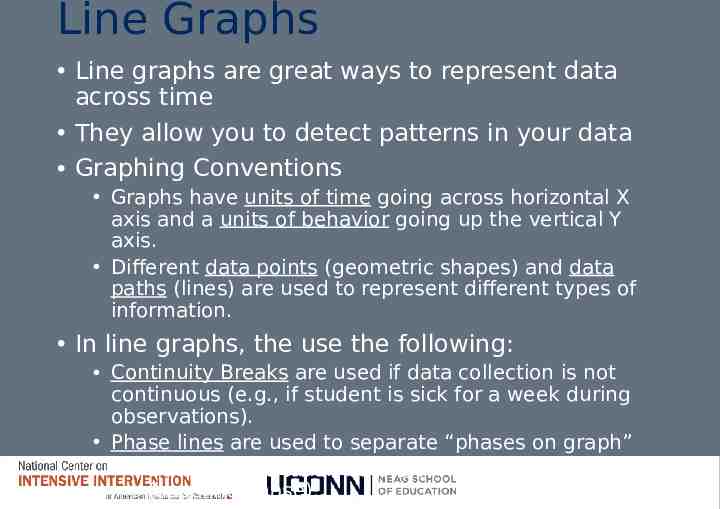
Line Graphs Line graphs are great ways to represent data across time They allow you to detect patterns in your data Graphing Conventions Graphs have units of time going across horizontal X axis and a units of behavior going up the vertical Y axis. Different data points (geometric shapes) and data paths (lines) are used to represent different types of information. In line graphs, the use the following: Continuity Breaks are used if data collection is not continuous (e.g., if student is sick for a week during observations). Phase lines are used to separate “phases on graph” Data may be taken before an intervention (baseline phase).
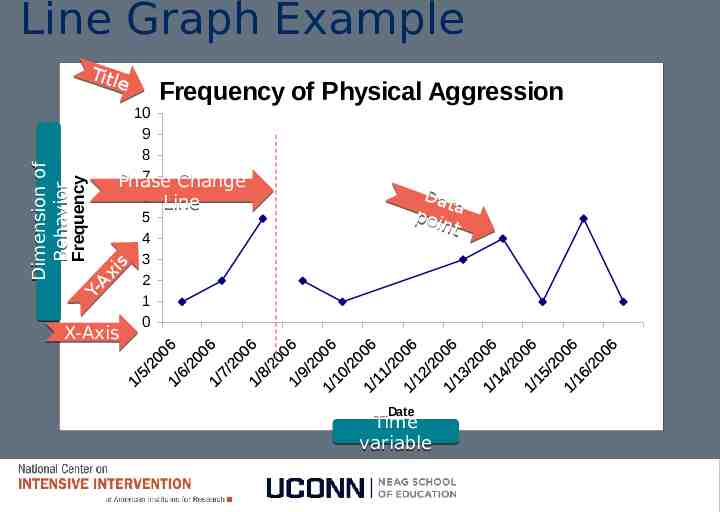
Line Graph Example Title Frequency of Physical Aggression Dimension of Behavior Frequency YAx is 10 9 8 7 Phase Change 6 Line 5 4 3 2 1 0 Dat poi a nt X-Axis Date Time variable
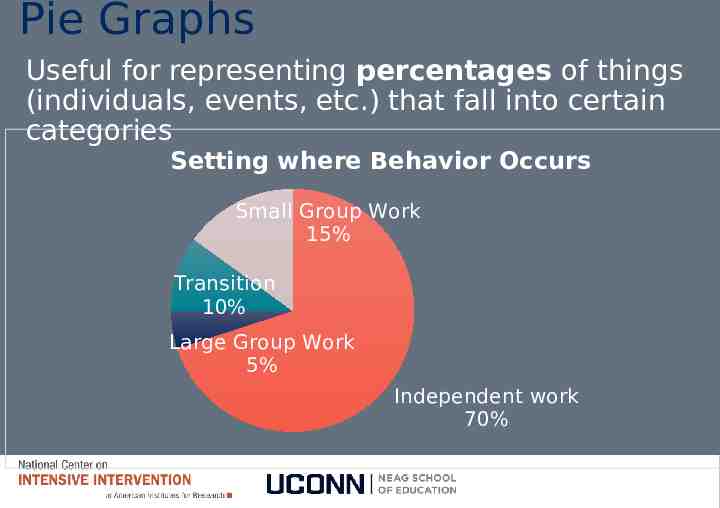
Pie Graphs Useful for representing percentages of things (individuals, events, etc.) that fall into certain categories Setting where Behavior Occurs Small Group Work 15% Transition 10% Large Group Work 5% Independent work 70%
Bar Graphs They are also useful for representing percentages of things (individuals, events, etc.) that fall into certain categories And, they can be used to represent data across time when data paths would be too confusing to represent in a line graph
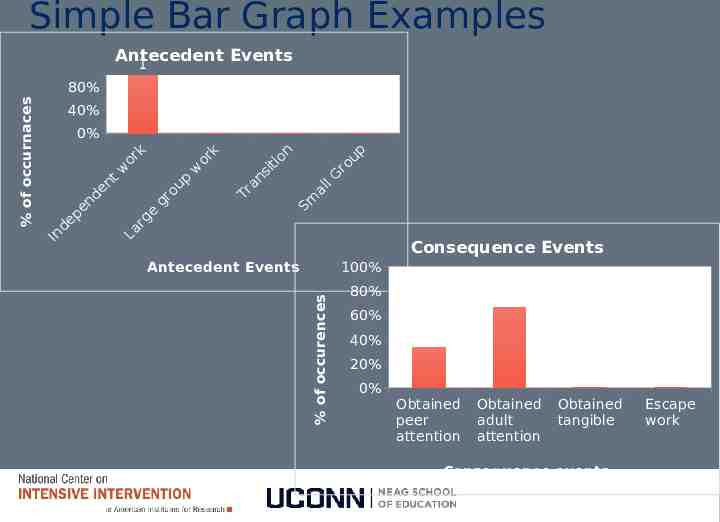
Simple Bar Graph Examples Antecedent Events 1 40% 0% I e nd p d en t n e w or k La r ge gr o up w 0 0 k n ti io s or a Tr n 0 Sm lG l a u ro p Consequence Events 100% Antecedent Events % of occurences % of occurnaces 80% 80% 66% 60% 40% 33% 20% 0% Obtained peer attention Obtained adult attention 0% 0% Obtained tangible Escape work Consequence events
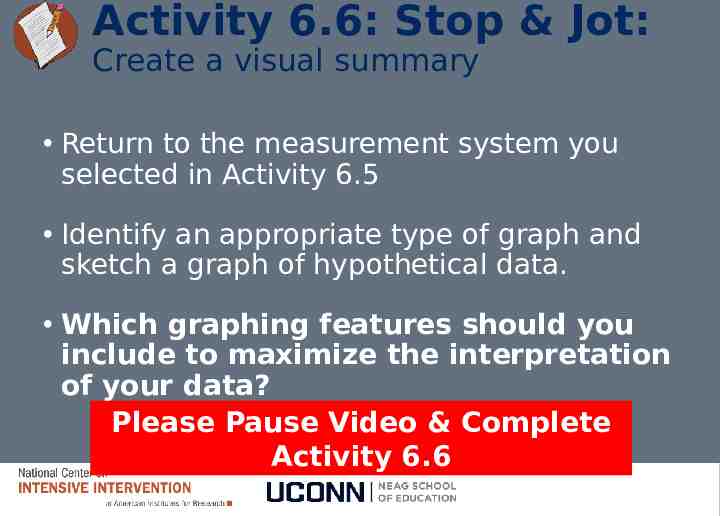
Activity 6.6: Stop & Jot: Create a visual summary Return to the measurement system you selected in Activity 6.5 Identify an appropriate type of graph and sketch a graph of hypothetical data. Which graphing features should you include to maximize the interpretation of your data? Please Pause Video & Complete Activity 6.6
Activity 6.6: Review Remember Use a line graph to summarize and show trends across time. Use bar or pie graphs to summarize/compare data in categories (e.g., antecedents vs consequences, different types of behaviors).
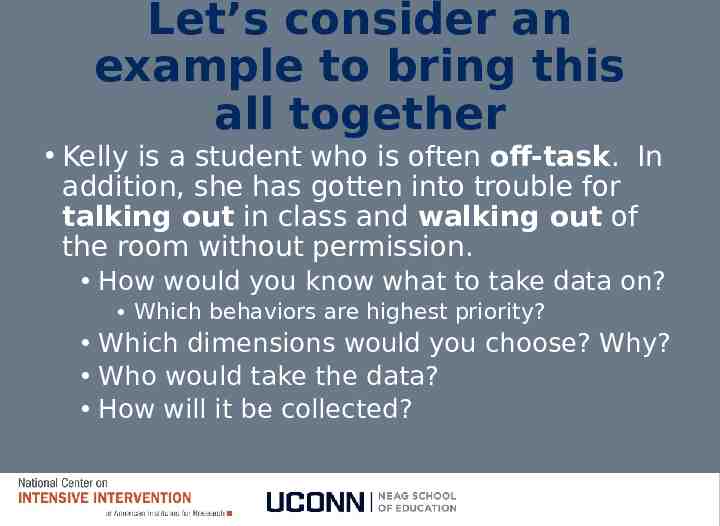
Let’s consider an example to bring this all together Kelly is a student who is often off-task. In addition, she has gotten into trouble for talking out in class and walking out of the room without permission. How would you know what to take data on? Which behaviors are highest priority? Which dimensions would you choose? Why? Who would take the data? How will it be collected?
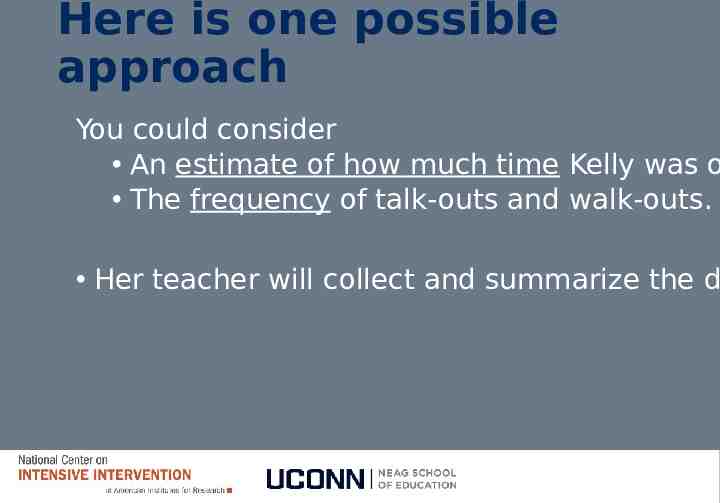
Here is one possible approach You could consider An estimate of how much time Kelly was o The frequency of talk-outs and walk-outs. Her teacher will collect and summarize the d
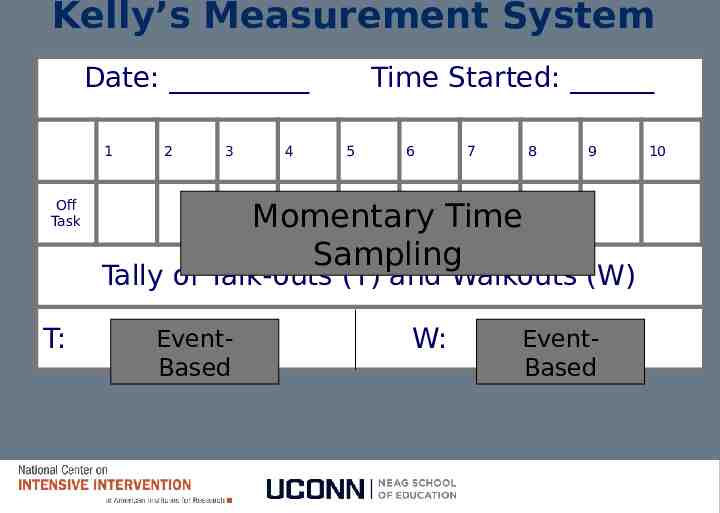
Kelly’s Measurement System Date: 1 2 3 Off Task 4 Time Started: 5 6 7 8 9 Momentary Time Sampling Tally of Talk-outs (T) and Walkouts (W) T: EventBased W: EventBased 10
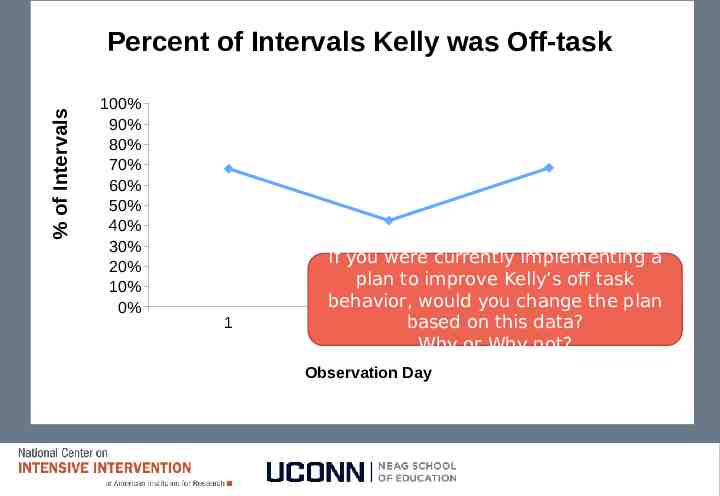
% of Intervals Example: Percent of Intervals Graph Kellyfor wasKelly Off-task 100% 90% 80% 70% 60% 50% 40% 30% 20% 10% 0% 1 If you were currently implementing a plan to improve Kelly’s off task behavior, would you change the plan 2 based on this data? 3 Why or Why not? Observation Day
Defining, Measuring, and Monitoring Behavior Closing
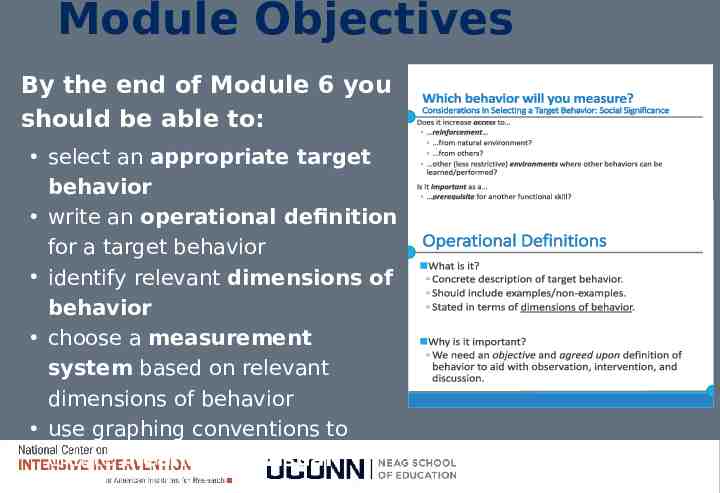
Module Objectives By the end of Module 6 you should be able to: select an appropriate target behavior write an operational definition for a target behavior identify relevant dimensions of behavior choose a measurement system based on relevant dimensions of behavior use graphing conventions to create meaningful visual
What’s next Module 6 Quiz Classroom Application