Session 4 Supply and Demand Disclaimer: The views expressed are
24 Slides498.21 KB
Session 4 Supply and Demand Disclaimer: The views expressed are those of the presenters and do not necessarily reflect those of the Federal Reserve Bank of Dallas or the Federal Reserve System.
TEKS (2) Economics. The student understands the interaction of supply, demand, and price. The student is expected to: (A) understand the effect of changes in price on the quantity demanded and quantity supplied; (B) identify the non-price determinants that create changes in supply and demand, which result in a new equilibrium price; and (C) interpret a supply-and-demand graph using supplyand-demand schedules.
Teaching the Terms Market Demand Supply Determinants Surplus Shortage
Markets A market facilitates the interaction of a buyer and a seller as they complete a transaction Buyers, as a group, determine the demand Sellers, as a group, determine the supply
Characteristics of Competitive Markets Identical goods or services Enough buyers and sellers so that no participant can influence the market price – everyone is a price taker
Demand Law of demand Quantity demanded Demand schedule Demand curve Determinants of demand
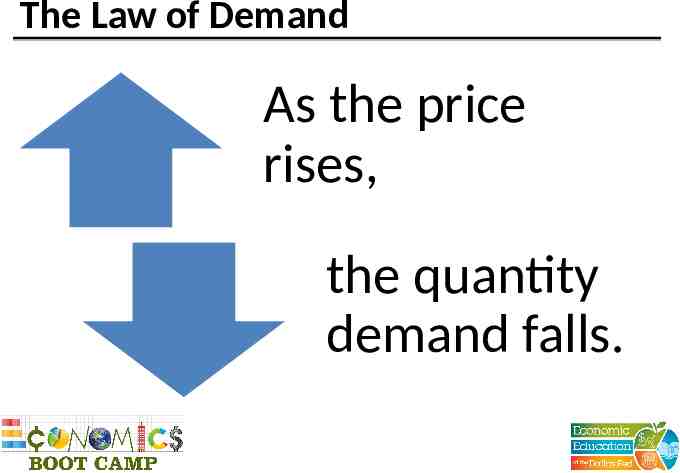
The Law of Demand As the price rises, the quantity demand falls.
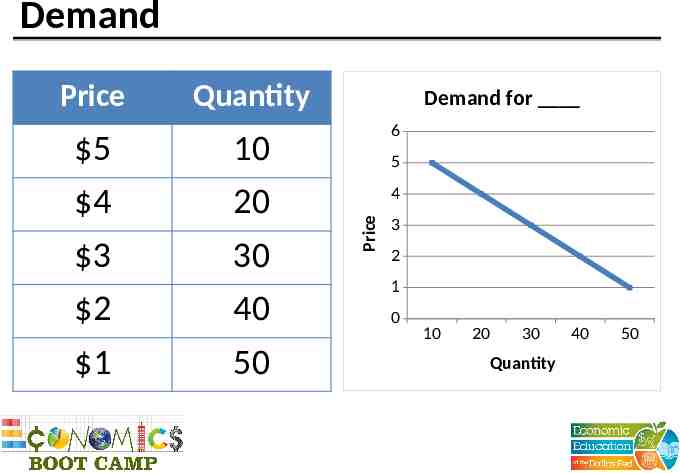
Demand 5 4 3 2 1 Quantity 10 20 30 40 50 Demand for 6 5 4 Price Price 3 2 1 0 10 20 30 Quantity 40 50
Determinants of Demand Income Price of related goods – Complements – Substitutes Tastes or preferences Expectations Number of buyers
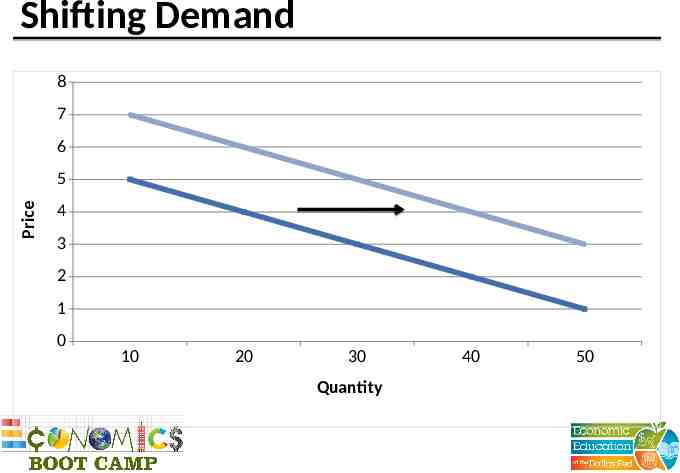
Shifting Demand 8 7 6 Price 5 4 3 2 1 0 10 20 30 Quantity 40 50
Supply Law of supply Quantity supplied Supply schedule Supply curve Determinants of supply
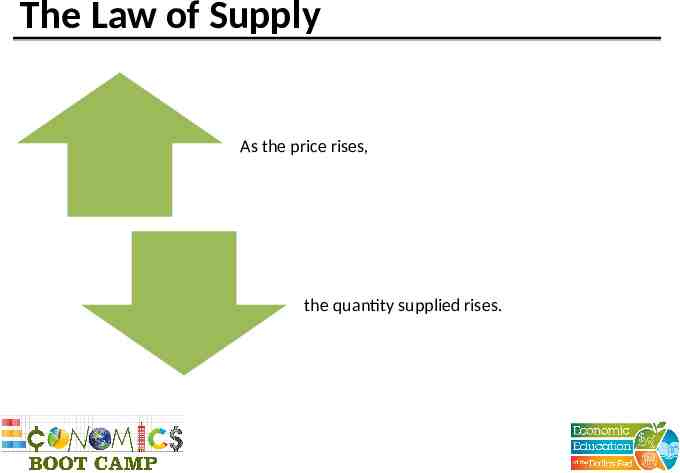
The Law of Supply As the price rises, the quantity supplied rises.
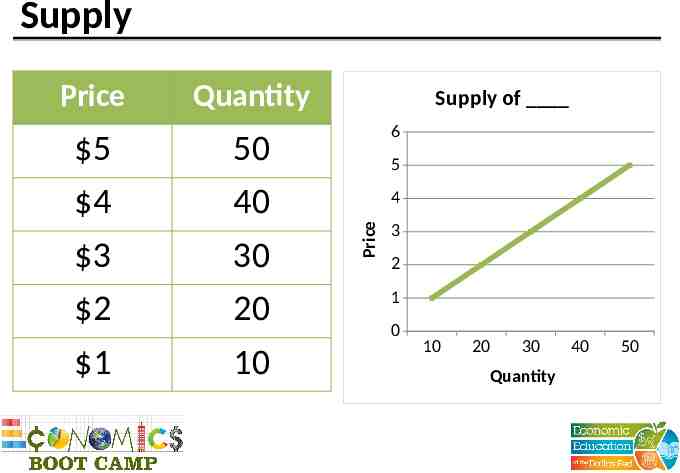
Supply 5 4 3 2 1 Quantity 50 40 30 20 10 Supply of 6 5 4 Price Price 3 2 1 0 10 20 30 Quantity 40 50
Determinants of Supply Input prices Technology Expectations Number of sellers
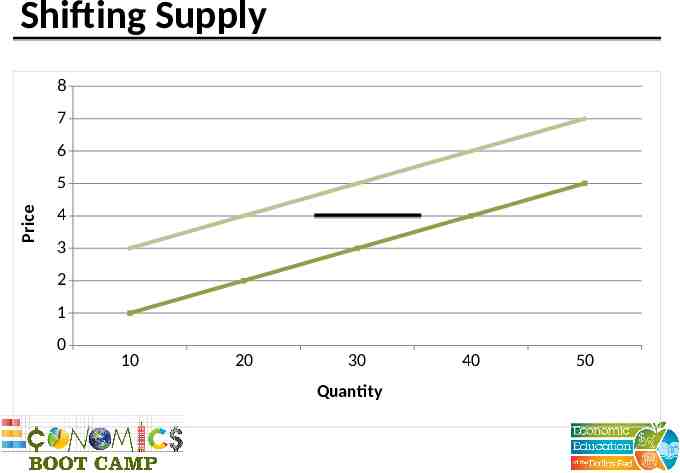
Shifting Supply 8 7 6 Price 5 4 3 2 1 0 10 20 30 Quantity 40 50
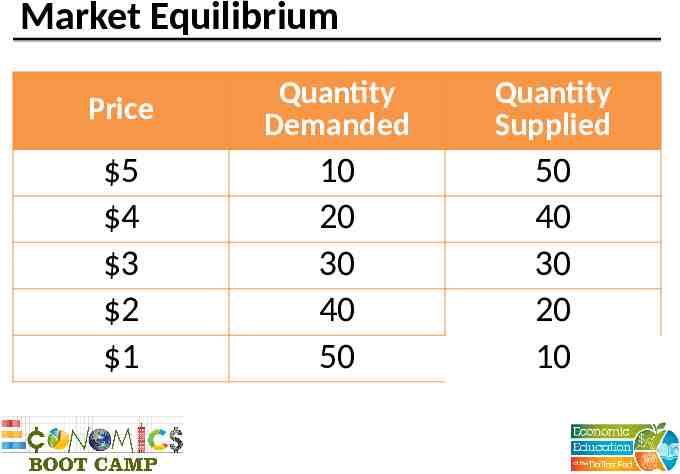
Market Equilibrium Price Quantity Demanded Quantity Supplied 5 4 3 2 1 10 20 30 40 50 50 40 30 20 10
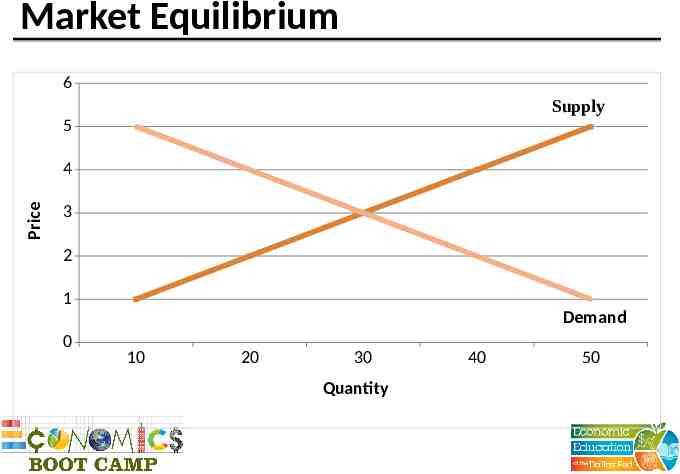
Market Equilibrium 6 Supply 5 Price 4 3 2 1 Demand 0 10 20 30 Quantity 40 50
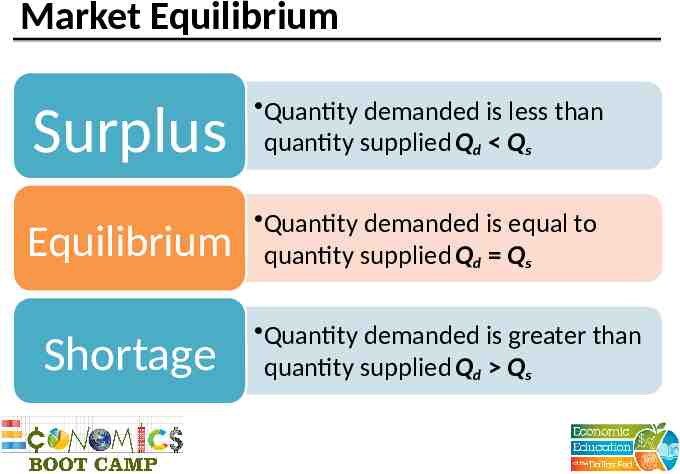
Market Equilibrium Surplus Quantity demanded is less than quantity supplied Qd Qs Equilibrium Quantity demanded is equal to quantity supplied Qd Qs Shortage Quantity demanded is greater than quantity supplied Qd Qs
Practice Draw the graph. Which curve is shifting because of the changing market conditions? Supply? Demand? Both? Which direction is the shift? Draw the shift. What is the impact on price and quantity?
Price Controls Price Ceiling – If price is fixed BELOW the market clearing price – Creates a shortage because Qd Qs Rent controls Price Floor – If price is fixed ABOVE the market clearing price – Creates a surplus because Qd Qs Minimum wage
Price Elasticity of Demand Measures the responsiveness of quantity demanded to a change in price Determinants – Availability of close substitutes – Necessities versus luxuries – Definition of the market (food vs. ice cream vs. chocolate ice cream) – Time horizon
Price Elasticity and Total Revenue If demand for a good is elastic, price increases lead to lower total revenue If demand for a good is inelastic, price increases lead to higher total revenue
Price Elasticity of Supply Measures the responsiveness of quantity supplied to a change in price Determinants – Availability of inputs – Time
Questions?