Higher Modern Studies Conclusion Questions


17 Slides59.41 KB
Higher Modern Studies Conclusion Questions
Key points Key points Questions will give at least two sources You must make conclusions/judgements based upon evidence relating to the specific prompts (bullet points) in the question Up to 3 marks can be awarded for each conclusion depending on use of evidence and evaluative language You must synthesise between sources You must also make an overall conclusion about the issue in the question (2 marks) All sources must be used for full marks – 8 marks Examples of Evaluative Language Significantly more Substantial difference Sharp decline Vast number Slightly less Risen dramatically
Look at the example of the conclusion question in the specimen paper. You are asked to write a conclusion on: 1. The links between social exclusion and health and 2. The links between social exclusion and local authority area You also must 3. Give an overall conclusion on social exclusion in Scotland. Task Look at sources A, B and C Try to come up with a conclusion about the link between social exclusion and health
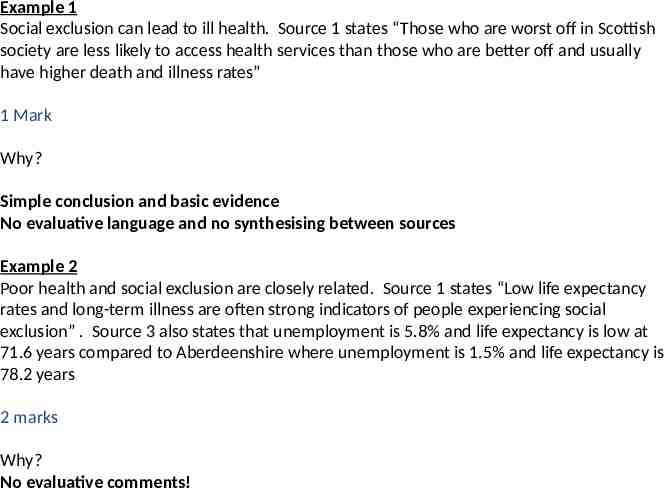
Example 1 Social exclusion can lead to ill health. Source 1 states “Those who are worst off in Scottish society are less likely to access health services than those who are better off and usually have higher death and illness rates” 1 Mark Why? Simple conclusion and basic evidence No evaluative language and no synthesising between sources Example 2 Poor health and social exclusion are closely related. Source 1 states “Low life expectancy rates and long-term illness are often strong indicators of people experiencing social exclusion” . Source 3 also states that unemployment is 5.8% and life expectancy is low at 71.6 years compared to Aberdeenshire where unemployment is 1.5% and life expectancy is 78.2 years 2 marks Why? No evaluative comments!
Example 3 The factors causing social exclusion, including health are inter-related. Source 1 states that people who are experiencing social exclusion are most likely to be affected by low income, poor health, unemployment, fuel poverty and poor housing. Source 3 shows that the poorest local authorities — such as Dundee and Glasgow which have the highest unemployment rates (5.9% and 5.8% respectively) — have a range of poorer statistics such as higher long-standing illness rates (Glasgow 22% and Dundee 17%). This clearly indicates that high levels of unemployment can be linked to poor health. In the borders people experience around half the rate of unemployment (3.3%) and significantly less cases of long standing illness (12%). The areas with high unemployment also experience higher premature death rates — Dundee is 3rd and Glasgow highest (Source 2). (3 marks) Why? Complex conclusion Synthesising between three sources! Use of evaluative language
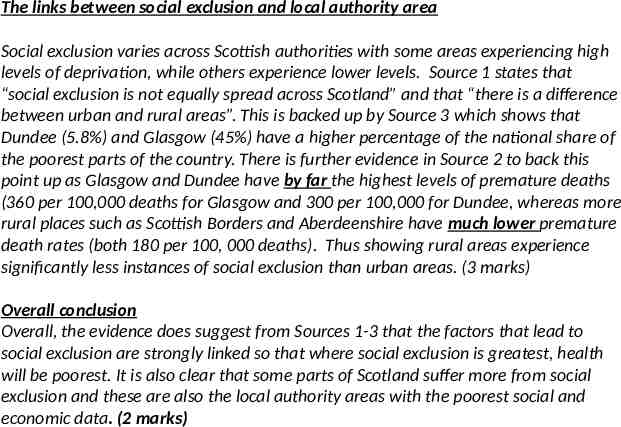
The links between social exclusion and local authority area Social exclusion varies across Scottish authorities with some areas experiencing high levels of deprivation, while others experience lower levels. Source 1 states that “social exclusion is not equally spread across Scotland” and that “there is a difference between urban and rural areas”. This is backed up by Source 3 which shows that Dundee (5.8%) and Glasgow (45%) have a higher percentage of the national share of the poorest parts of the country. There is further evidence in Source 2 to back this point up as Glasgow and Dundee have by far the highest levels of premature deaths (360 per 100,000 deaths for Glasgow and 300 per 100,000 for Dundee, whereas more rural places such as Scottish Borders and Aberdeenshire have much lower premature death rates (both 180 per 100, 000 deaths). Thus showing rural areas experience significantly less instances of social exclusion than urban areas. (3 marks) Overall conclusion Overall, the evidence does suggest from Sources 1-3 that the factors that lead to social exclusion are strongly linked so that where social exclusion is greatest, health will be poorest. It is also clear that some parts of Scotland suffer more from social exclusion and these are also the local authority areas with the poorest social and economic data. (2 marks)
Question 1
Question 1 What conclusions can be drawn about inequality in the USA? You must draw conclusions about: the links between income and health the links between race and ethnic composition in different parts of the USA You must also give an overall conclusion about inequality in the USA. Use the information below to help you answer the first bullet point. The links between income and health Areas with high poverty levels have significantly lower life expectancy rates and therefore worse health. Source 1 states “Your chance of enjoying good health and a long life depends of how rich you are and where you live”. Source 2 also shows that in states where poverty is lower than the national average of 55, 832, life expectancy is also low
The links between income and health Areas with high poverty levels have significantly lower life expectancy rates and therefore worse health. Source 1 states “Your chance of enjoying good health and a long life depends of how rich you are and where you live”. Source 2 also shows that in states where poverty is lower than the national average of 55, 832, life expectancy is also low. Mississippi has an average family income of 40, 917 and life expectancy is 73.6 years. Whereas richer states like Massachusetts have an average income of 71, 655 but life expectancy is significantly higher at 78.4 years. This clearly demonstrates that there are inequalities between states when it comes to health and poorer states have considerably lower life expectancies suggesting lower income is linked to poor health. Race and ethnic composition in different part of the USA While America is extremely diverse when it comes to race, certain states have higher proportions of ethnic minorities than others. Source 1 states “Although the USA is a very racially mixed population, each region has its own unique mixture”. This is further backed up in source 3 where it shows that in southern states the black population is significantly higher such as in Georgia where they have a population of 29.2% black. ,which is more than double the national average of 13.4%. Similarly whites are much more likely to live in rich northern states like Massachusetts, where the white population is 83.4%. This does not reflect the two thirds of the US population who are white showing states like Massachusetts have a disproportionately high number of whites.
Overall conclusion Overall, the evidence does suggest from Sources 1-3 that ethnic minorities are the group who suffer the most from inequalities in the USA. Poorer states like Georgia and Mississippi are more likely to have low life expectancies that richer states like Massachusetts which clearly indicates that ill health is more likely to occur among the poor. It is also clear from the sources that ethnic minorities like blacks are more likely to live in these southern states whereas whites are more likely to like in the northern states.
Question 2
HIV/AIDs in pregnant mothers and children The number of pregnant women with HIV/AIDS receiving assistance has improved dramatically, however, there are still major problems with the spread of HIV. Source 1 states “Progress has been made in the treatment of mothers and children. According to a UN report, the number of pregnant women receiving antiretroviral treatment (ART), which prevents mother-to-child transmission of HIV, almost doubled between 2007 and 2008” This shows that there has been a significant increase in the number of mothers receiving drugs to prevent the spread of HIV. This is further backed up in source 3 where it shows a continual increase in the number of pregnant women receiving ART treatment. In 2004 only 15% of pregnant women who were HIV positive received ART treatment, however by 2008 73% of pregnant women were getting this treatment. This shows a dramatic change in how HIV is dealt with in pregnant mothers which will reduce the number of children becoming infected.
How effective the South African government has been in dealing with HIV/AIDS The South African government has made a certain degree of progress in treating HIV/AIDs, however, this progress has not been fast enough and some states receive more assistance than others. Source 1 states “The UN report found that the South African Government’s plan to tackle HIV/AIDS is one of the largest in the world in terms of domestic spending on AIDS programmes”. However, source 2 indicates that the assistance has not came at a fast enough pace and that there are inequalities between provinces. Source 2 shows that while most people in the Northern Cape who need treatment are receiving it (20, 000 are in need of ART treatment and 15, 000 are receiving it), other provinces like KwaZulu Natal are experiencing serious problems. 300,000 people are in need of ART treatment in KwaZulu Natal but only 130, 000 are receiving it. This clearly indicates that while the government have made good progress in some areas dramatic differences across states remain and much more help is needed. Overall conclusion Overall, the evidence from sources 1-3 suggests that there have been improvements made in the treatments of HIV/AIDS in South Africa. More women who are pregnant are receiving ART treatment which will reduce the number of children becoming infected with the disease. However, it is also clear that while the South African Government has been praised by the UN for its approach to dealing with the AIDS problem, more action is needed. Hundreds of thousands of people in need of ART treatment are not receiving it and there are vast differences among the different provinces.
Question 3
The link between home ownership and age As a person gets older they are much more likely to own their own home. Source 1 states “Younger people find it harder to get on the housing ladder; as people get older they are more likely to be in well paid jobs and be able to buy a house” This is further backed up in source 3 where it shows only 30% of those ages less than 35 years own their own home compared to 80% of those ages 55 years and over. This shows a wide difference and clearly indicates a link between age and home ownership with older people twice as likely to own their own home. Link between homeownership and race A significantly higher number of whites own their own home when compared to other ethnic groups. Source 1 states “Ethnic minorities are less likely to own a house compared to Whites and their houses are usually of lower value” This clearly indicates that whites are much more likely to own property and the property is likely to be of higher value. This is further backed up in source 2 where it shows that 75% of whites own their own home compared to 60% of Asians, 50% Hispanics and 49% of blacks. This demonstrates wide differences in terms of ethnic group and homeownership. There is a distinctly vast difference between white and black ownership with Blacks the least likely of all the groups to own their own home. Overall Conclusion Overall using sources 1-3 it is clear that older white Americans are the group most likely to own their own home. The older a person gets the more likely they are to own property. In fact those ages 55 and over are two as likely to own property compared to those younger than 35. In addition it is clear that race can also be related to ownership of homes. Whites are the most likely of all racial groups to own property and blacks are the least likely to.
Question 4
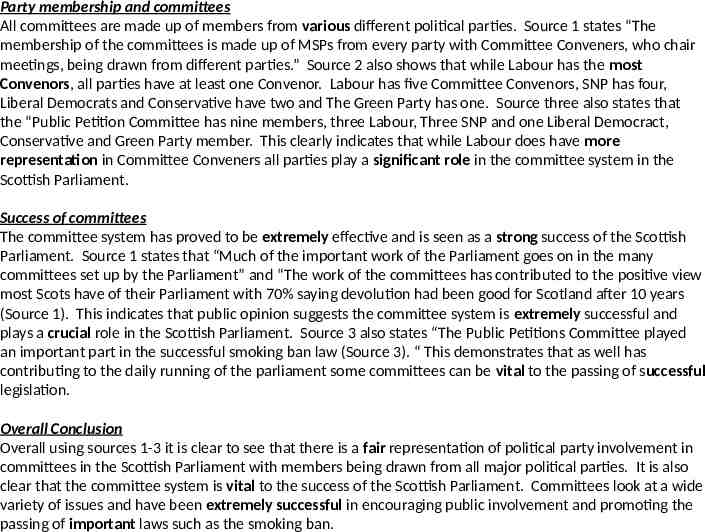
Party membership and committees All committees are made up of members from various different political parties. Source 1 states “The membership of the committees is made up of MSPs from every party with Committee Conveners, who chair meetings, being drawn from different parties.” Source 2 also shows that while Labour has the most Convenors, all parties have at least one Convenor. Labour has five Committee Convenors, SNP has four, Liberal Democrats and Conservative have two and The Green Party has one. Source three also states that the “Public Petition Committee has nine members, three Labour, Three SNP and one Liberal Democract, Conservative and Green Party member. This clearly indicates that while Labour does have more representation in Committee Conveners all parties play a significant role in the committee system in the Scottish Parliament. Success of committees The committee system has proved to be extremely effective and is seen as a strong success of the Scottish Parliament. Source 1 states that “Much of the important work of the Parliament goes on in the many committees set up by the Parliament” and “The work of the committees has contributed to the positive view most Scots have of their Parliament with 70% saying devolution had been good for Scotland after 10 years (Source 1). This indicates that public opinion suggests the committee system is extremely successful and plays a crucial role in the Scottish Parliament. Source 3 also states “The Public Petitions Committee played an important part in the successful smoking ban law (Source 3). “ This demonstrates that as well has contributing to the daily running of the parliament some committees can be vital to the passing of successful legislation. Overall Conclusion Overall using sources 1-3 it is clear to see that there is a fair representation of political party involvement in committees in the Scottish Parliament with members being drawn from all major political parties. It is also clear that the committee system is vital to the success of the Scottish Parliament. Committees look at a wide variety of issues and have been extremely successful in encouraging public involvement and promoting the passing of important laws such as the smoking ban.