REGIONALLY COMPETITIVE ENERGY TARIFFS (RCET) II FINAL REPORT JULY 2ND
64 Slides2.63 MB
REGIONALLY COMPETITIVE ENERGY TARIFFS (RCET) II FINAL REPORT JULY 2ND , 2022
GLOBAL TEXTILE TRADE PICTURE TOR # 1
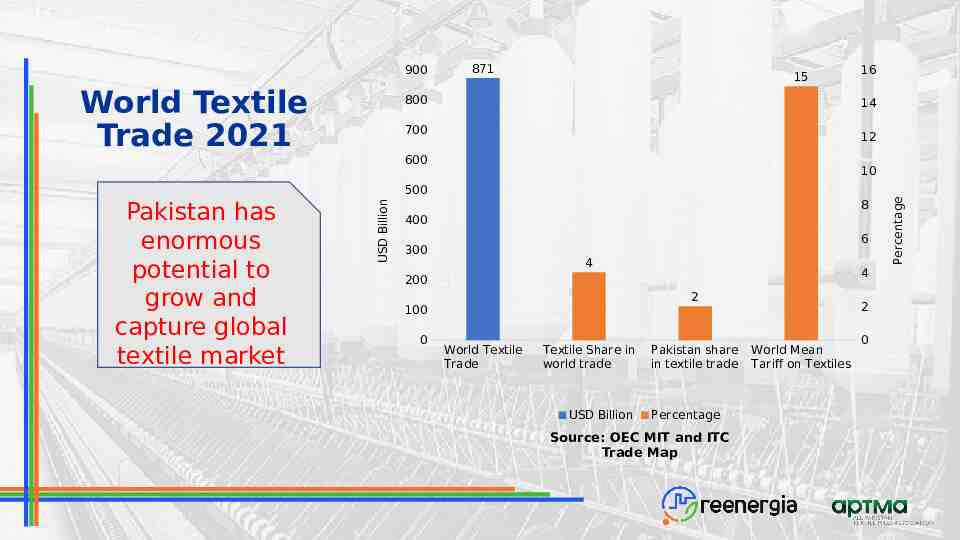
World Textile Trade 2021 871 15 800 16 14 700 12 600 10 Pakistan has enormous potential to grow and capture global textile market USD Billion 500 8 400 6 300 4 4 200 2 100 0 World Textile Trade Textile Share in world trade USD Billion Pakistan share in textile trade Percentage Source: OEC MIT and ITC Trade Map 2 World Mean Tariff on Textiles 0 Percentage 900
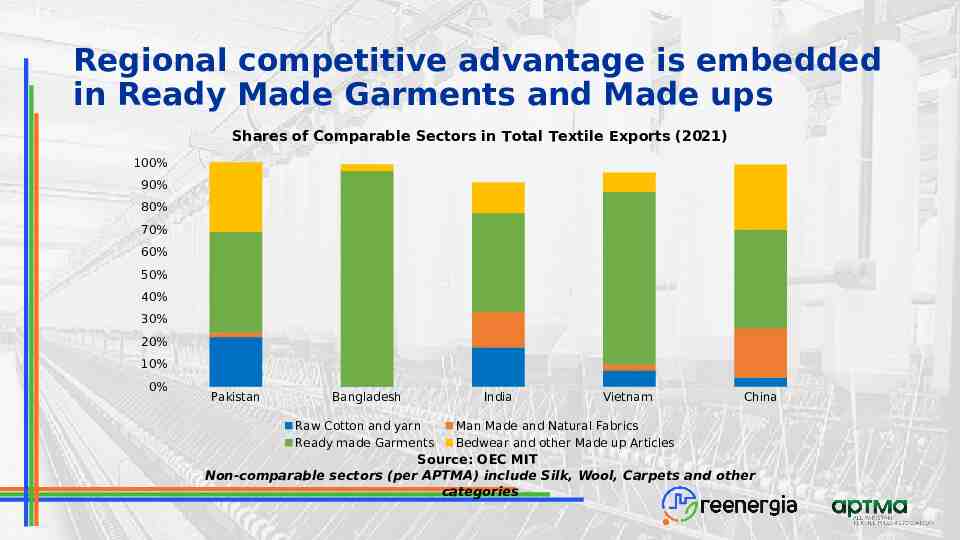
Regional competitive advantage is embedded in Ready Made Garments and Made ups Shares of Comparable Sectors in Total Textile Exports (2021) 100% 90% 80% 70% 60% 50% 40% 30% 20% 10% 0% Pakistan Bangladesh Raw Cotton and yarn Ready made Garments India Vietnam China Man Made and Natural Fabrics Bedwear and other Made up Articles Source: OEC MIT Non-comparable sectors (per APTMA) include Silk, Wool, Carpets and other categories
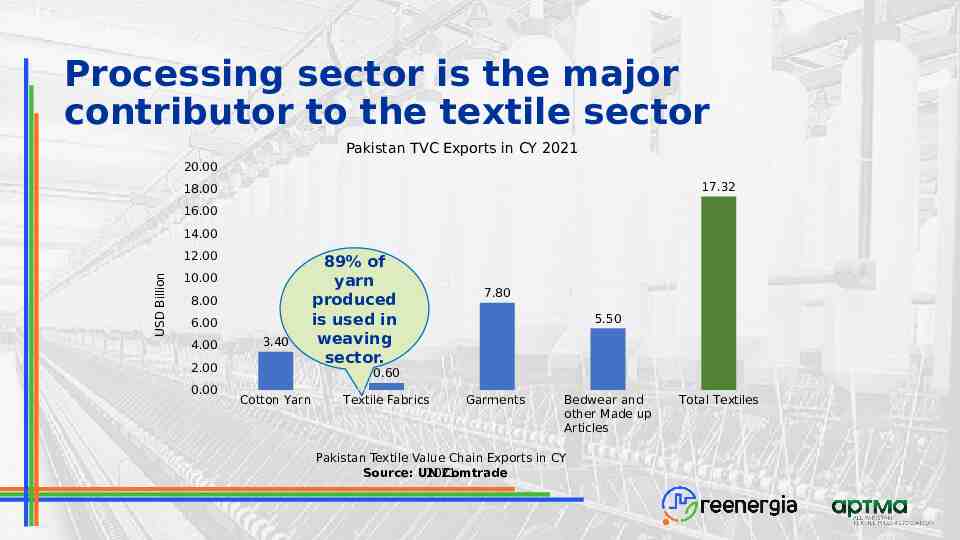
Processing sector is the major contributor to the textile sector Pakistan TVC Exports in CY 2021 20.00 17.32 18.00 16.00 14.00 USD Billion 12.00 10.00 8.00 6.00 4.00 3.40 2.00 0.00 89% of yarn produced is used in weaving sector. 7.80 5.50 0.60 Cotton Yarn Textile Fabrics Garments Bedwear and other Made up Articles Pakistan Textile Value Chain Exports in CY Source: UN Comtrade 2021 Total Textiles
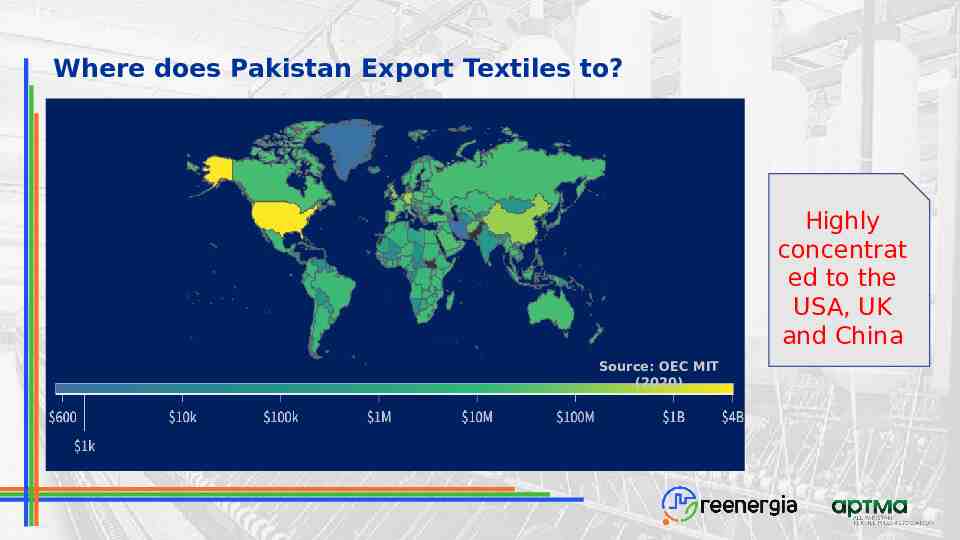
Where does Pakistan Export Textiles to? Highly concentrat ed to the USA, UK and China Source: OEC MIT (2020)
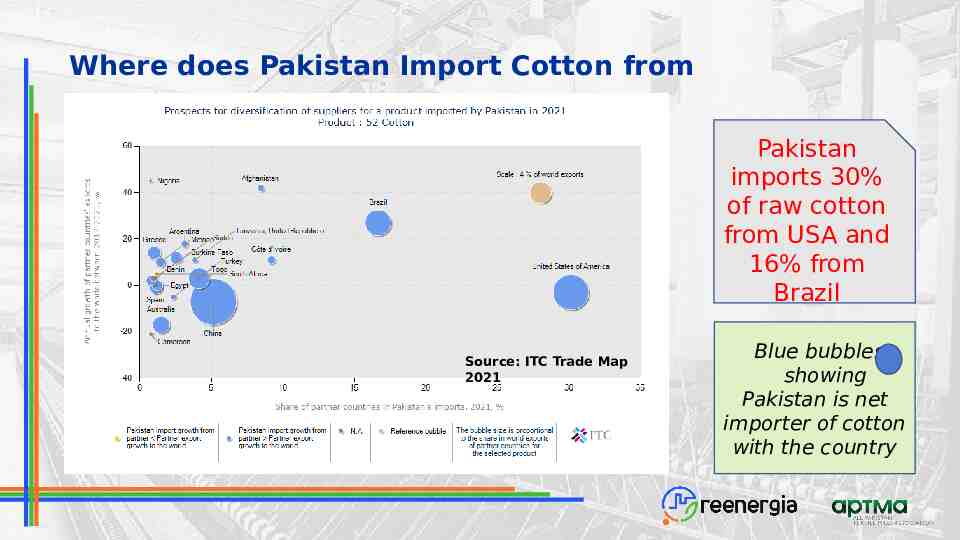
Where does Pakistan Import Cotton from Pakistan imports 30% of raw cotton from USA and 16% from Brazil Source: ITC Trade Map 2021 Blue bubbles showing Pakistan is net importer of cotton with the country
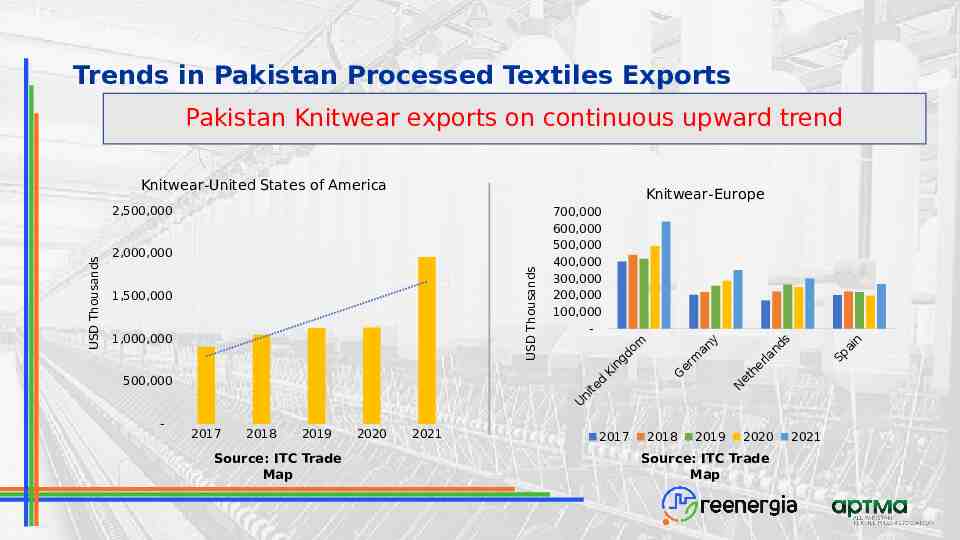
Trends in Pakistan Processed Textiles Exports Pakistan Knitwear exports on continuous upward trend Knitwear-United States of America Knitwear-Europe 2,000,000 USD Thousands USD Thousands 2,500,000 1,500,000 1,000,000 700,000 600,000 500,000 400,000 300,000 200,000 100,000 - 500,000 U - 2017 2018 2019 Source: ITC Trade Map 2020 2021 d te i n m do g n Ki 2017 er G 2018 m y an 2019 he t e N ds n rla 2020 Source: ITC Trade Map n ai p S 2021
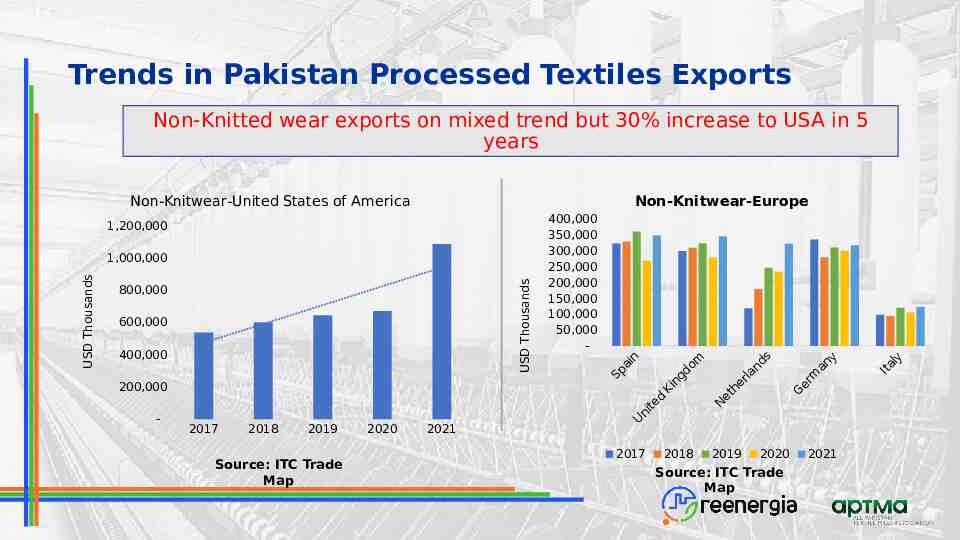
Trends in Pakistan Processed Textiles Exports Non-Knitted wear exports on mixed trend but 30% increase to USA in 5 years Non-Knitwear-United States of America Non-Knitwear-Europe 1,200,000 USD Thousands USD Thousands 1,000,000 800,000 600,000 400,000 200,000 - 2017 2018 2019 Source: ITC Trade Map 2020 2021 400,000 350,000 300,000 250,000 200,000 150,000 100,000 50,000 - n ai p S U d te i n 2017 om d ng Ki 2018 he et N 2019 ds n rla 2020 Source: ITC Trade Map er G m y an 2021 Ita ly
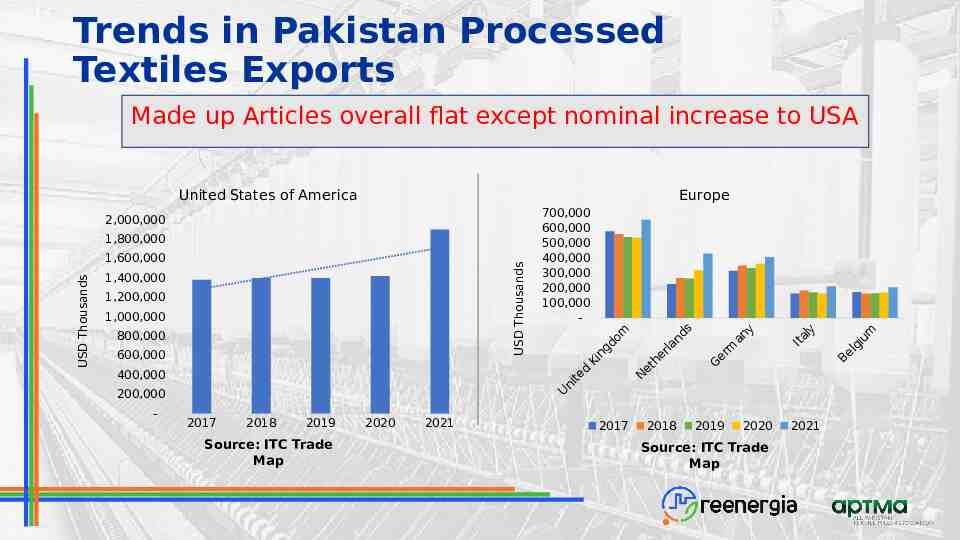
Trends in Pakistan Processed Textiles Exports Made up Articles overall flat except nominal increase to USA United States of America Europe 2,000,000 1,800,000 USD Thousands USD Thousands 1,600,000 1,400,000 1,200,000 1,000,000 800,000 600,000 700,000 600,000 500,000 400,000 300,000 200,000 100,000 - 400,000 U 200,000 - 2017 2018 2019 Source: ITC Trade Map 2020 2021 d te i n om d ng Ki N 2017 he et ds n rla 2018 er G 2019 m an y 2020 Source: ITC Trade Map Ita ly 2021 m iu g l Be
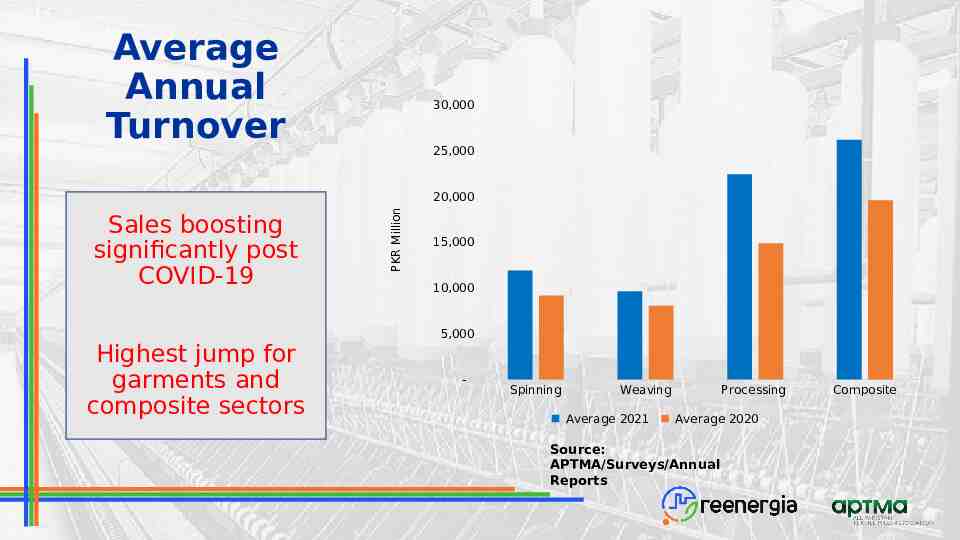
Average Annual Turnover 30,000 25,000 Sales boosting significantly post COVID-19 Highest jump for garments and composite sectors PKR Million 20,000 15,000 10,000 5,000 - Spinning Weaving Average 2021 Processing Average 2020 Source: APTMA/Surveys/Annual Reports Composite
Summary of ToR 1 Textile exports gaining pace in the past 5 years. Textile firm's turnover has increased post-COVID. Exports to USA has recorded relatively higher increase.
Electricity and Gas Consumption Across Sectors in Pakistan and Region TOR # 5
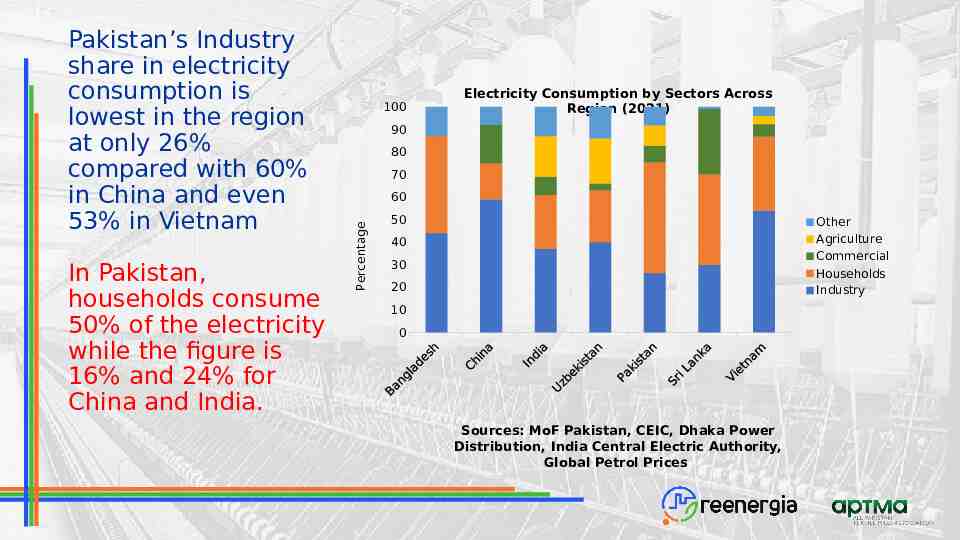
In Pakistan, households consume 50% of the electricity while the figure is 16% and 24% for China and India. 100 Electricity Consumption by Sectors Across Region (2021) 90 80 70 60 Percentage Pakistan’s Industry share in electricity consumption is lowest in the region at only 26% compared with 60% in China and even 53% in Vietnam 50 Other Agriculture Commercial Households Industry 40 30 20 10 0 Sources: MoF Pakistan, CEIC, Dhaka Power Distribution, India Central Electric Authority, Global Petrol Prices
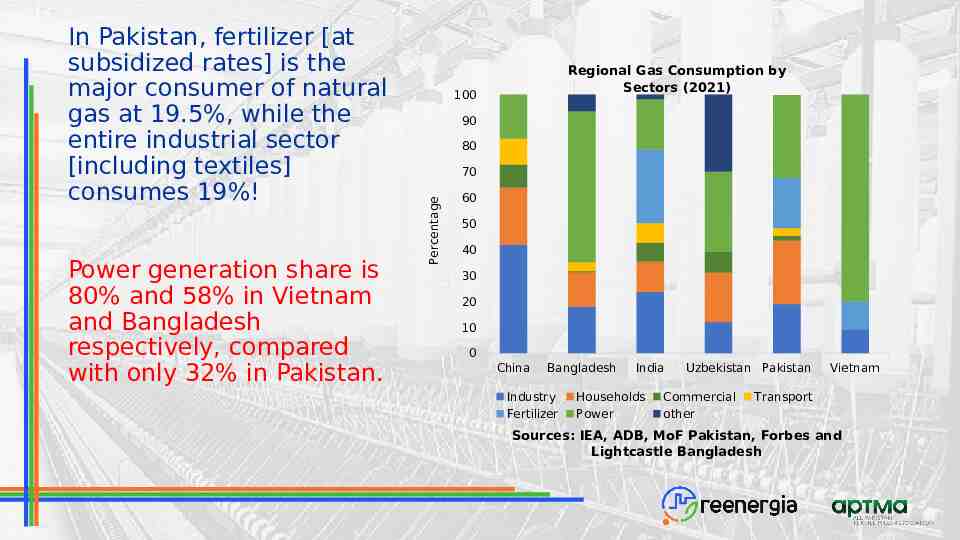
Power generation share is 80% and 58% in Vietnam and Bangladesh respectively, compared with only 32% in Pakistan. Regional Gas Consumption by Sectors (2021) 100 90 80 70 Percentage In Pakistan, fertilizer [at subsidized rates] is the major consumer of natural gas at 19.5%, while the entire industrial sector [including textiles] consumes 19%! 60 50 40 30 20 10 0 China Bangladesh Industry Fertilizer India Households Power Uzbekistan Pakistan Commercial other Vietnam Transport Sources: IEA, ADB, MoF Pakistan, Forbes and Lightcastle Bangladesh
Summary of ToR 5 Pakistan industry has a minor share in electricity and gas consumption compared to other countries in the region.
Prevalence and Efficiency of Gas CPPs in Textile Industry of Pakistan and Region TOR # 7
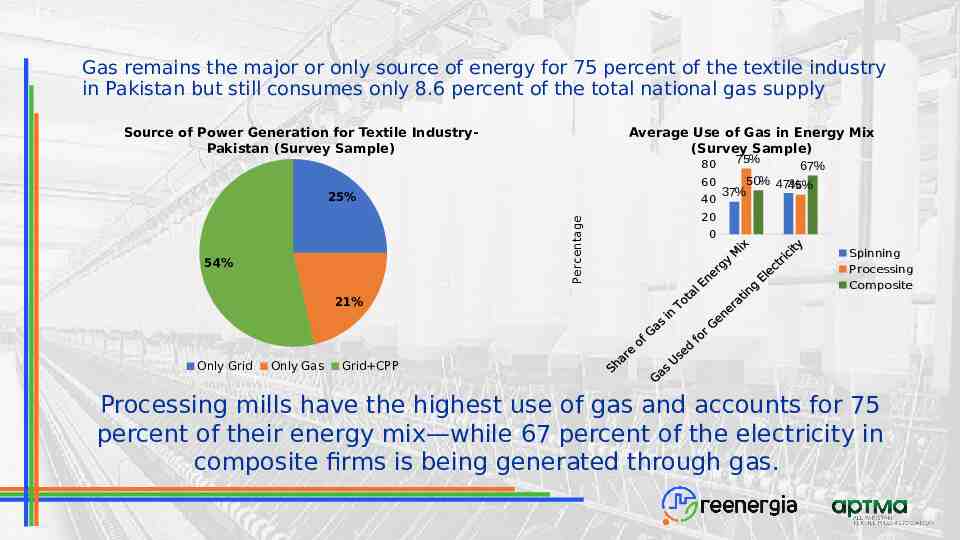
Gas remains the major or only source of energy for 75 percent of the textile industry in Pakistan but still consumes only 8.6 percent of the total national gas supply Source of Power Generation for Textile IndustryPakistan (Survey Sample) Average Use of Gas in Energy Mix (Survey Sample) 80 67% 50% 47% 60 45% 37% 25% 40 Percentage 54% 75% 20 0 Spinning Processing Composite 21% Only Grid Only Gas Grid CPP Processing mills have the highest use of gas and accounts for 75 percent of their energy mix—while 67 percent of the electricity in composite firms is being generated through gas.
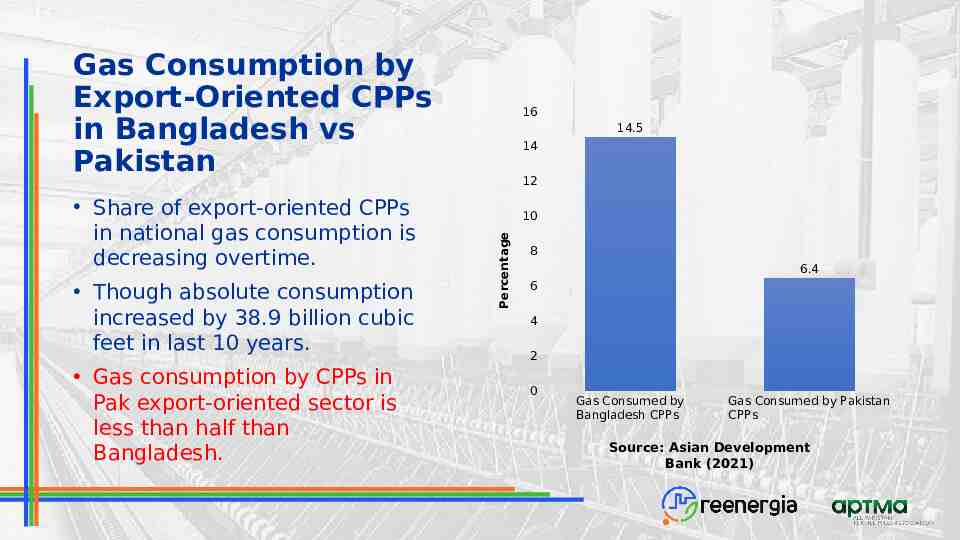
Gas Consumption by Export-Oriented CPPs in Bangladesh vs Pakistan Though absolute consumption increased by 38.9 billion cubic feet in last 10 years. Gas consumption by CPPs in Pak export-oriented sector is less than half than Bangladesh. 14.5 14 12 10 Percentage Share of export-oriented CPPs in national gas consumption is decreasing overtime. 16 8 6.4 6 4 2 0 Gas Consumed by Bangladesh CPPs Gas Consumed by Pakistan CPPs Source: Asian Development Bank (2021)
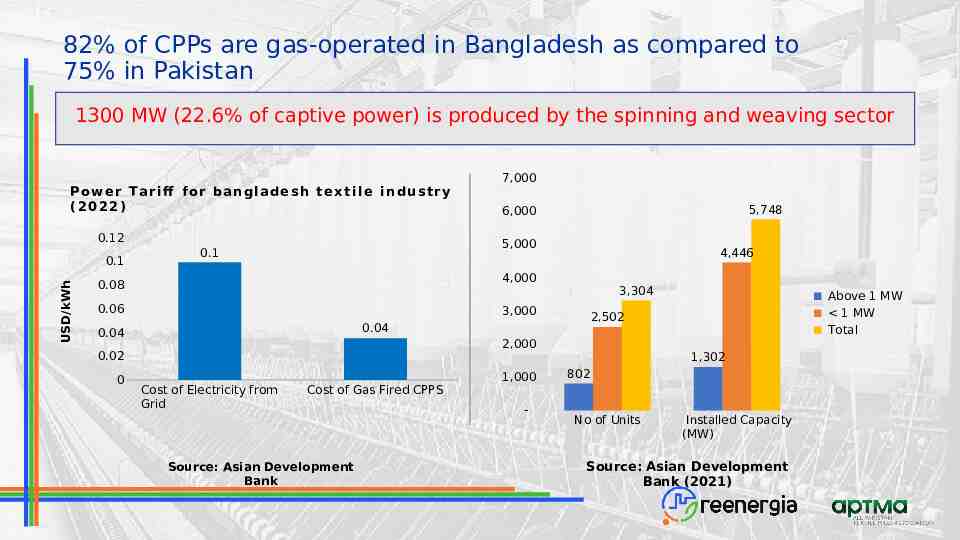
82% of CPPs are gas-operated in Bangladesh as compared to 75% in Pakistan 1300 MW (22.6% of captive power) is produced by the spinning and weaving sector Po w e r T ari ff fo r ban gl ade sh te x t i l e i n dustry (2022) 0.12 USD/kWh 0.1 5,748 6,000 5,000 0.1 4,446 4,000 0.08 0.06 3,304 3,000 2,000 0.02 Cost of Electricity from Grid Cost of Gas Fired CPPS Source: Asian Development Bank 1,000 - Above 1 MW 1 MW Total 2,502 0.04 0.04 0 7,000 1,302 802 No of Units Installed Capacity (MW) Source: Asian Development Bank (2021)
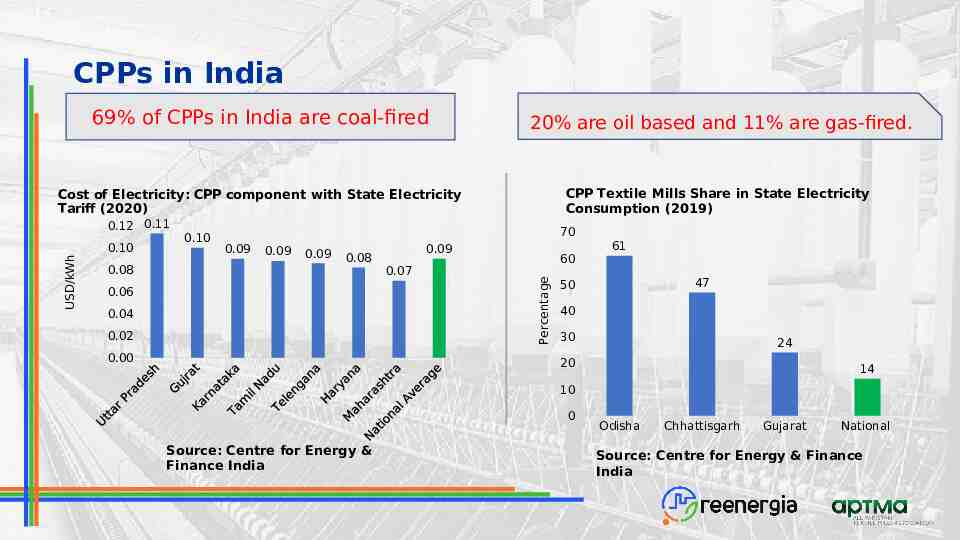
CPPs in India 69% of CPPs in India are coal-fired 20% are oil based and 11% are gas-fired. Cost of Electricity: CPP component with State Electricity Tariff (2020) CPP Textile Mills Share in State Electricity Consumption (2019) 0.10 0.08 0.10 70 0.09 0.09 0.09 0.08 0.06 0.04 0.02 0.00 0.09 0.07 60 Percentage USD/kWh 0.12 0.11 61 47 50 40 30 24 20 14 10 0 Source: Centre for Energy & Finance India Odisha Chhattisgarh Gujarat National Source: Centre for Energy & Finance India
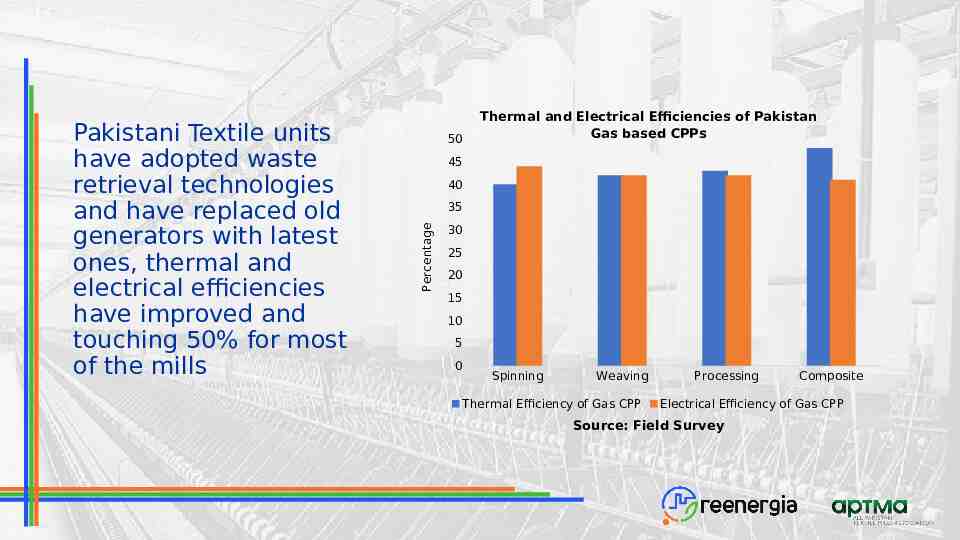
50 45 40 35 Percentage Pakistani Textile units have adopted waste retrieval technologies and have replaced old generators with latest ones, thermal and electrical efficiencies have improved and touching 50% for most of the mills Thermal and Electrical Efficiencies of Pakistan Gas based CPPs 30 25 20 15 10 5 0 Spinning Weaving Thermal Efficiency of Gas CPP Processing Composite Electrical Efficiency of Gas CPP Source: Field Survey
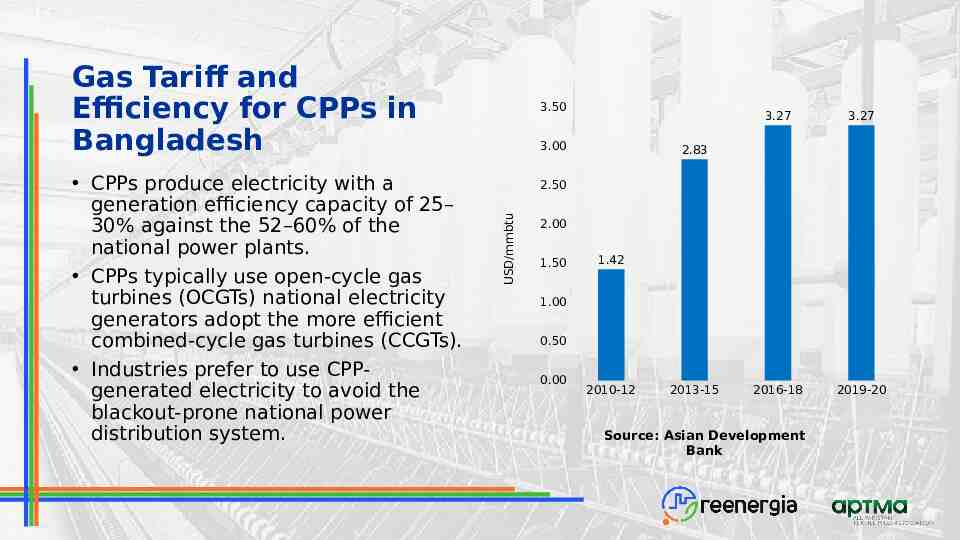
Gas Tariff and Efficiency for CPPs in Bangladesh 3.00 3.27 3.27 2016-18 2019-20 2.83 2.50 USD/mmbtu CPPs produce electricity with a generation efficiency capacity of 25– 30% against the 52–60% of the national power plants. CPPs typically use open-cycle gas turbines (OCGTs) national electricity generators adopt the more efficient combined-cycle gas turbines (CCGTs). Industries prefer to use CPPgenerated electricity to avoid the blackout-prone national power distribution system. 3.50 2.00 1.50 1.42 1.00 0.50 0.00 2010-12 2013-15 Source: Asian Development Bank
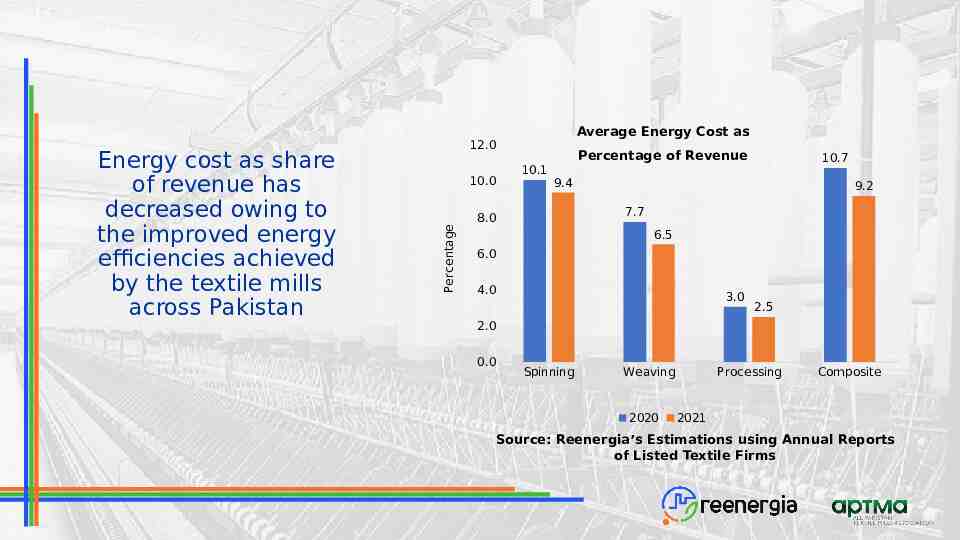
10.0 Percentage Energy cost as share of revenue has decreased owing to the improved energy efficiencies achieved by the textile mills across Pakistan Average Energy Cost as 12.0 Percentage of Revenue 10.1 10.7 9.4 9.2 7.7 8.0 6.5 6.0 4.0 3.0 2.5 2.0 0.0 Spinning Weaving 2020 Processing Composite 2021 Source: Reenergia’s Estimations using Annual Reports of Listed Textile Firms
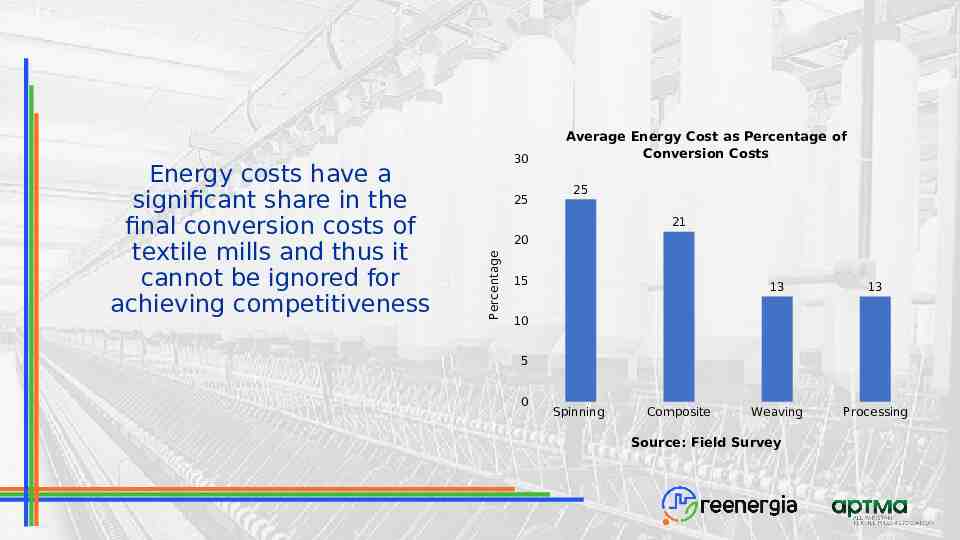
25 25 21 20 Percentage Energy costs have a significant share in the final conversion costs of textile mills and thus it cannot be ignored for achieving competitiveness 30 Average Energy Cost as Percentage of Conversion Costs 15 13 13 Weaving Processing 10 5 0 Spinning Composite Source: Field Survey
Summary of ToR 7 CPPs in Pakistan consume relatively less gas than Bangladesh. CPPS in Pakistan export-oriented sectors are relatively more efficient than Bangladesh.
Comparison of Pakistan and Regional Gas and Electricity Tariffs TOR # 5
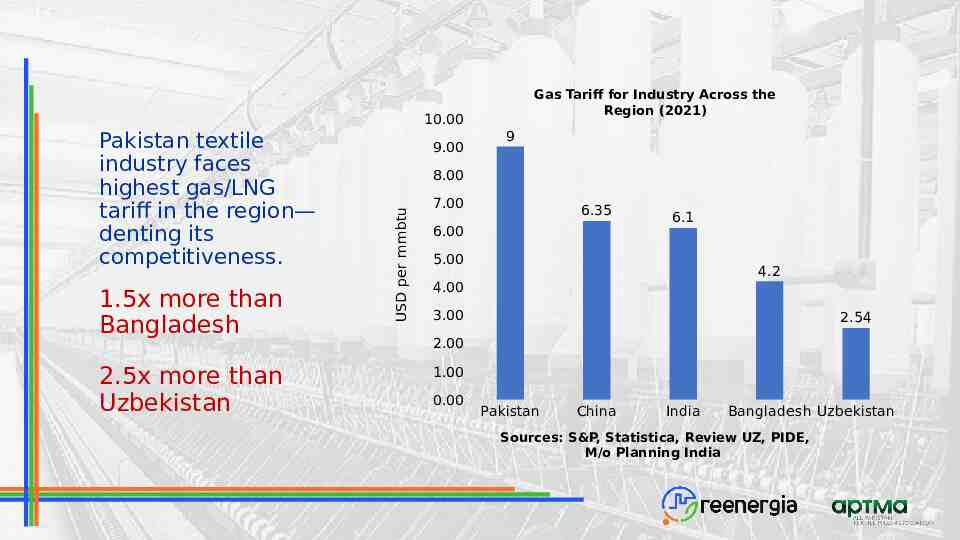
Gas Tariff for Industry Across the Region (2021) 10.00 1.5x more than Bangladesh 2.5x more than Uzbekistan 9.00 9 8.00 USD per mmbtu Pakistan textile industry faces highest gas/LNG tariff in the region— denting its competitiveness. 7.00 6.35 6.00 6.1 5.00 4.2 4.00 3.00 2.54 2.00 1.00 0.00 Pakistan China India Bangladesh Uzbekistan Sources: S&P, Statistica, Review UZ, PIDE, M/o Planning India
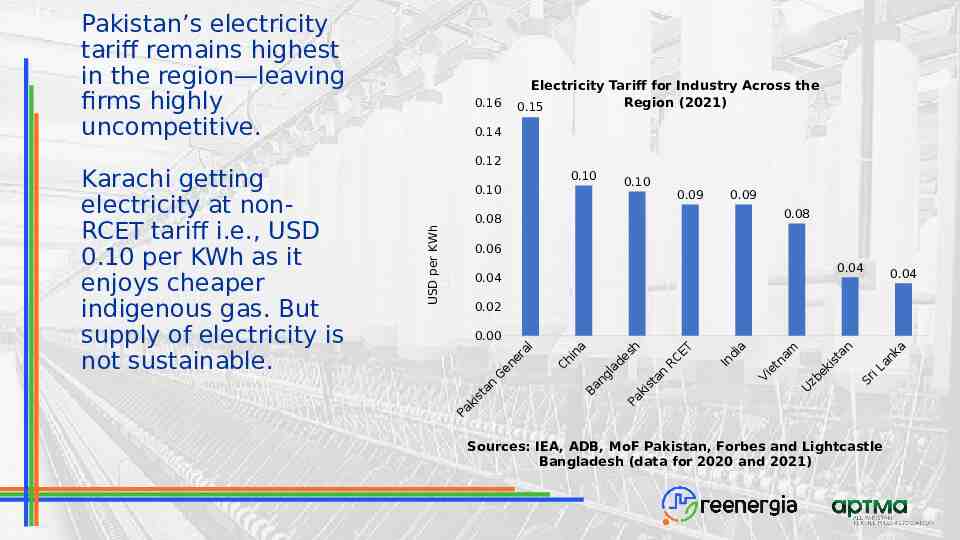
Pakistan’s electricity tariff remains highest in the region—leaving firms highly uncompetitive. 0.14 0.12 0.10 0.10 0.10 0.09 0.09 0.08 0.08 USD per KWh Karachi getting electricity at nonRCET tariff i.e., USD 0.10 per KWh as it enjoys cheaper indigenous gas. But supply of electricity is not sustainable. 0.16 Electricity Tariff for Industry Across the Region (2021) 0.15 0.06 0.04 0.04 0.04 0.02 0.00 P an t is ak er n e G al na i Ch Ba sh e d la g n P an st i ak ET C R I ia d n am n et Vi U an t s ki e zb i Sr L Sources: IEA, ADB, MoF Pakistan, Forbes and Lightcastle Bangladesh (data for 2020 and 2021) ka n a
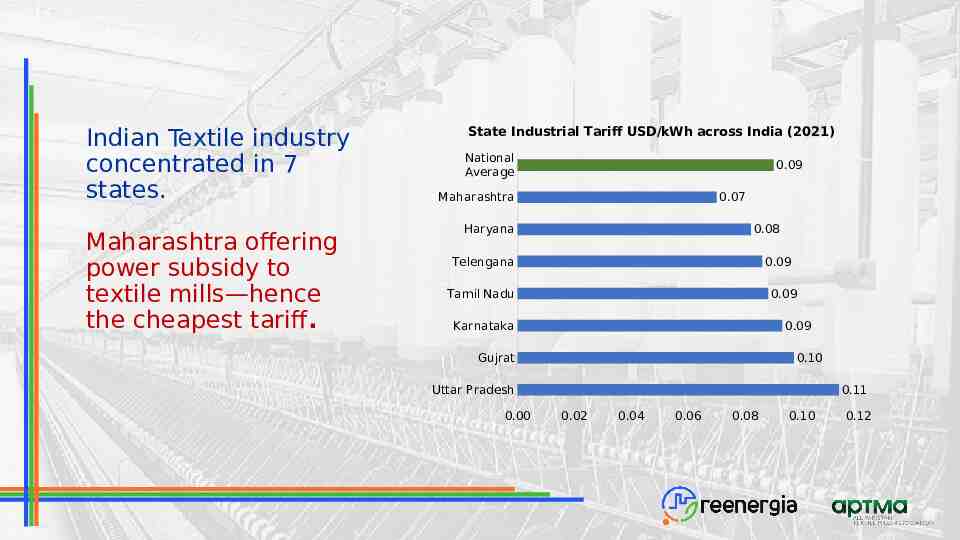
Indian Textile industry concentrated in 7 states. Maharashtra offering power subsidy to textile mills—hence the cheapest tariff. State Industrial Tariff USD/kWh across India (2021) National Average 0.09 Maharashtra 0.07 Haryana 0.08 Telengana 0.09 Tamil Nadu 0.09 Karnataka 0.09 Gujrat 0.10 Uttar Pradesh 0.00 0.11 0.02 0.04 0.06 0.08 0.10 0.12
Summary of TOR 5 Pakistan’s electricity and gas tariff for industry is highest in the region Even the RCET tariff for electricity remains higher than few competitor countries.
Assessing the Actual Cost of Service in Pakistan of Gas & Power Supply and Estimating the Cost of RCET as Percentage of Exports TOR # 2,3 & 8
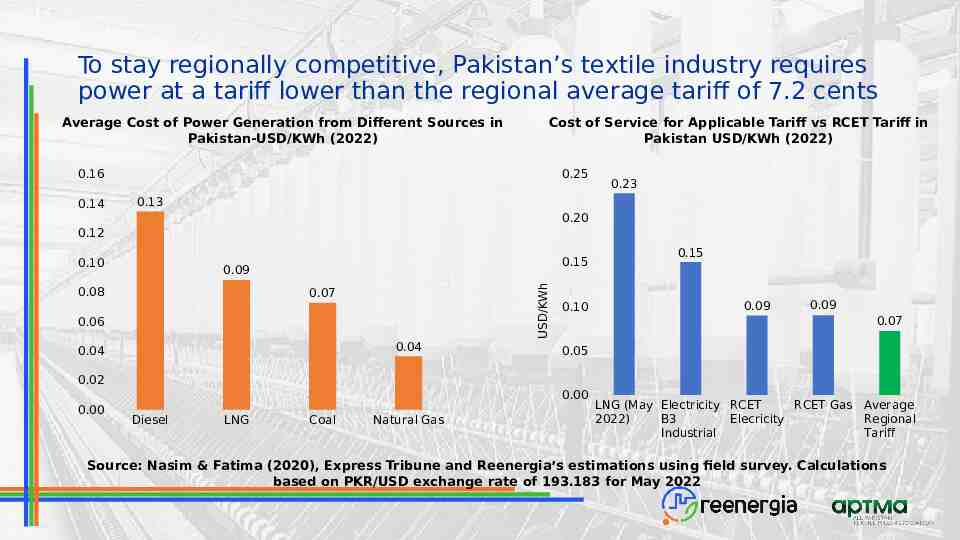
To stay regionally competitive, Pakistan’s textile industry requires power at a tariff lower than the regional average tariff of 7.2 cents Average Cost of Power Generation from Different Sources in Pakistan-USD/KWh (2022) Cost of Service for Applicable Tariff vs RCET Tariff in Pakistan USD/KWh (2022) 0.25 0.16 0.14 0.23 0.13 0.20 0.12 0.10 0.15 0.08 USD/KWh 0.09 0.07 0.06 0.04 0.04 0.10 0.15 0.09 0.09 0.07 0.05 0.02 0.00 0.00 Diesel LNG Coal Natural Gas LNG (May Electricity RCET RCET Gas Average 2022) B3 Elecricity Regional Industrial Tariff Source: Nasim & Fatima (2020), Express Tribune and Reenergia’s estimations using field survey. Calculations based on PKR/USD exchange rate of 193.183 for May 2022
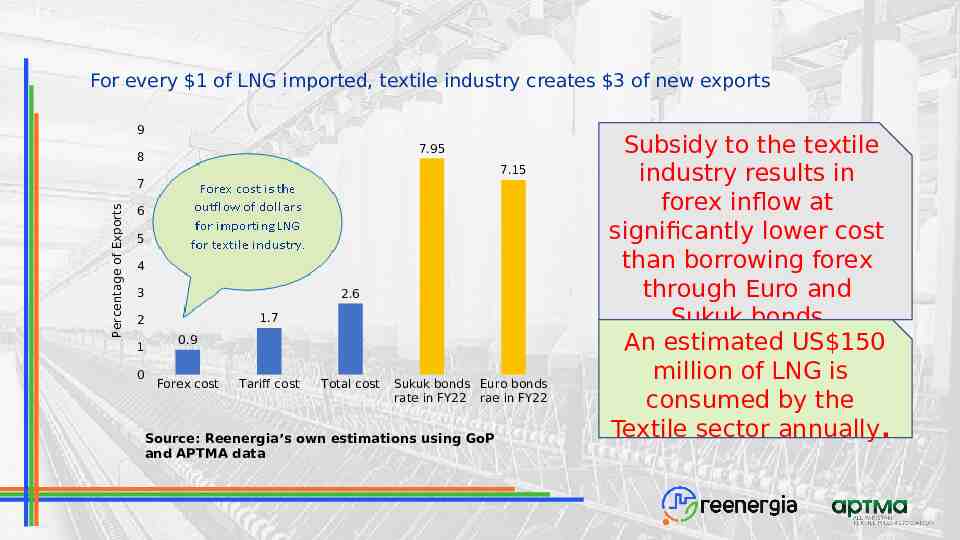
For every 1 of LNG imported, textile industry creates 3 of new exports 9 7.95 8 7.15 Percentage of Exports 7 6 5 4 3 2.6 1.7 2 1 0 0.9 Forex cost Tariff cost Total cost Sukuk bonds Euro bonds rate in FY22 rae in FY22 Source: Reenergia’s own estimations using GoP and APTMA data Subsidy to the textile industry results in forex inflow at significantly lower cost than borrowing forex through Euro and Sukuk bonds An estimated US 150 million of LNG is consumed by the Textile sector annually.
Summary of TOR 2, 3 & 8 Providing subsidy to textile firms by cheap gas is a much cheaper alternative for government to earn forex rather than borrowing from international market. Textile firms cannot compete internationally at market prices as they are 3 times higher than the regional average tariff of 7.2 cents/KWh.
QUANTUM OF PRODUCTION LOSSES DUE TO POOR QUALITY OF ELECTRICITY SUPPLY/LOADSHEDDING TOR # 9
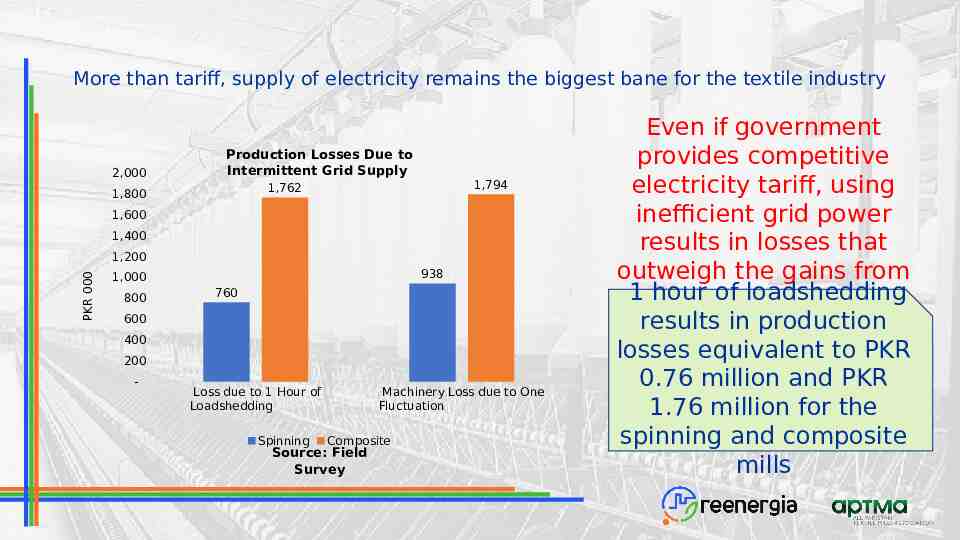
More than tariff, supply of electricity remains the biggest bane for the textile industry 2,000 Production Losses Due to Intermittent Grid Supply 1,794 1,762 1,800 1,600 1,400 PKR 000 1,200 938 1,000 800 760 600 400 200 - Loss due to 1 Hour of Loadshedding Spinning Machinery Loss due to One Fluctuation Composite Source: Field Survey Even if government provides competitive electricity tariff, using inefficient grid power results in losses that outweigh the gains from 1 hour tariff byofa loadshedding huge margin results in production losses equivalent to PKR 0.76 million and PKR 1.76 million for the spinning and composite mills
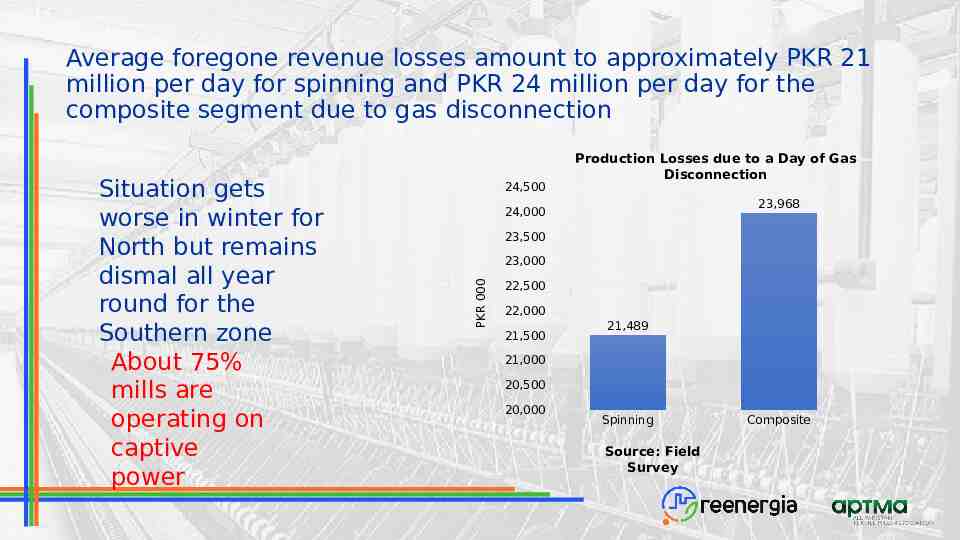
Average foregone revenue losses amount to approximately PKR 21 million per day for spinning and PKR 24 million per day for the composite segment due to gas disconnection 24,500 23,968 24,000 23,500 23,000 PKR 000 Situation gets worse in winter for North but remains dismal all year round for the Southern zone About 75% mills are operating on captive power Production Losses due to a Day of Gas Disconnection 22,500 22,000 21,500 21,489 21,000 20,500 20,000 Spinning Source: Field Survey Composite
Summary of TOR 9 Supply is a bigger issue than tariff for electricity Textile industry cannot run on grid electricity at current infrastructure. Gas disconnection to textile industry is destructive for textile industry as they cannot rely on grid.
Development of Economic Model to Identify the Role of RCET on Maintaining and Expanding Employment and Exports & Negative Impact of Change In the RCET to Full Energy Rates Prevailing in Pakistan. TOR # 4,10 & 12
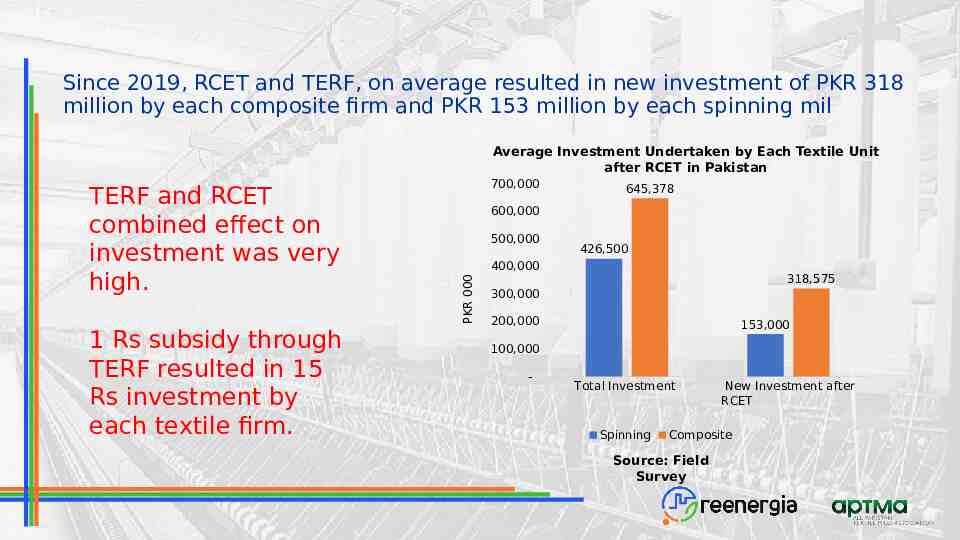
Since 2019, RCET and TERF, on average resulted in new investment of PKR 318 million by each composite firm and PKR 153 million by each spinning mil Average Investment Undertaken by Each Textile Unit after RCET in Pakistan 1 Rs subsidy through TERF resulted in 15 Rs investment by each textile firm. 645,378 600,000 500,000 426,500 400,000 PKR 000 TERF and RCET combined effect on investment was very high. 700,000 318,575 300,000 200,000 153,000 100,000 - Total Investment Spinning New Investment after RCET Composite Source: Field Survey
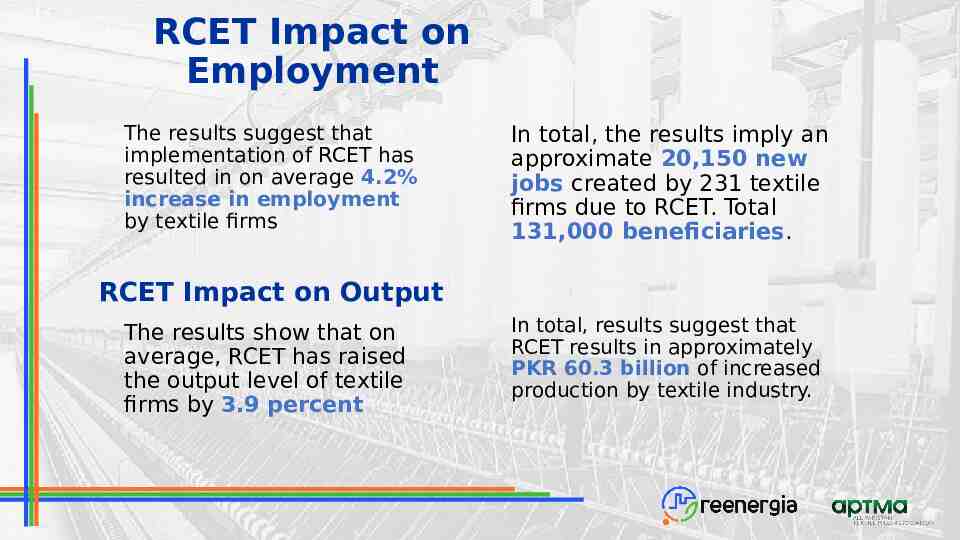
RCET Impact on Employment The results suggest that implementation of RCET has resulted in on average 4.2% increase in employment by textile firms In total, the results imply an approximate 20,150 new jobs created by 231 textile firms due to RCET. Total 131,000 beneficiaries. RCET Impact on Output The results show that on average, RCET has raised the output level of textile firms by 3.9 percent In total, results suggest that RCET results in approximately PKR 60.3 billion of increased production by textile industry.
RCET Impact on Exports The study also found that 1% increase in investment by textile firm is associated with 7.3 percent rise in the exports On average, our sample firms export USD 30 million annually and a 1% increase in investment implies USD 2.1 million of new exports by each firm. As RCET results in higher investment, exports also go up simultaneously.
Role of Long-Term Commitment on RCET In Precipitating Investment and Expansion and Challenges Faced by the Textile Industry TOR # 11
Sustainable development in any sector is highly dependent on the consistence policy framework and commitment from relevant stakeholders A stable policy enables all agents of change and growth to act and interact at a level playing field providing equal opportunities for all. Supply and demand dynamics are the key drivers for most important production related decisions and expansion of textile industry in the economy
Inconsistent supply of energy is one of the most significant factors hampering the productivity of the textile sector especially for the South zone as supply in North remains relatively stable but not conducive Provision of affordable and reliable energy supply is deemed essential to the survival of the industry and its export competitiveness Industry has also faced distress in the energy supply owing to the gas curtailment since November 2021 and again on July 1st 2022.
Due to the unavailability of the consistent energy supply, it is difficult for the industry to introduce more efficient technology and upgrade to the international standards New entrants on the other hand have reportedly experienced delays in procurement of energy (both Grid and Gas) and was unable to start operations in time. Upgradation of grid infrastructure is the foremost action required for maintaining competitiveness of the exporters.
In the long-term, exporters are worse due to massive Rupee devaluation as it raises the input cost significantly—rending exports to be uncompetitive Pakistan is unable to produce the required quality and quantity of cotton/ yarn used as primary raw material and thus relies on imported cotton The common believe that exporters are happy with continuous devaluation of Rupee should now be discarded and a policy favoring highly undervalued Rupee should be abolished.
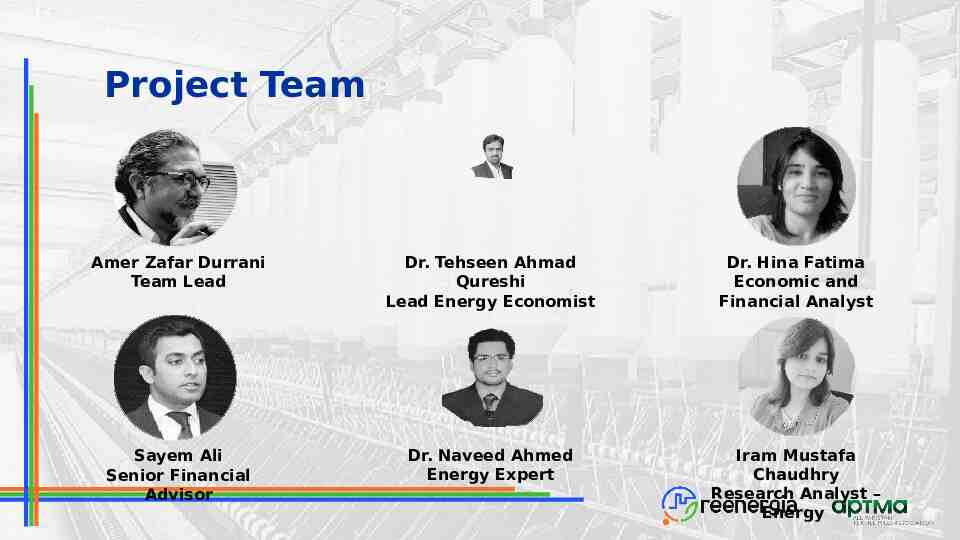
Project Team Amer Zafar Durrani Team Lead Dr. Tehseen Ahmad Qureshi Lead Energy Economist Dr. Hina Fatima Economic and Financial Analyst Sayem Ali Senior Financial Advisor Dr. Naveed Ahmed Energy Expert Iram Mustafa Chaudhry Research Analyst – Energy
Annexure
Survey
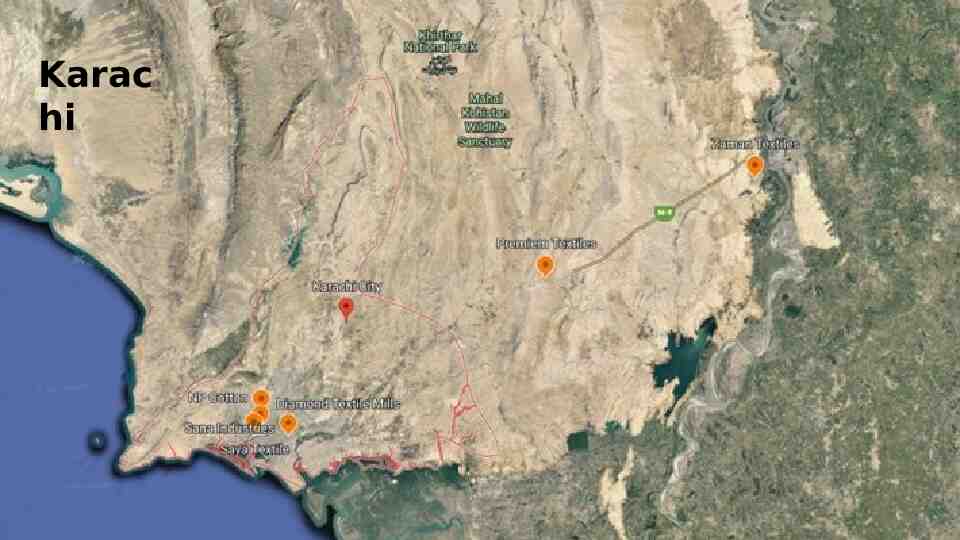
Karac hi
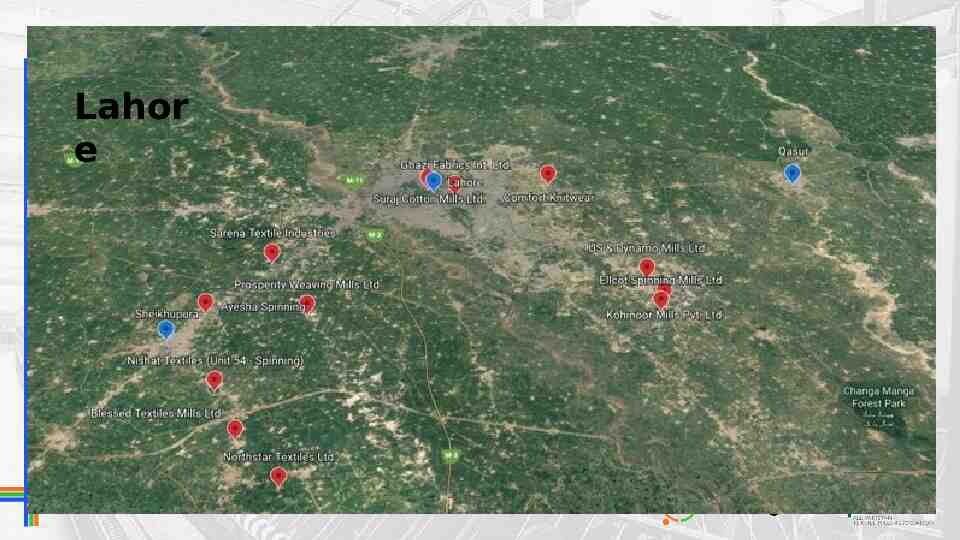
Lahor e
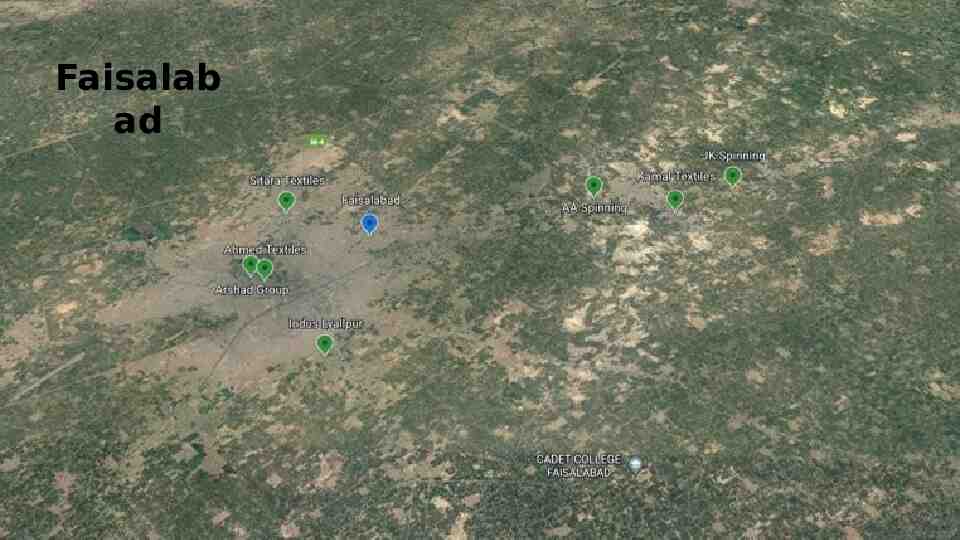
Faisalab ad
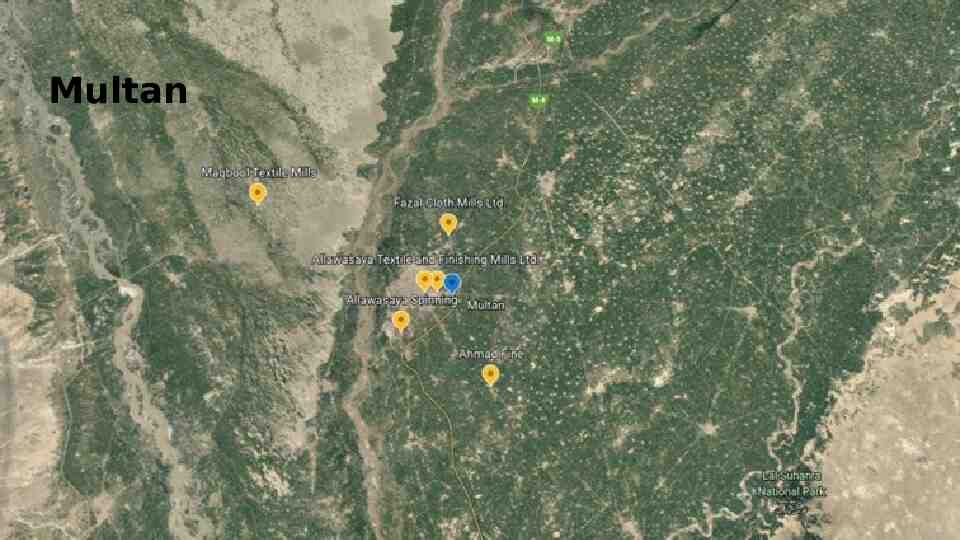
Multan
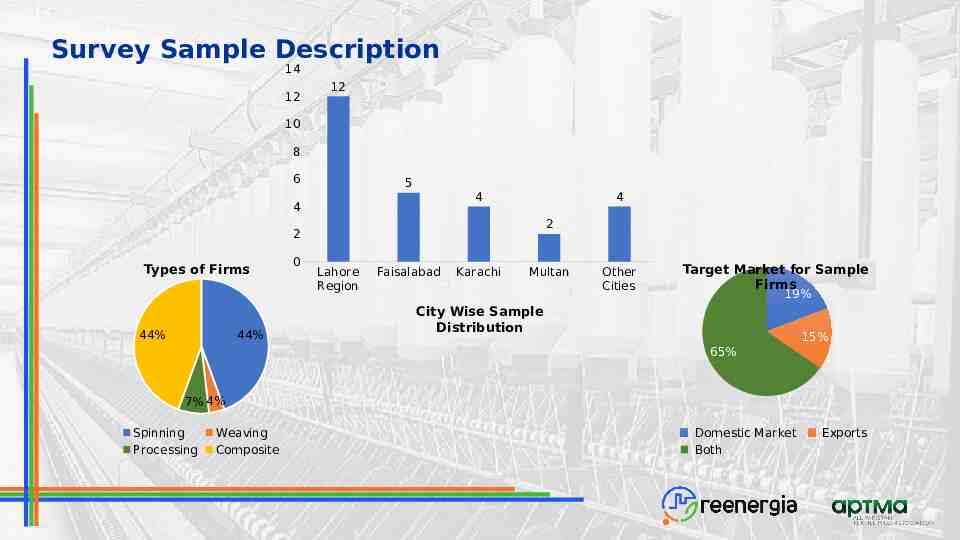
Survey Sample Description 14 12 12 10 8 6 5 4 4 4 2 2 Types of Firms 44% 44% 0 Lahore Region Faisalabad Karachi Multan Other Cities Target Market for Sample Firms 19% City Wise Sample Distribution 15% 65% 7% 4% Spinning Processing Weaving Composite Domestic Market Both Exports
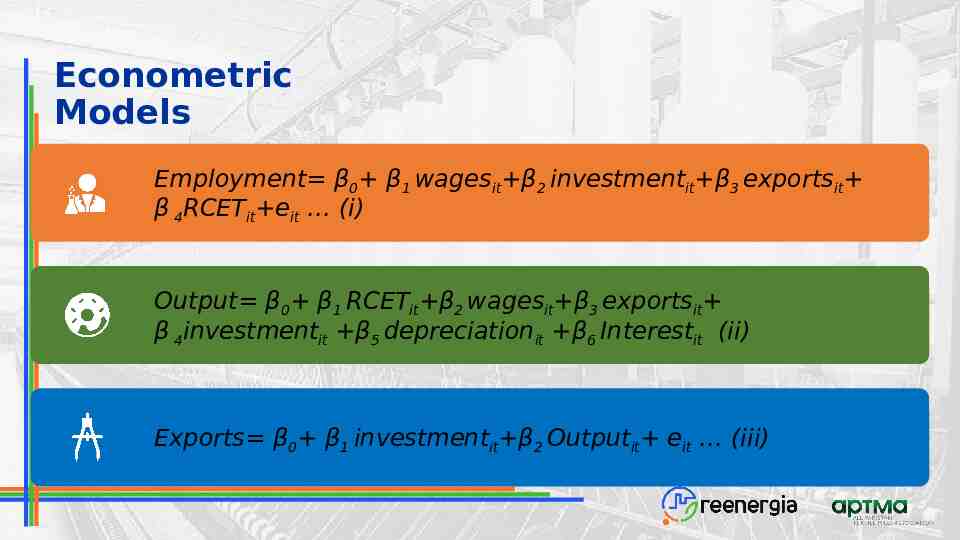
Econometric Models Employment β0 β1 wagesit β2 investmentit β3 exportsit β 4RCETit eit (i) Output β0 β1 RCETit β2 wagesit β3 exportsit β 4investmentit β5 depreciationit β6 Interestit (ii) Exports β0 β1 investmentit β2 Outputit eit (iii)
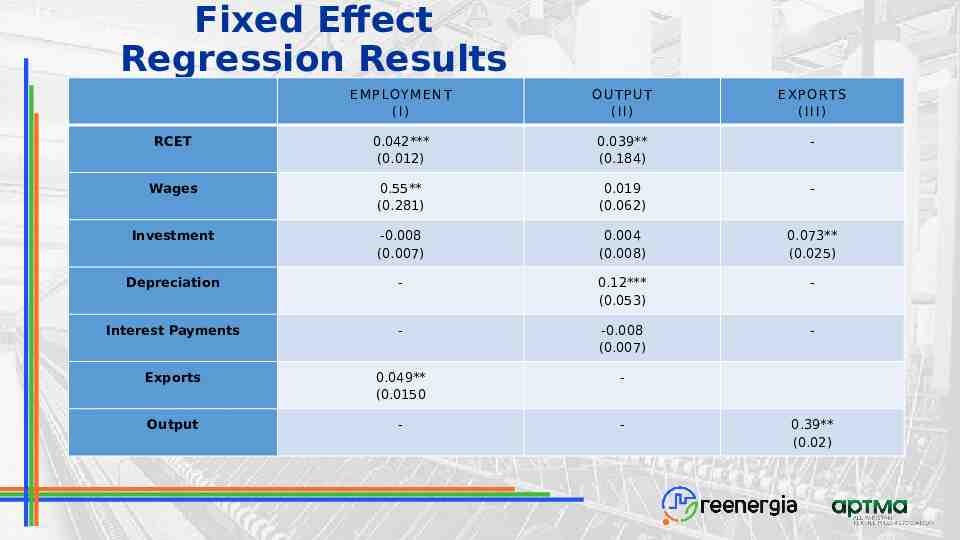
Fixed Effect Regression Results E M P LOY M E N T (I) OUTPUT (II) E X P O RT S (III) RCET 0.042*** (0.012) 0.039** (0.184) - Wages 0.55** (0.281) 0.019 (0.062) - Investment -0.008 (0.007) 0.004 (0.008) 0.073** (0.025) Depreciation - 0.12*** (0.053) - Interest Payments - -0.008 (0.007) - Exports 0.049** (0.0150 - Output - - 0.39** (0.02)
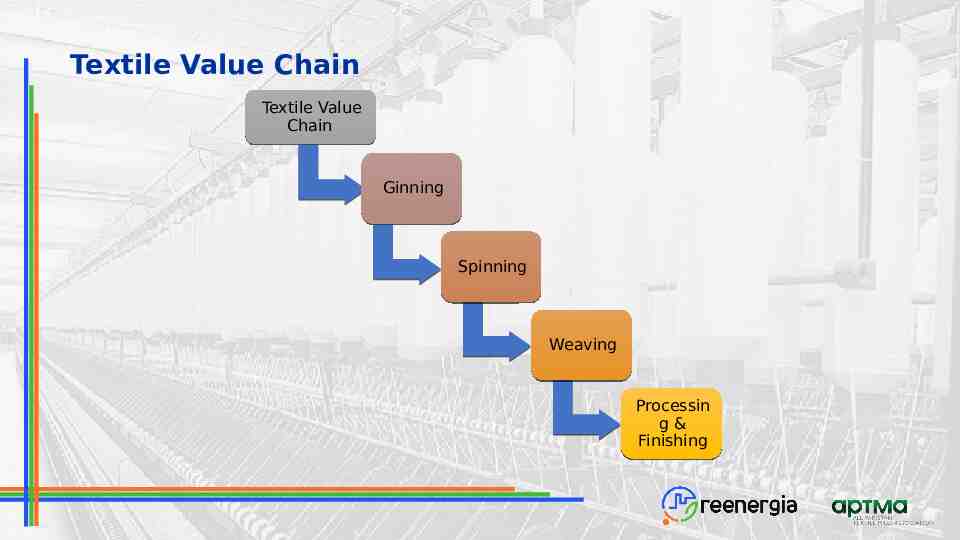
Textile Sector Value Chain
Textile Value Chain Textile Value Chain Ginning Spinning Weaving Processin g& Finishing
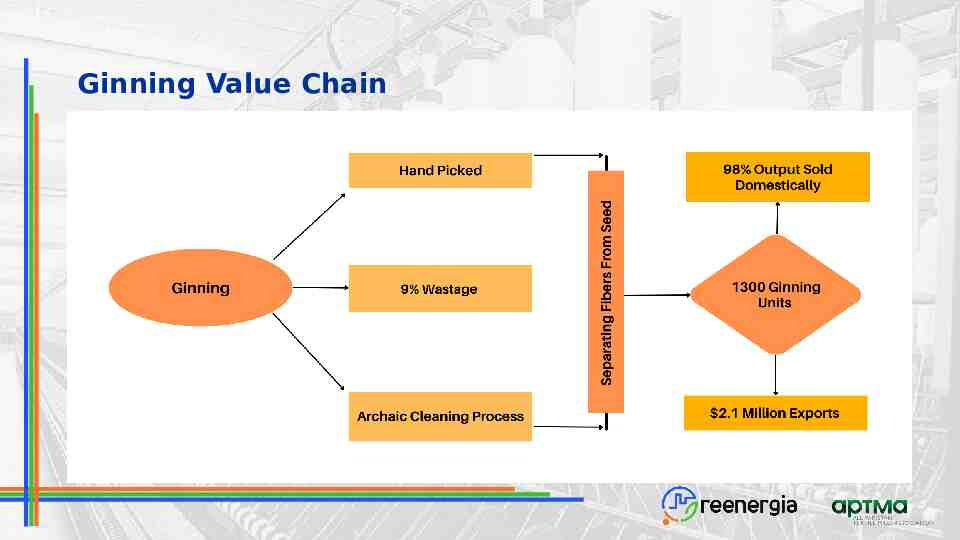
Ginning Value Chain
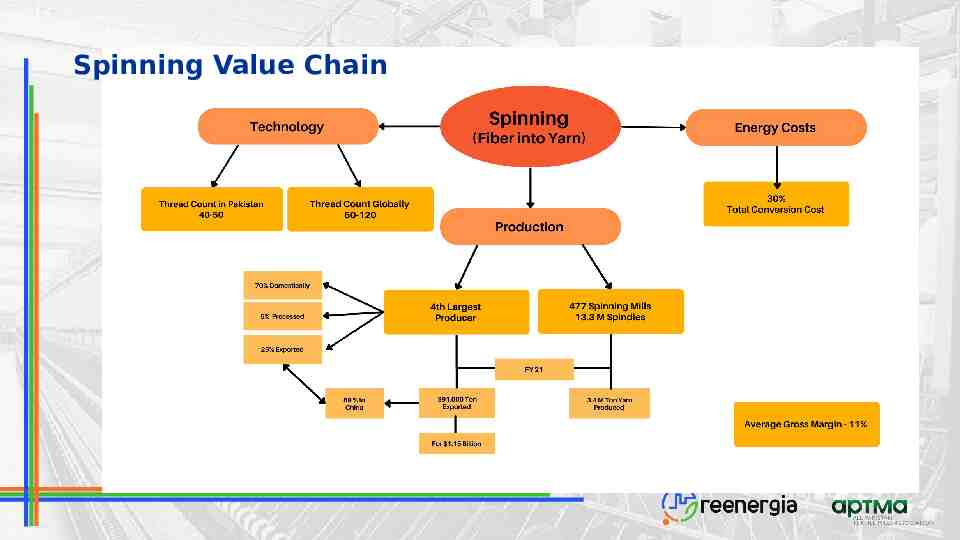
Spinning Value Chain
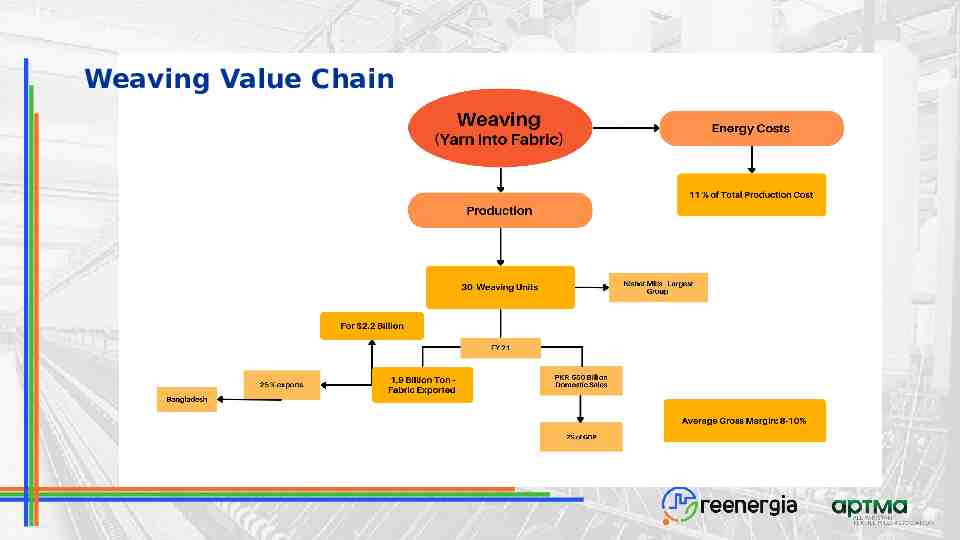
Weaving Value Chain
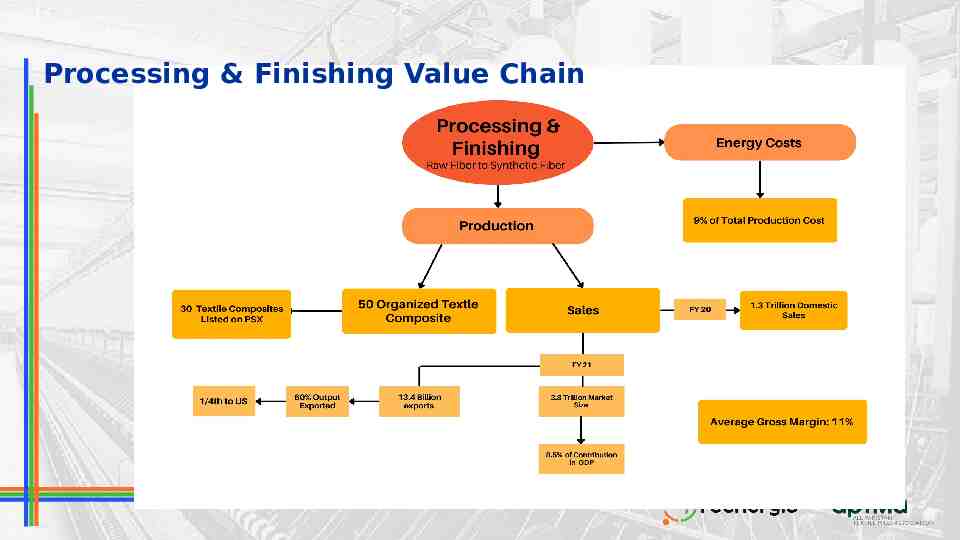
Processing & Finishing Value Chain