Overview Biostatistics Applications of Statistics in Research Bandit


75 Slides2.59 MB
Overview Biostatistics Applications of Statistics in Research Bandit Thinkhamrop, Ph.D.(Statistics) Department of Biostatistics and Demography Faculty of Public Health Khon Kaen University
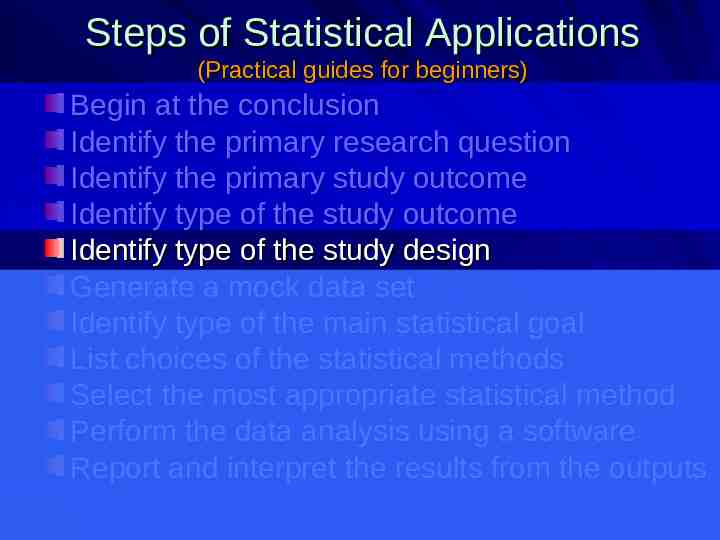
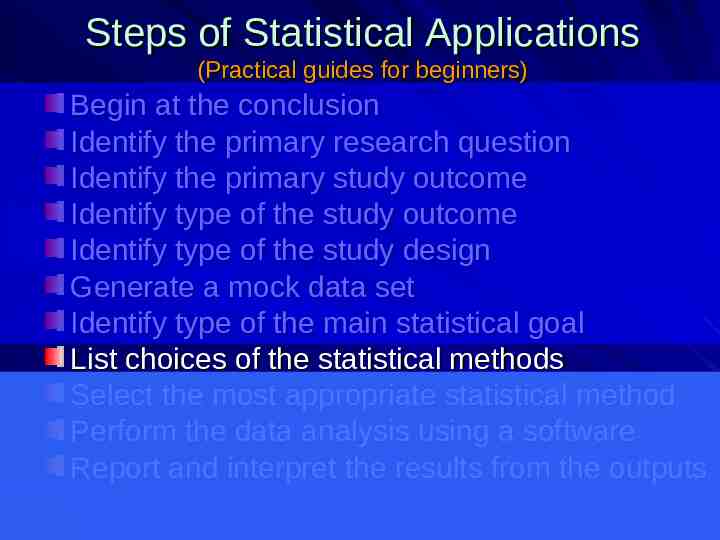
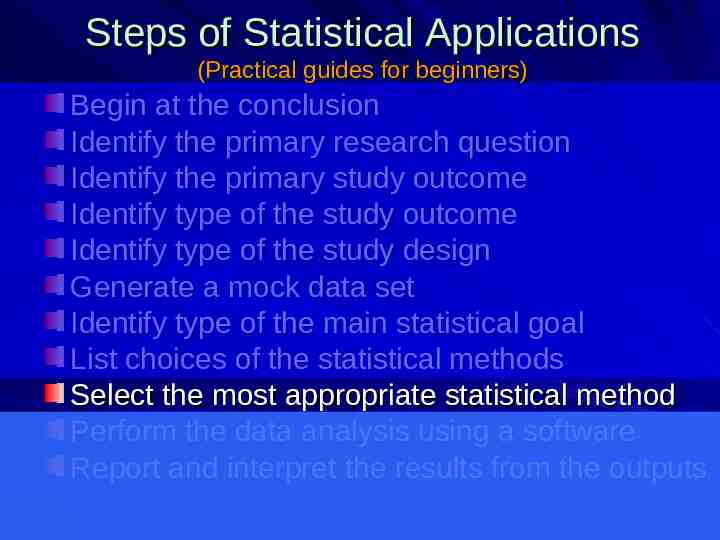
Steps of Statistical Applications (Practical guides for beginners) Begin at the conclusion Identify the primary research question Identify the primary study outcome Identify type of the study outcome Identify type of the study design Identify type of the main statistical goal List choices of the statistical methods Select the most appropriate statistical method Perform the data analysis using a software Report and interpret the results from the outputs
Steps of Statistical Applications (Practical guides for beginners) Begin at the conclusion Identify the primary research question Identify the primary study outcome Identify type of the study outcome Identify type of the study design Identify type of the main statistical goal List choices of the statistical methods Select the most appropriate statistical method Perform the data analysis using a software Report and interpret the results from the outputs
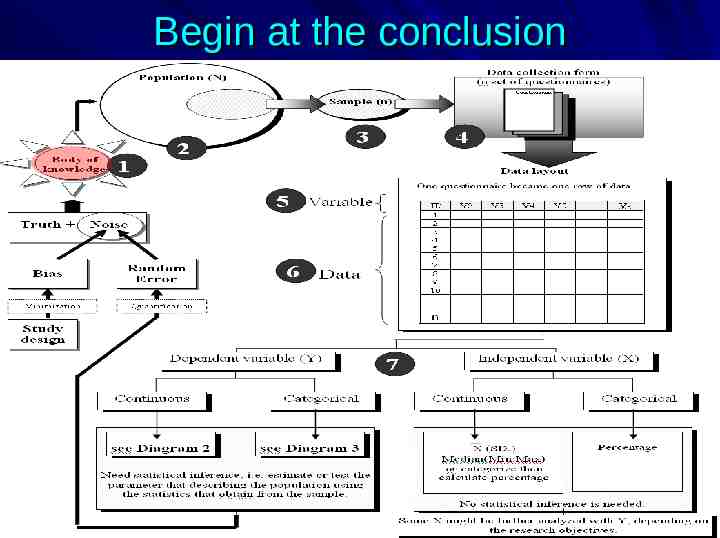
Begin at the conclusion
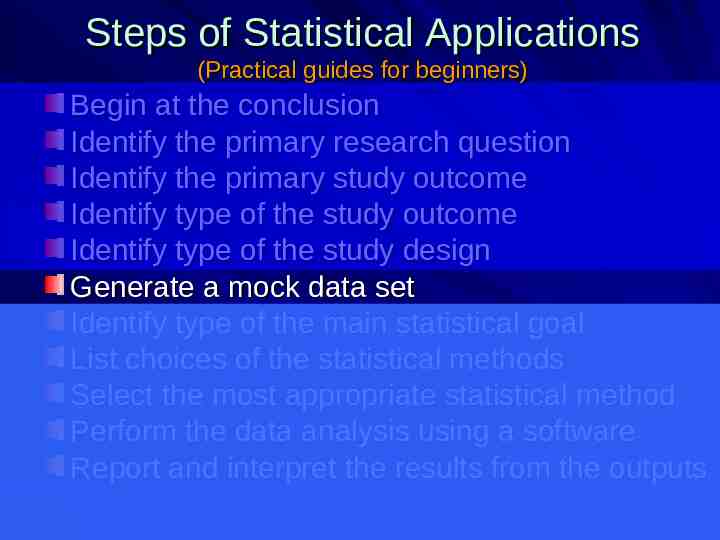
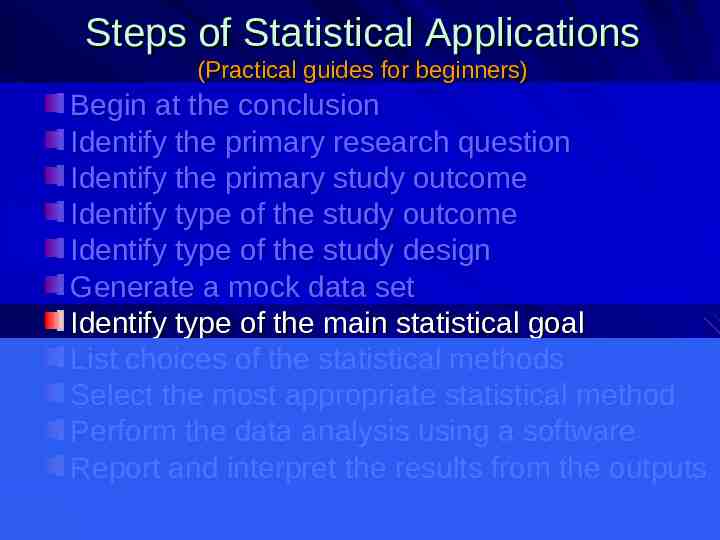
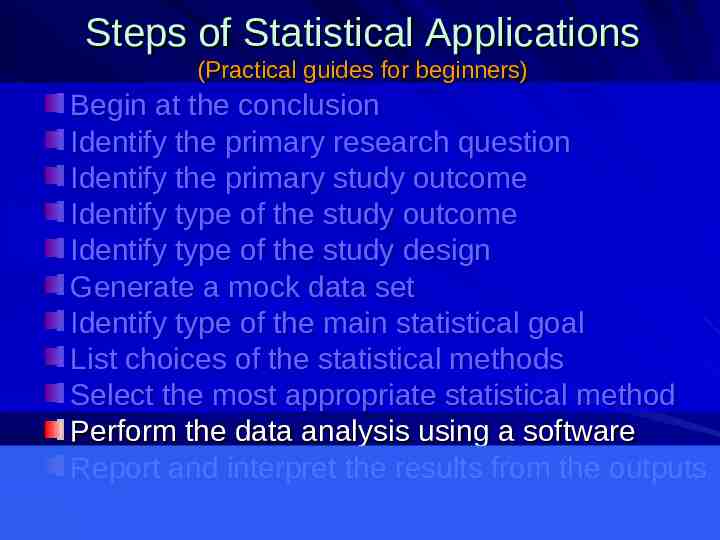
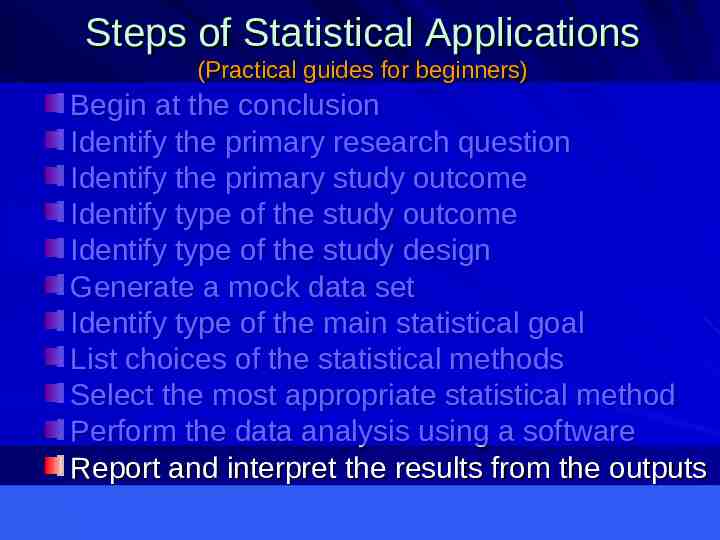
Steps of Statistical Applications (Practical guides for beginners) Begin at the conclusion Identify the primary research question Identify the primary study outcome Identify type of the study outcome Identify type of the study design Generate a mock data set Identify type of the main statistical goal List choices of the statistical methods Select the most appropriate statistical method Perform the data analysis using a software Report and interpret the results from the outputs
Identify the primary research question Where to find the research question? – Title of the study – The objective(s) – The conclusion(s) If more than one, find the primary aim. Try to make the question “quantifiable”
Steps of Statistical Applications (Practical guides for beginners) Begin at the conclusion Identify the primary research question Identify the primary study outcome Identify type of the study outcome Identify type of the study design Generate a mock data set Identify type of the main statistical goal List choices of the statistical methods Select the most appropriate statistical method Perform the data analysis using a software Report and interpret the results from the outputs
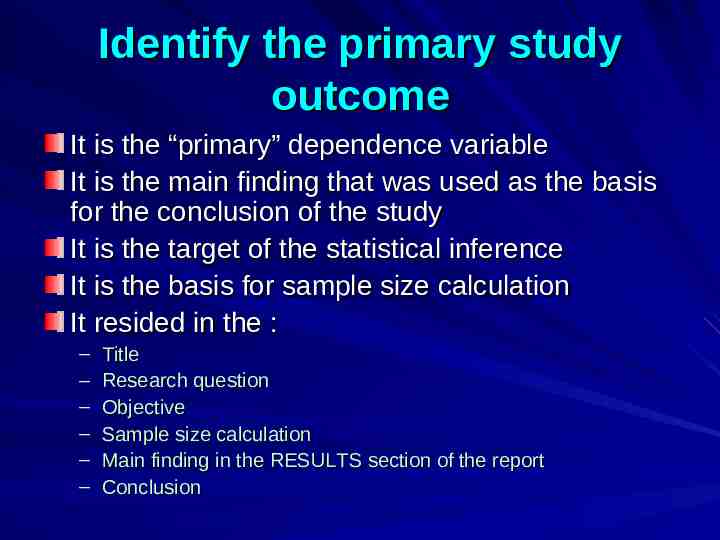
Identify the primary study outcome It is the “primary” dependence variable It is the main finding that was used as the basis for the conclusion of the study It is the target of the statistical inference It is the basis for sample size calculation It resided in the : – – – – – – Title Research question Objective Sample size calculation Main finding in the RESULTS section of the report Conclusion
Steps of Statistical Applications (Practical guides for beginners) Begin at the conclusion Identify the primary research question Identify the primary study outcome Identify type of the study outcome Identify type of the study design Generate a mock data set Identify type of the main statistical goal List choices of the statistical methods Select the most appropriate statistical method Perform the data analysis using a software Report and interpret the results from the outputs
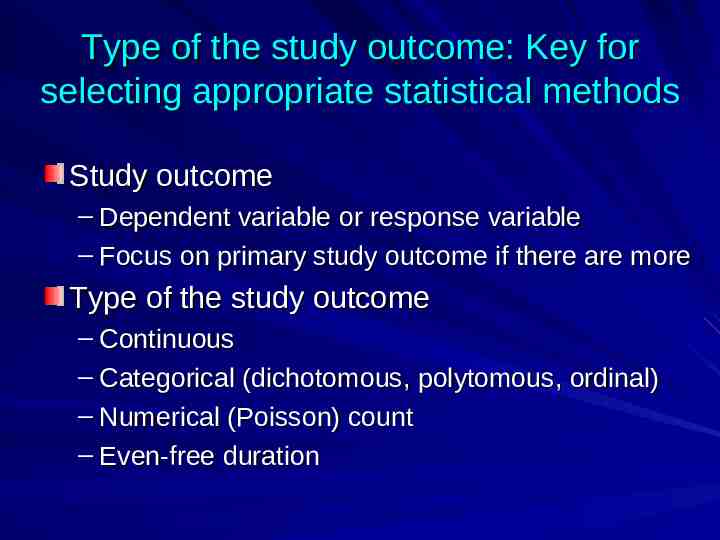
Type of the study outcome: Key for selecting appropriate statistical methods Study outcome – Dependent variable or response variable – Focus on primary study outcome if there are more Type of the study outcome – Continuous – Categorical (dichotomous, polytomous, ordinal) – Numerical (Poisson) count – Even-free duration
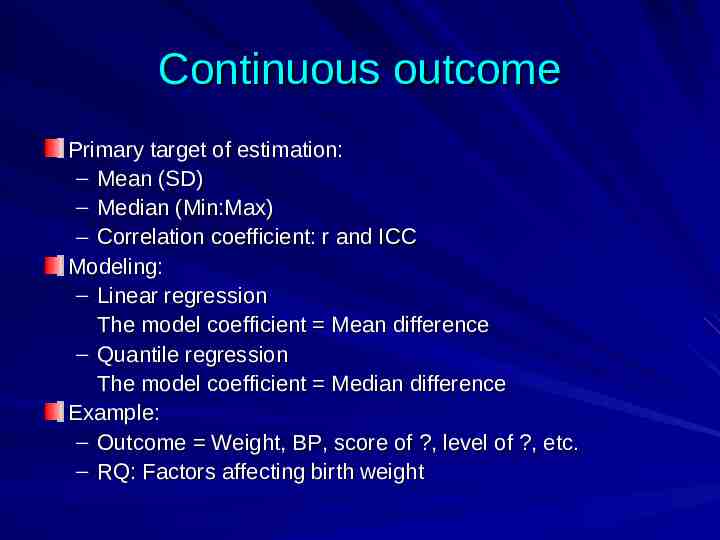
Continuous outcome Primary target of estimation: – Mean (SD) – Median (Min:Max) – Correlation coefficient: r and ICC Modeling: – Linear regression The model coefficient Mean difference – Quantile regression The model coefficient Median difference Example: – Outcome Weight, BP, score of ?, level of ?, etc. – RQ: Factors affecting birth weight
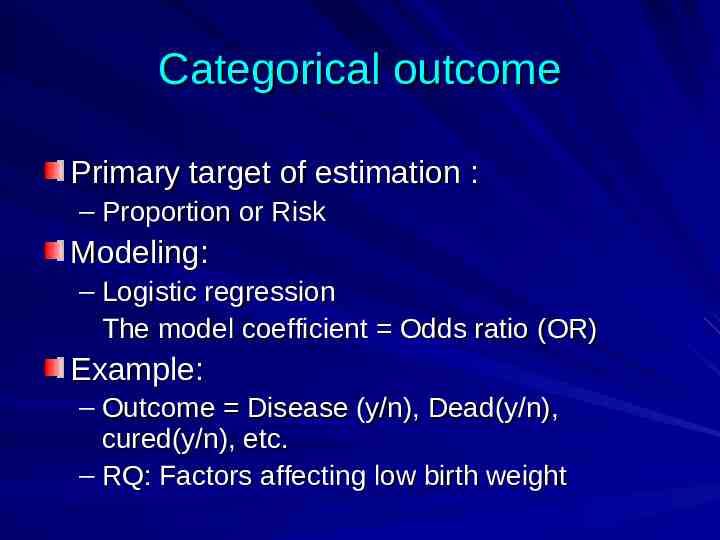
Categorical outcome Primary target of estimation : – Proportion or Risk Modeling: – Logistic regression The model coefficient Odds ratio (OR) Example: – Outcome Disease (y/n), Dead(y/n), cured(y/n), etc. – RQ: Factors affecting low birth weight
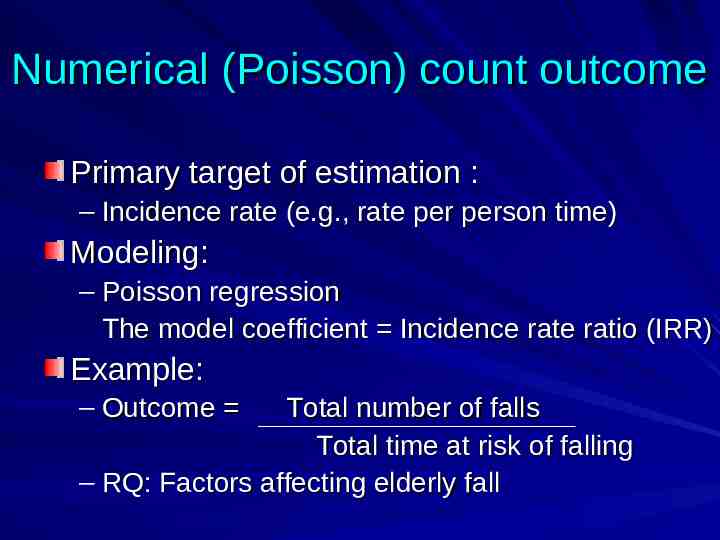
Numerical (Poisson) count outcome Primary target of estimation : – Incidence rate (e.g., rate per person time) Modeling: – Poisson regression The model coefficient Incidence rate ratio (IRR) Example: – Outcome Total number of falls Total time at risk of falling – RQ: Factors affecting elderly fall
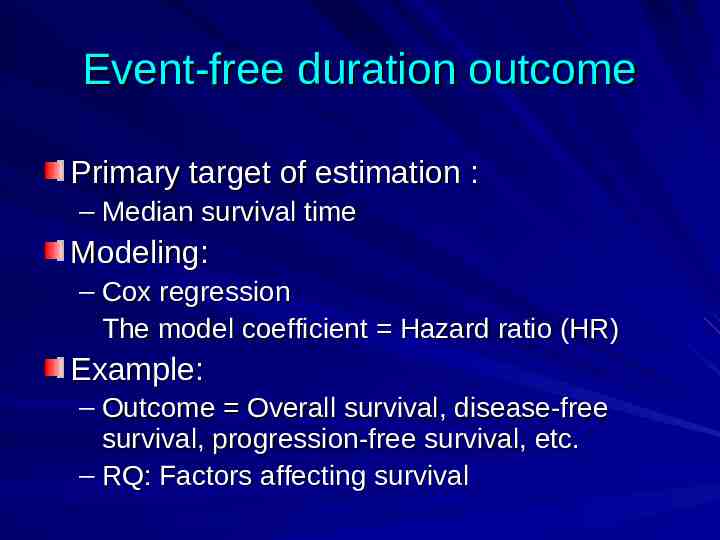
Event-free duration outcome Primary target of estimation : – Median survival time Modeling: – Cox regression The model coefficient Hazard ratio (HR) Example: – Outcome Overall survival, disease-free survival, progression-free survival, etc. – RQ: Factors affecting survival
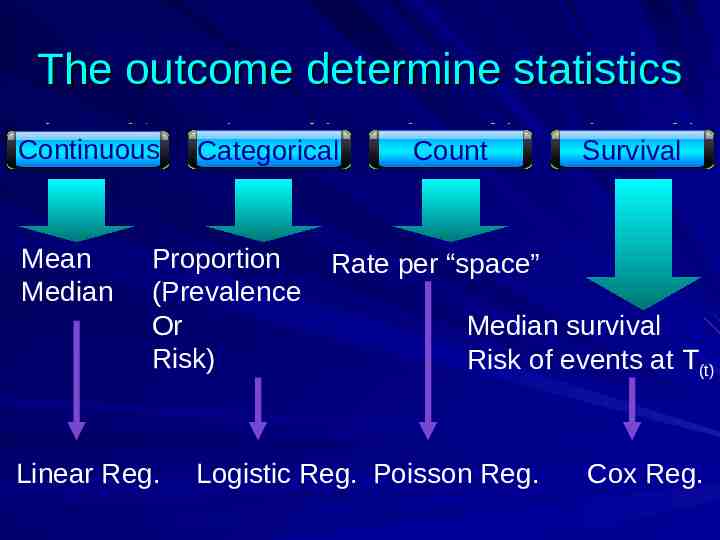
The outcome determine statistics Continuous Mean Median Categorical Proportion (Prevalence Or Risk) Linear Reg. Count Survival Rate per “space” Median survival Risk of events at T(t) Logistic Reg. Poisson Reg. Cox Reg.
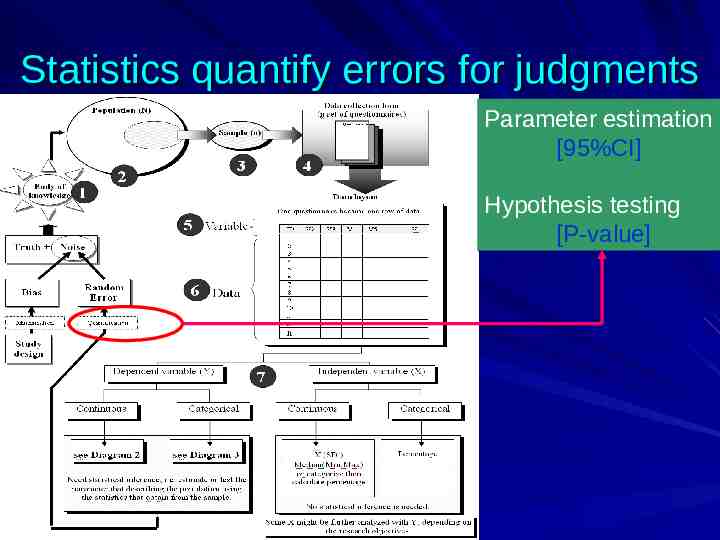
Statistics quantify errors for judgments Parameter estimation [95%CI] Hypothesis testing [P-value]
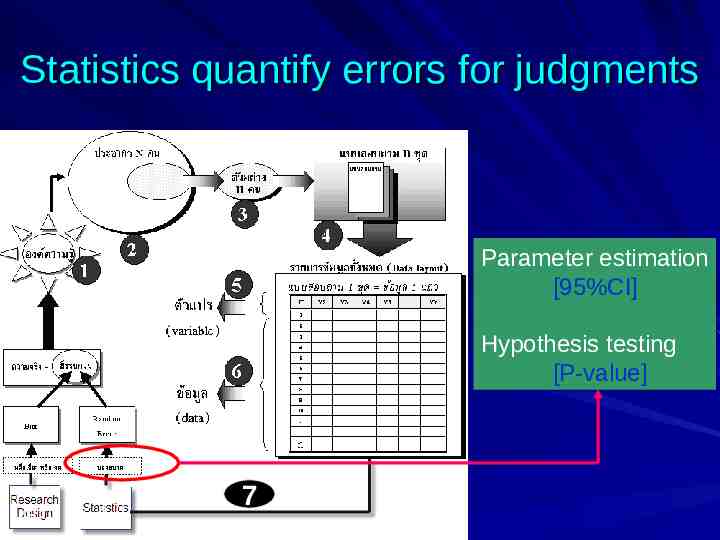
Statistics quantify errors for judgments Parameter estimation [95%CI] Hypothesis testing [P-value] 7
Steps of Statistical Applications (Practical guides for beginners) Begin at the conclusion Identify the primary research question Identify the primary study outcome Identify type of the study outcome Identify type of the study design Generate a mock data set Identify type of the main statistical goal List choices of the statistical methods Select the most appropriate statistical method Perform the data analysis using a software Report and interpret the results from the outputs
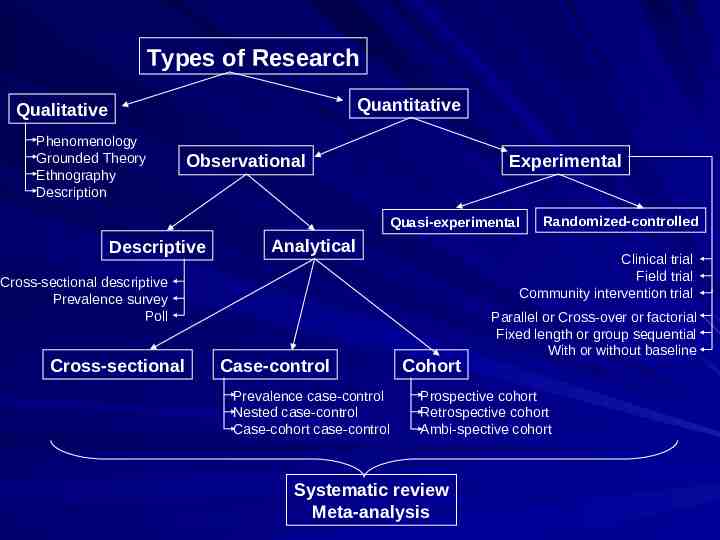
Types of Research Quantitative Qualitative Phenomenology Grounded Theory Ethnography Description Observational Experimental Quasi-experimental Descriptive Analytical Clinical trial Field trial Community intervention trial Cross-sectional descriptive Prevalence survey Poll Cross-sectional Case-control Prevalence case-control Nested case-control Case-cohort case-control Randomized-controlled Cohort Parallel or Cross-over or factorial Fixed length or group sequential With or without baseline Prospective cohort Retrospective cohort Ambi-spective cohort Systematic review Meta-analysis
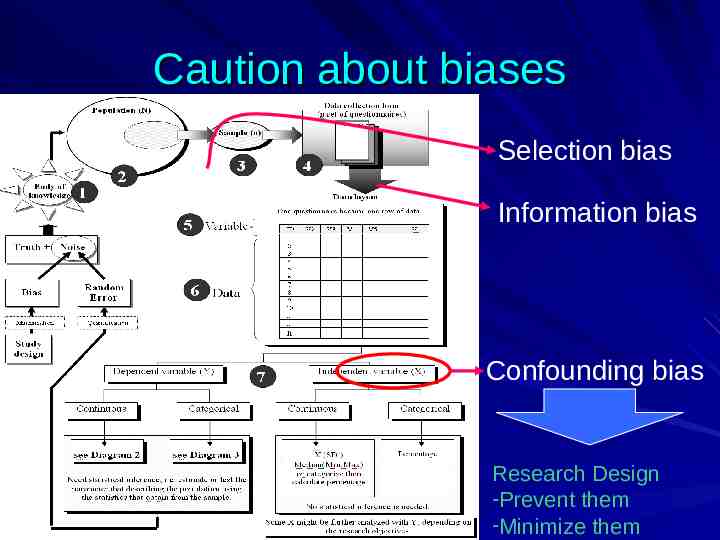
Caution about biases Selection bias Information bias Confounding bias Research Design -Prevent them -Minimize them
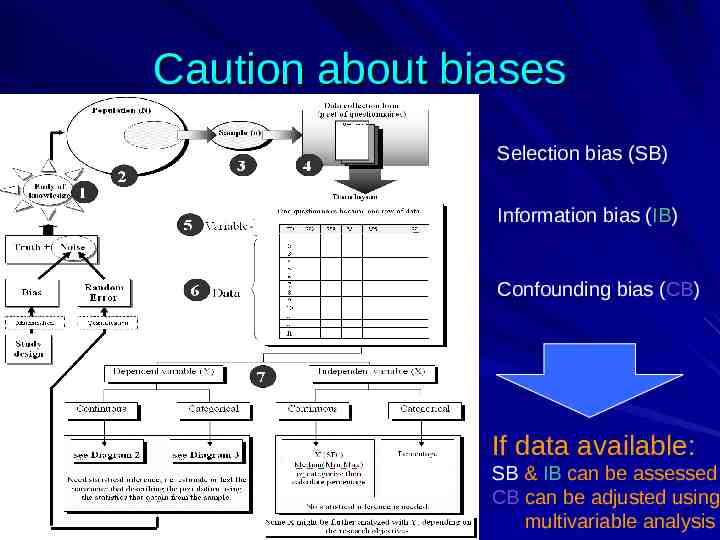
Caution about biases Selection bias (SB) Information bias (IB) Confounding bias (CB) If data available: SB & IB can be assessed CB can be adjusted using multivariable analysis
Steps of Statistical Applications (Practical guides for beginners) Begin at the conclusion Identify the primary research question Identify the primary study outcome Identify type of the study outcome Identify type of the study design Generate a mock data set Identify type of the main statistical goal List choices of the statistical methods Select the most appropriate statistical method Perform the data analysis using a software Report and interpret the results from the outputs
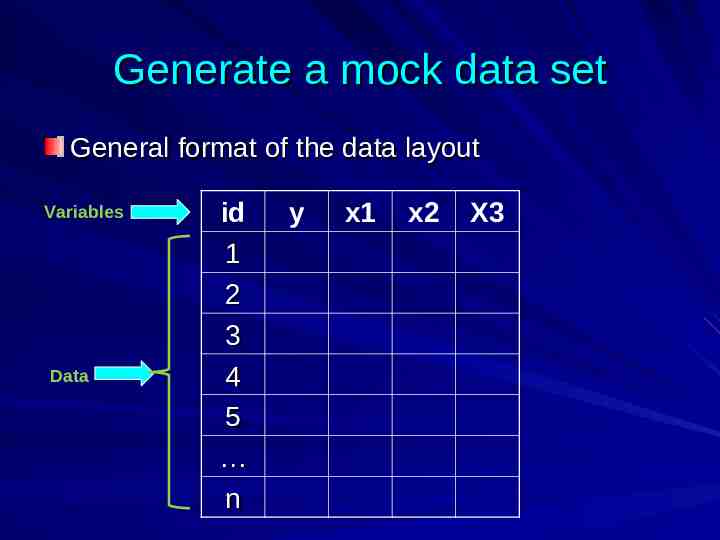
Generate a mock data set General format of the data layout Variables Data id 1 2 3 4 5 n y x1 x2 X3
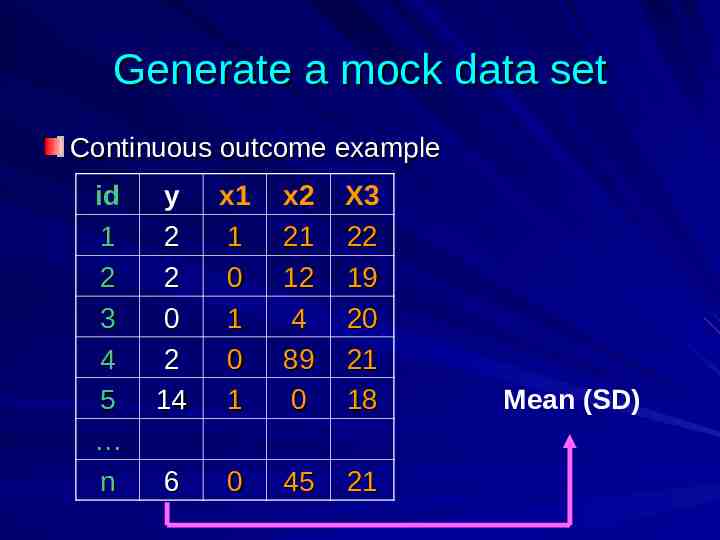
Generate a mock data set Continuous outcome example id 1 2 3 4 5 n y 2 2 0 2 14 x1 1 0 1 0 1 x2 21 12 4 89 0 X3 22 19 20 21 18 6 0 45 21 Mean (SD)
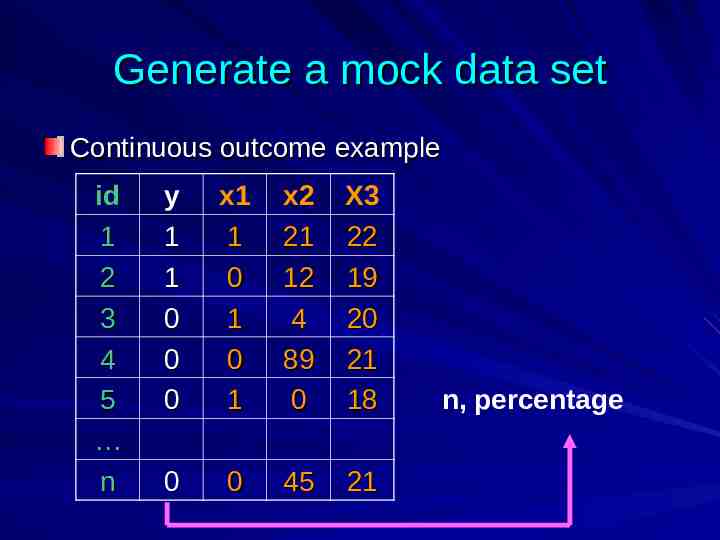
Generate a mock data set Continuous outcome example id 1 2 3 4 5 n y 1 1 0 0 0 x1 1 0 1 0 1 x2 21 12 4 89 0 X3 22 19 20 21 18 0 0 45 21 n, percentage
Steps of Statistical Applications (Practical guides for beginners) Begin at the conclusion Identify the primary research question Identify the primary study outcome Identify type of the study outcome Identify type of the study design Generate a mock data set Identify type of the main statistical goal List choices of the statistical methods Select the most appropriate statistical method Perform the data analysis using a software Report and interpret the results from the outputs
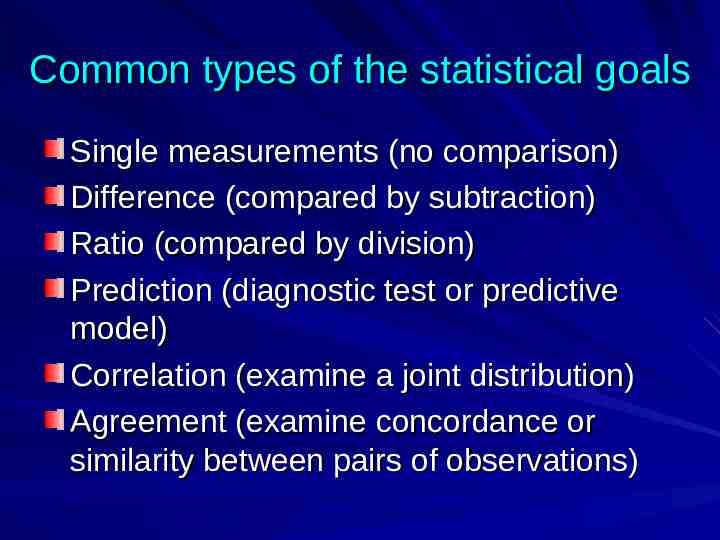
Common types of the statistical goals Single measurements (no comparison) Difference (compared by subtraction) Ratio (compared by division) Prediction (diagnostic test or predictive model) Correlation (examine a joint distribution) Agreement (examine concordance or similarity between pairs of observations)
Steps of Statistical Applications (Practical guides for beginners) Begin at the conclusion Identify the primary research question Identify the primary study outcome Identify type of the study outcome Identify type of the study design Generate a mock data set Identify type of the main statistical goal List choices of the statistical methods Select the most appropriate statistical method Perform the data analysis using a software Report and interpret the results from the outputs
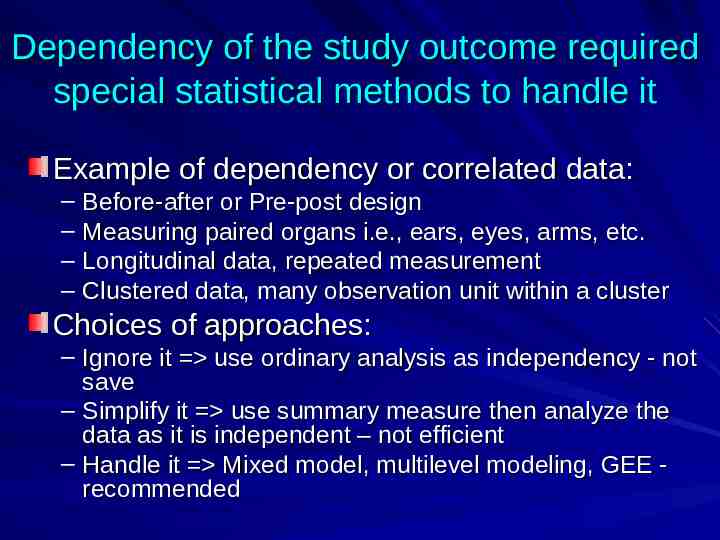
Dependency of the study outcome required special statistical methods to handle it Example of dependency or correlated data: – – – – Before-after or Pre-post design Measuring paired organs i.e., ears, eyes, arms, etc. Longitudinal data, repeated measurement Clustered data, many observation unit within a cluster Choices of approaches: – Ignore it use ordinary analysis as independency - not save – Simplify it use summary measure then analyze the data as it is independent – not efficient – Handle it Mixed model, multilevel modeling, GEE recommended
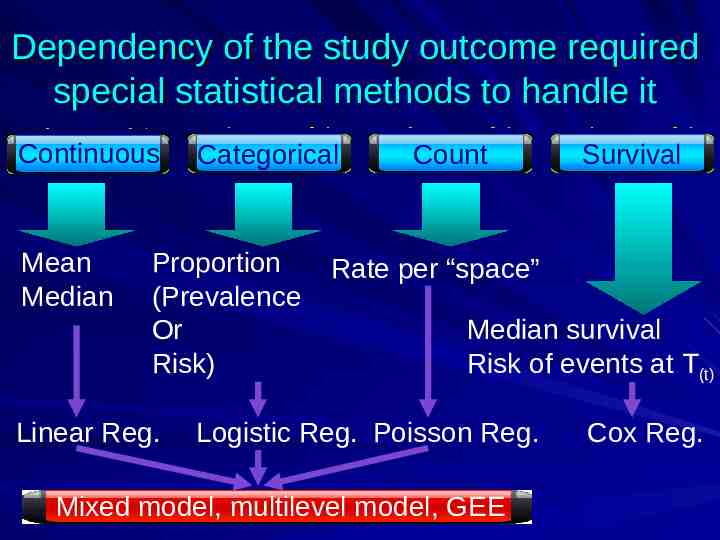
Dependency of the study outcome required special statistical methods to handle it Continuous Mean Median Categorical Proportion (Prevalence Or Risk) Linear Reg. Count Survival Rate per “space” Median survival Risk of events at T(t) Logistic Reg. Poisson Reg. Mixed model, multilevel model, GEE Cox Reg.
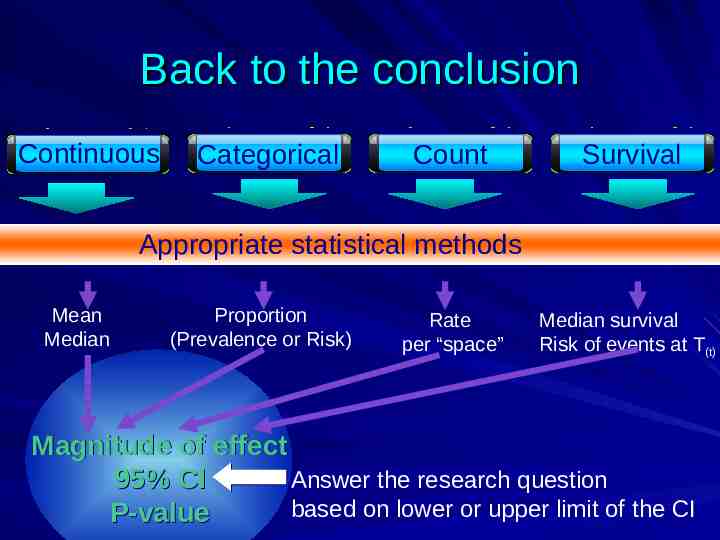
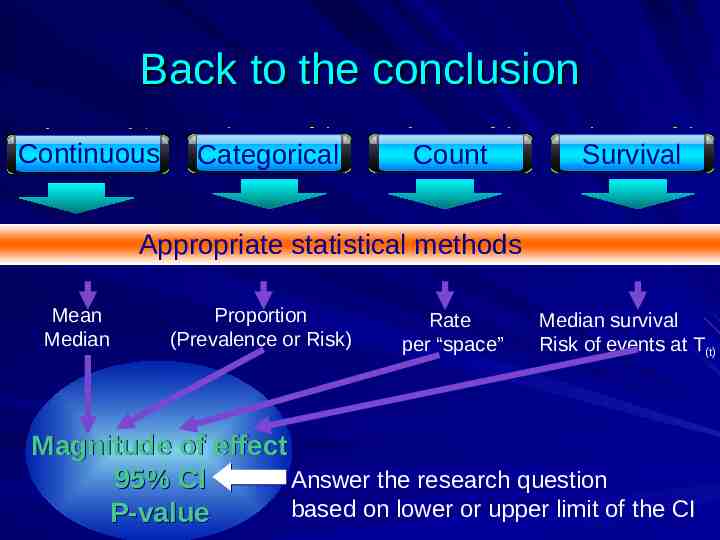
Back to the conclusion Continuous Categorical Count Survival Appropriate statistical methods Mean Median Proportion (Prevalence or Risk) Rate per “space” Median survival Risk of events at T(t) Magnitude of effect 95% CI Answer the research question based on lower or upper limit of the CI P-value
Always report the magnitude of effect and its confidence interval Absolute effects: – Mean, Mean difference – Proportion or prevalence, Rate or risk, Rate or Risk difference – Median survival time Relative effects: – Relative risk, Rate ratio, Hazard ratio – Odds ratio Other magnitude of effects: – – – – Correlation coefficient (r), Intra-class correlation (ICC) Kappa Diagnostic performance Etc.
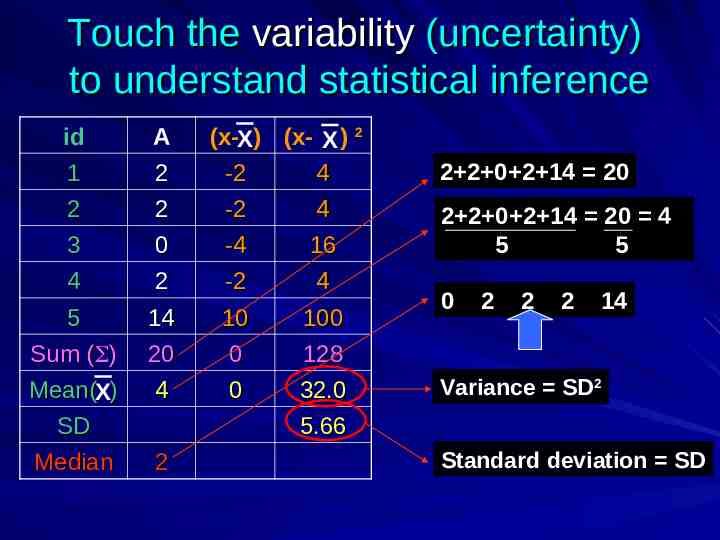
Touch the variability (uncertainty) to understand statistical inference id A 1 2 2 2 3 4 0 2 5 Sum ( ) 14 20 Mean(X) SD Median 4 (x-X) (x- X ) 2 -2 4 -2 4 -4 16 -2 10 4 100 0 0 128 32.0 2 2 0 2 14 20 2 2 0 2 14 20 4 5 5 0 2 2 2 14 Variance SD2 5.66 2 Standard deviation SD
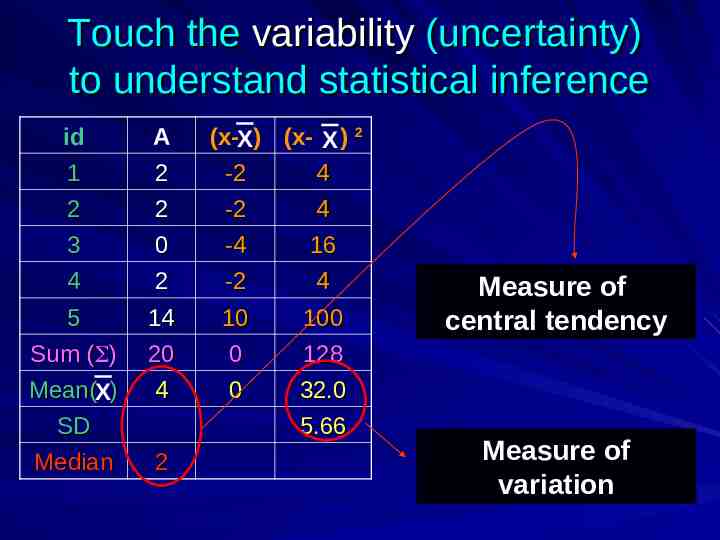
Touch the variability (uncertainty) to understand statistical inference id A 1 2 2 2 3 4 0 2 5 Sum ( ) 14 20 Mean(X) SD Median 4 (x-X) (x- X ) 2 -2 4 -2 4 -4 16 -2 10 4 100 0 0 128 32.0 5.66 2 Measure of central tendency Measure of variation
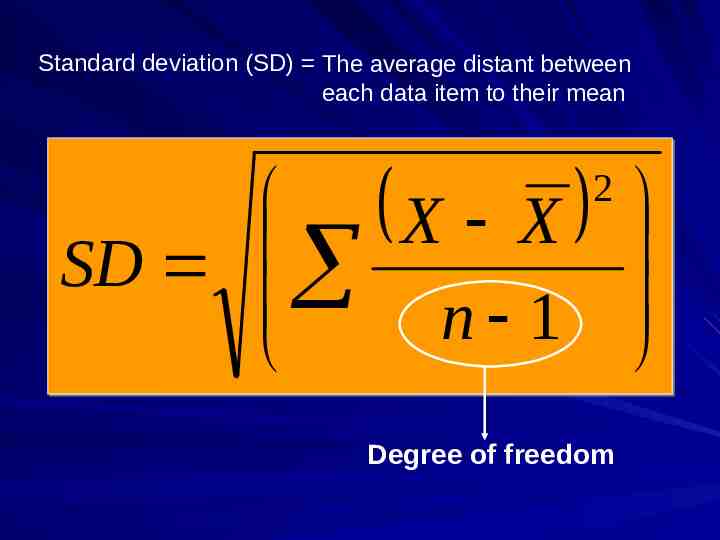
Standard deviation (SD) The average distant between each data item to their mean X X SD n 1 2 Degree of freedom
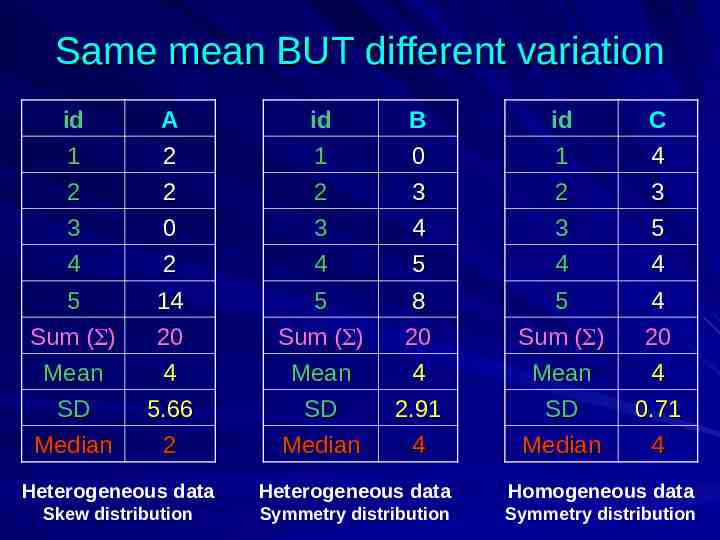
Same mean BUT different variation id A id B id C 1 2 2 2 1 2 0 3 1 2 4 3 3 4 0 2 3 4 4 5 3 4 5 4 5 Sum ( ) 14 20 5 Sum ( ) 8 20 5 Sum ( ) 4 20 Mean SD 4 5.66 Mean SD 4 2.91 Mean SD 4 0.71 Median 2 Median 4 Median 4 Heterogeneous data Heterogeneous data Homogeneous data Skew distribution Symmetry distribution Symmetry distribution
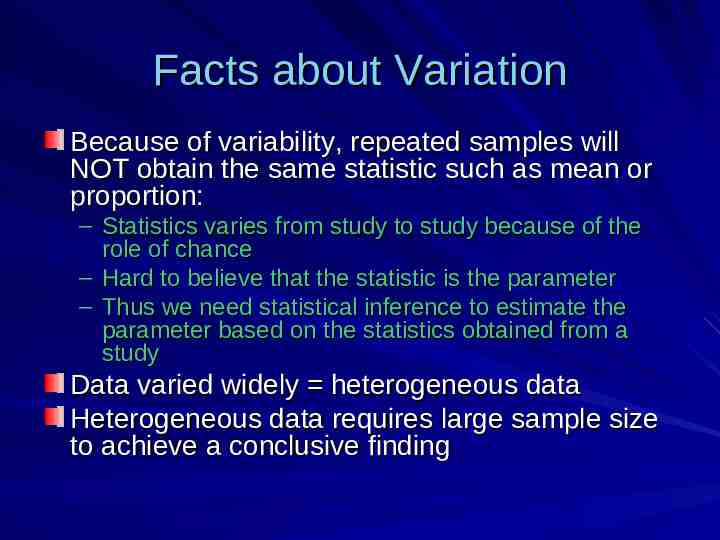
Facts about Variation Because of variability, repeated samples will NOT obtain the same statistic such as mean or proportion: – Statistics varies from study to study because of the role of chance – Hard to believe that the statistic is the parameter – Thus we need statistical inference to estimate the parameter based on the statistics obtained from a study Data varied widely heterogeneous data Heterogeneous data requires large sample size to achieve a conclusive finding
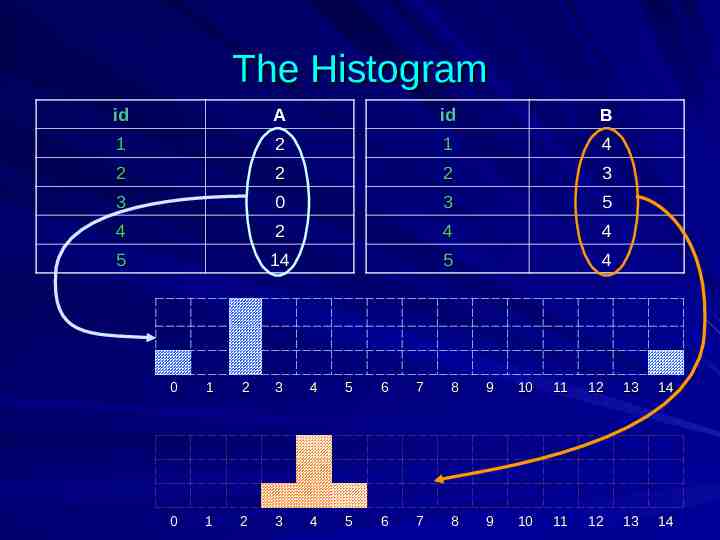
The Histogram id A id B 1 2 1 4 2 2 2 3 3 0 3 5 4 2 4 4 5 14 5 4 0 1 2 3 4 5 6 7 8 9 10 11 12 13 14 0 1 2 3 4 5 6 7 8 9 10 11 12 13 14
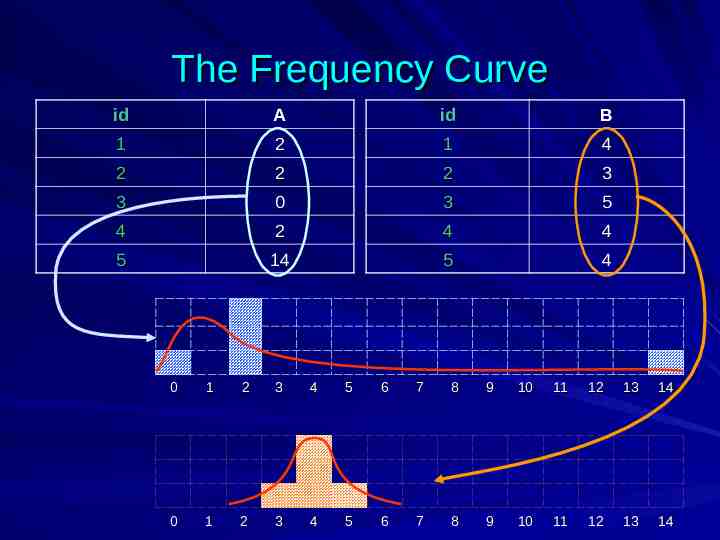
The Frequency Curve id A id B 1 2 1 4 2 2 2 3 3 0 3 5 4 2 4 4 5 14 5 4 0 1 2 3 4 5 6 7 8 9 10 11 12 13 14 0 1 2 3 4 5 6 7 8 9 10 11 12 13 14
Area Under The Frequency Curve id A id B 1 2 1 4 2 2 2 3 3 0 3 5 4 2 4 4 5 14 5 4 0 1 2 3 4 5 6 7 8 9 10 11 12 13 14 0 1 2 3 4 5 6 7 8 9 10 11 12 13 14
Central Limit Theorem Right Skew X1 Symmetry X2 Left Skew X3 X1 XX Xn Normally distributed
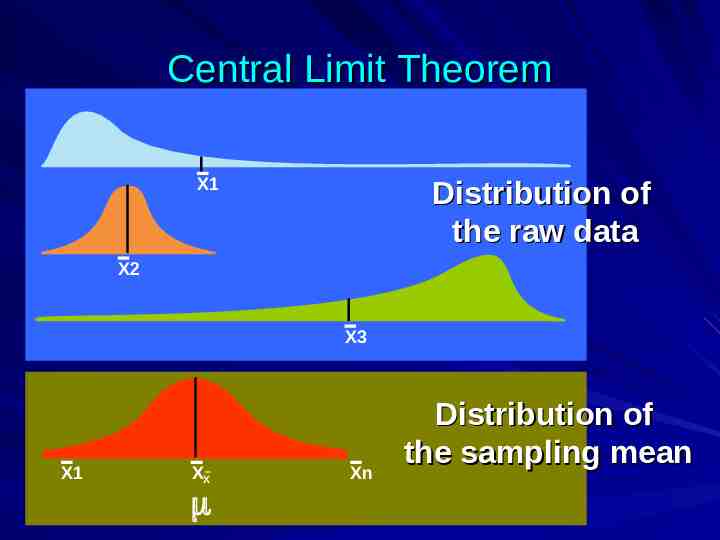
Central Limit Theorem X1 Distribution of the raw data X2 X3 X1 XX Xn Distribution of the sampling mean
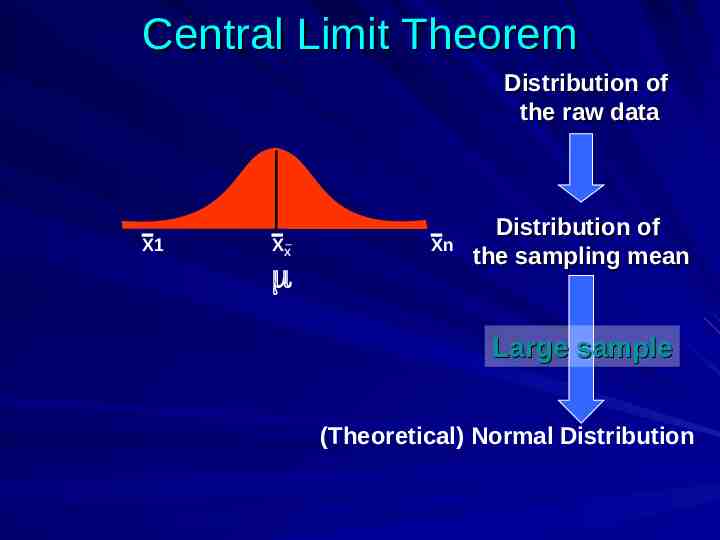
Central Limit Theorem Distribution of the raw data X1 XX Xn Distribution of the sampling mean Large sample (Theoretical) Normal Distribution
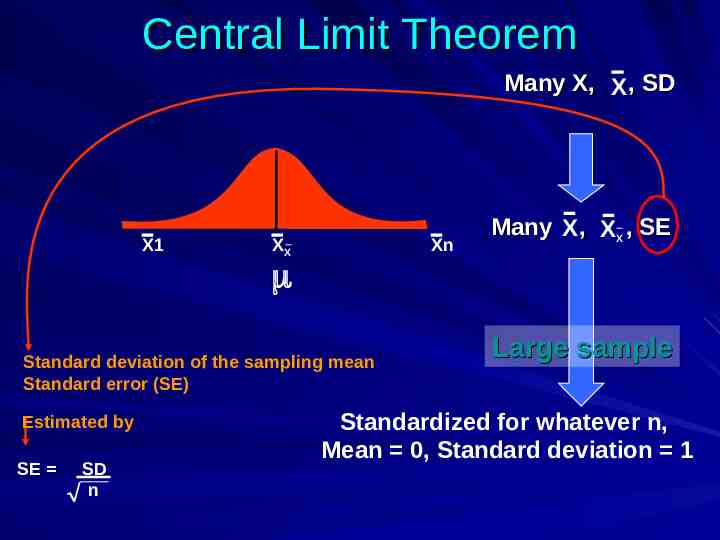
Central Limit Theorem Many X, X , SD X1 XX Xn Many X , XX , SE Standard deviation of the sampling mean Standard error (SE) Estimated by SE SD n Large sample Standardized for whatever n, Mean 0, Standard deviation 1
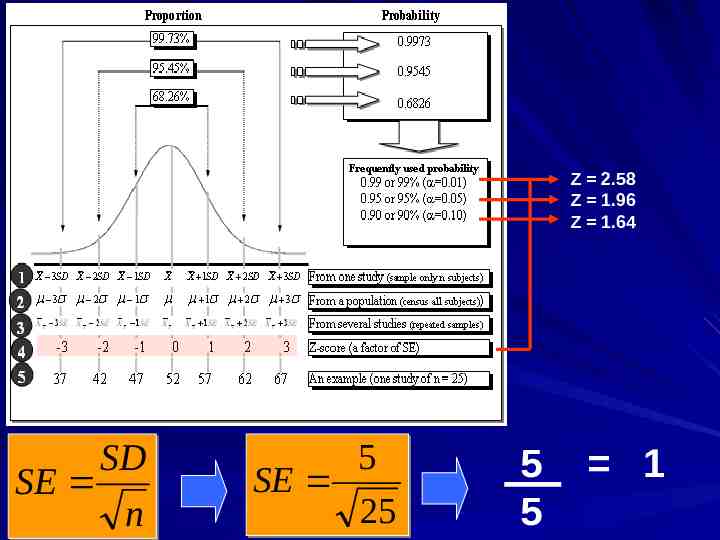
(Theoretical) Normal Distribution
99.73% of AUC Mean 3SD
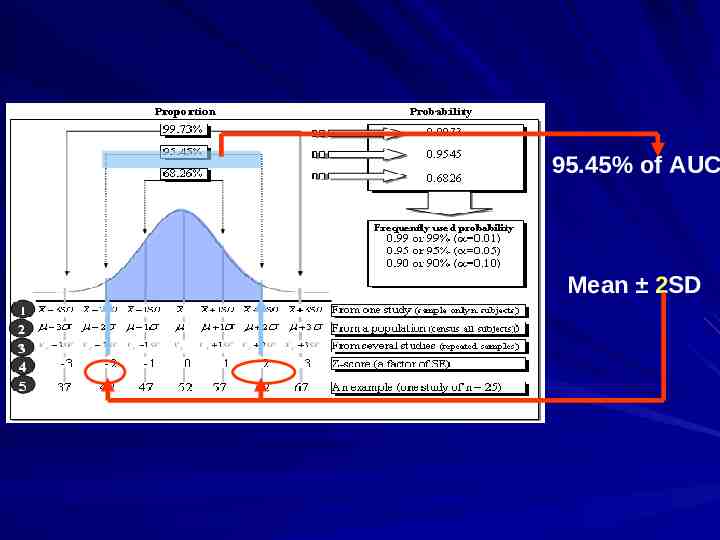
95.45% of AUC Mean 2SD
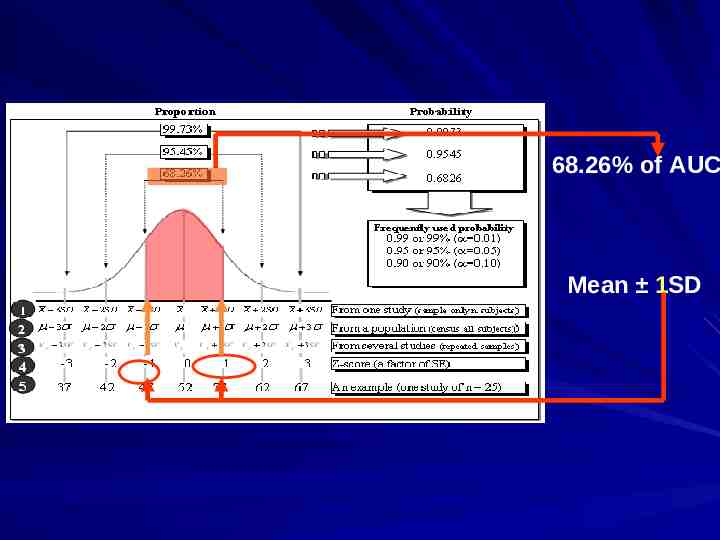
68.26% of AUC Mean 1SD
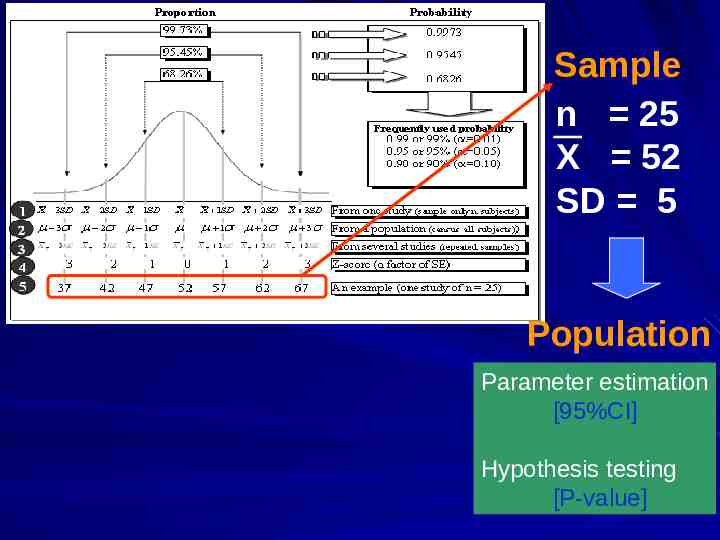
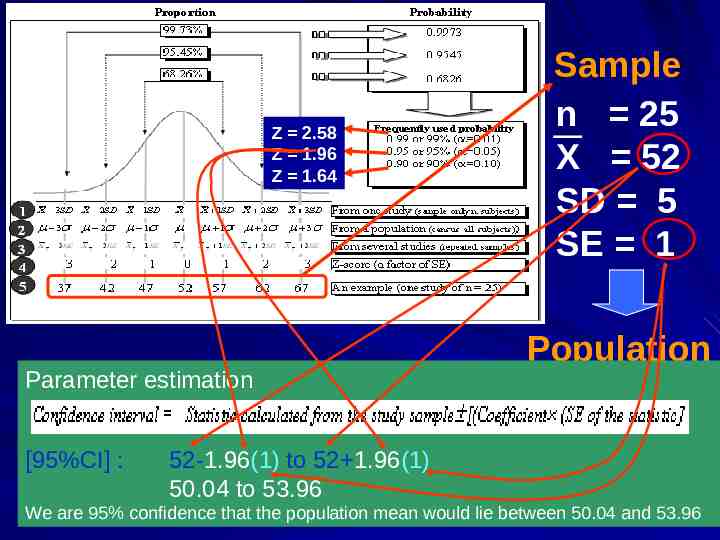
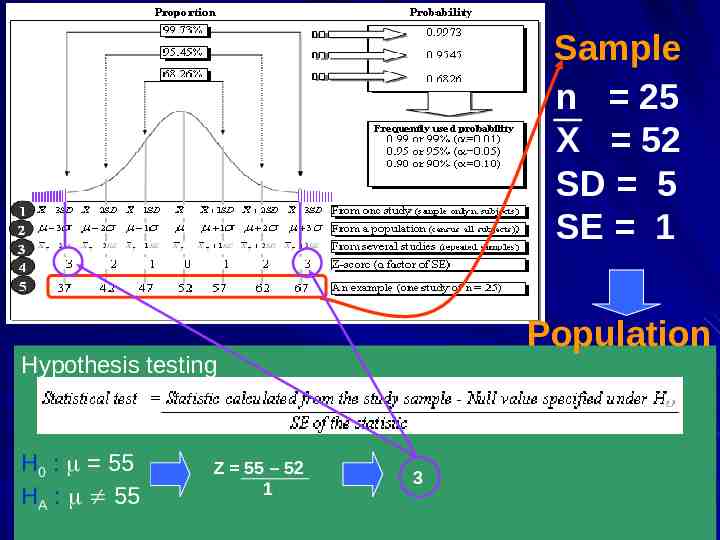
Sample n 25 X 52 SD 5 Population Parameter estimation [95%CI] Hypothesis testing [P-value]
Z 2.58 Z 1.96 Z 1.64 SD SE n 5 SE 25 5 5 1
Z 2.58 Z 1.96 Z 1.64 Parameter estimation [95%CI] : Sample n 25 X 52 SD 5 SE 1 Population 52-1.96(1) to 52 1.96(1) 50.04 to 53.96 We are 95% confidence that the population mean would lie between 50.04 and 53.96
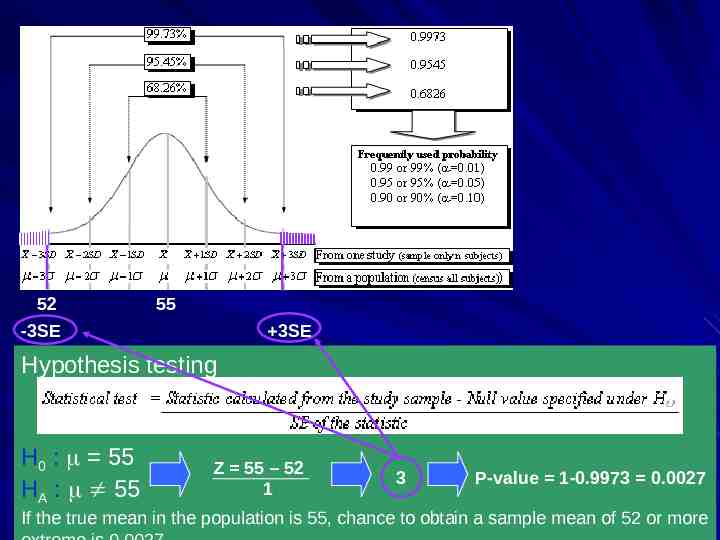
Sample n 25 X 52 SD 5 SE 1 Population Hypothesis testing H0 : 55 HA : 55 Z 55 – 52 1 3
52 -3SE 55 3SE Hypothesis testing H0 : 55 HA : 55 Z 55 – 52 1 3 P-value 1-0.9973 0.0027 If the true mean in the population is 55, chance to obtain a sample mean of 52 or more
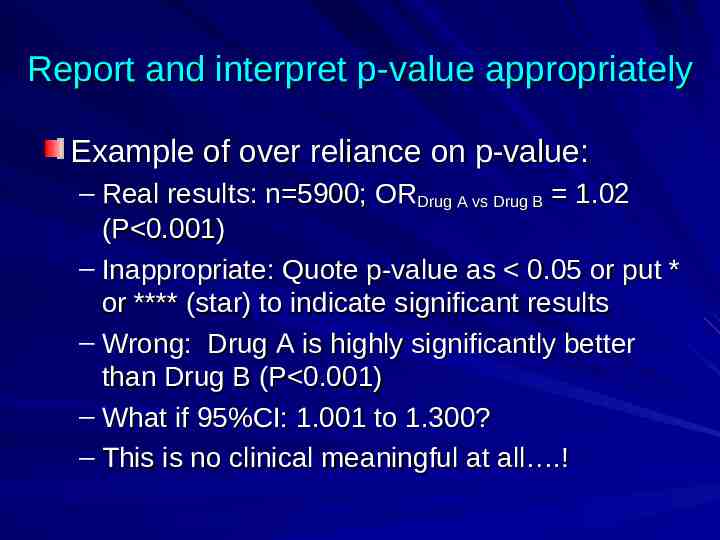
Report and interpret p-value appropriately Example of over reliance on p-value: – Real results: n 5900; ORDrug A vs Drug B 1.02 (P 0.001) – Inappropriate: Quote p-value as 0.05 or put * or **** (star) to indicate significant results – Wrong: Drug A is highly significantly better than Drug B (P 0.001) – What if 95%CI: 1.001 to 1.300? – This is no clinical meaningful at all .!
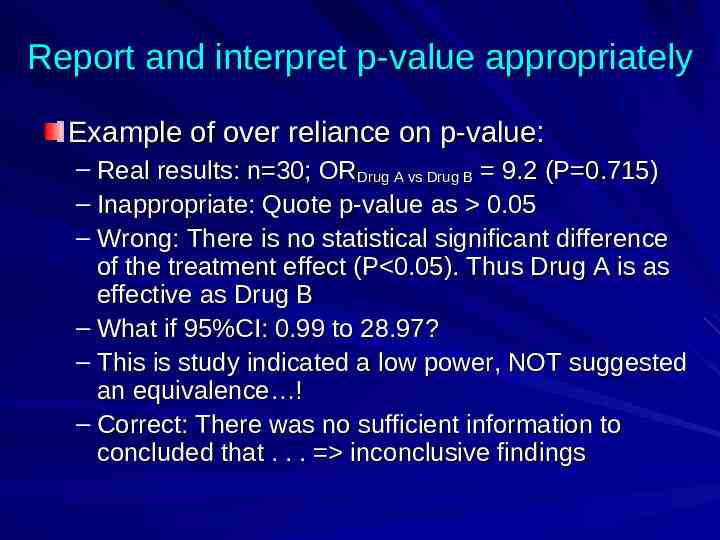
Report and interpret p-value appropriately Example of over reliance on p-value: – Real results: n 30; ORDrug A vs Drug B 9.2 (P 0.715) – Inappropriate: Quote p-value as 0.05 – Wrong: There is no statistical significant difference of the treatment effect (P 0.05). Thus Drug A is as effective as Drug B – What if 95%CI: 0.99 to 28.97? – This is study indicated a low power, NOT suggested an equivalence ! – Correct: There was no sufficient information to concluded that . . . inconclusive findings
P-value is the magnitude of chance NOT magnitude of effect P-value 0.05 Significant findings Small chance of being wrong in rejecting the null hypothesis If in fact there is no [effect], it is unlikely to get the [effect] [magnitude of effect] or more extreme Significance DOES NOT MEAN importance Any extra-large studies can give a very small Pvalue even if the [magnitude of effect] is very small
P-value is the magnitude of chance NOT magnitude of effect P-value 0.05 Non-significant findings High chance of being wrong in rejecting the null hypothesis If in fact there is no [effect], the [effect] [magnitude of effect] or more extreme can be occurred chance. Non-significance DOES NOT MEAN no difference, equal, or no association Any small studies can give a very large P-value even if the [magnitude of effect] is very large
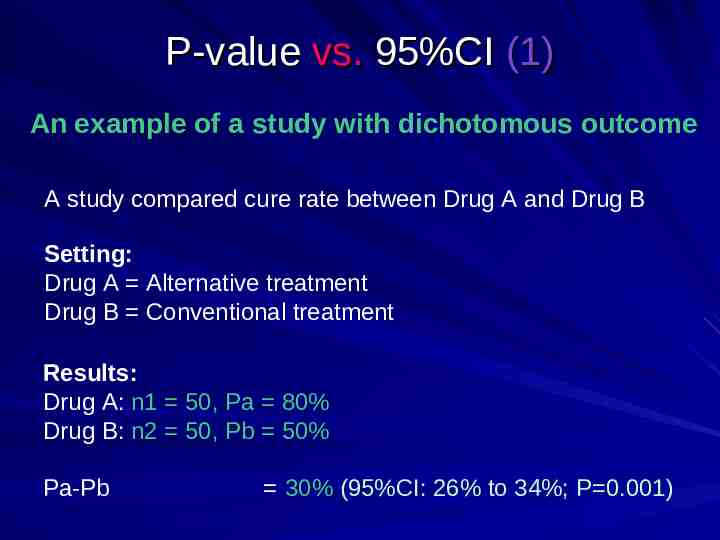
P-value vs. 95%CI (1) An example of a study with dichotomous outcome A study compared cure rate between Drug A and Drug B Setting: Drug A Alternative treatment Drug B Conventional treatment Results: Drug A: n1 50, Pa 80% Drug B: n2 50, Pb 50% Pa-Pb 30% (95%CI: 26% to 34%; P 0.001)
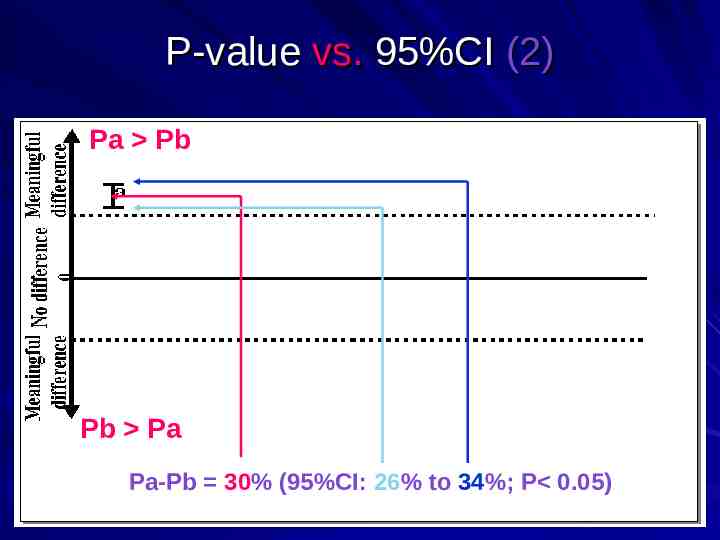
P-value vs. 95%CI (2) Pa Pb Pb Pa Pa-Pb 30% (95%CI: 26% to 34%; P 0.05)
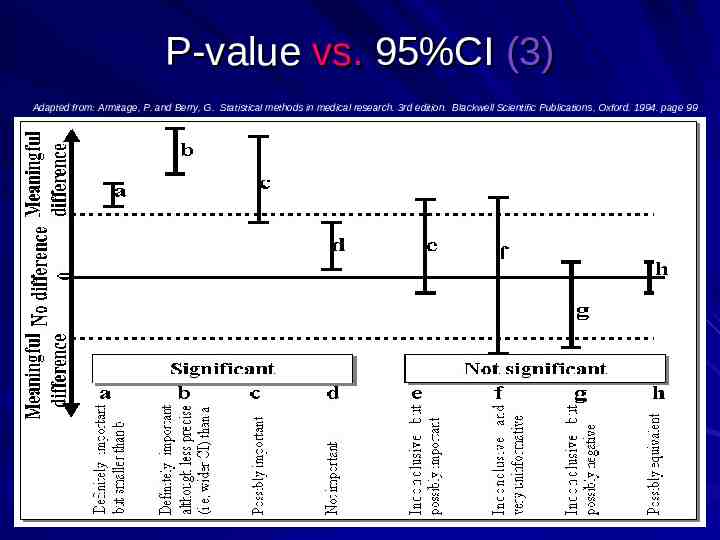
P-value vs. 95%CI (3) Adapted from: Armitage, P. and Berry, G. Statistical methods in medical research. 3rd edition. Blackwell Scientific Publications, Oxford. 1994. page 99
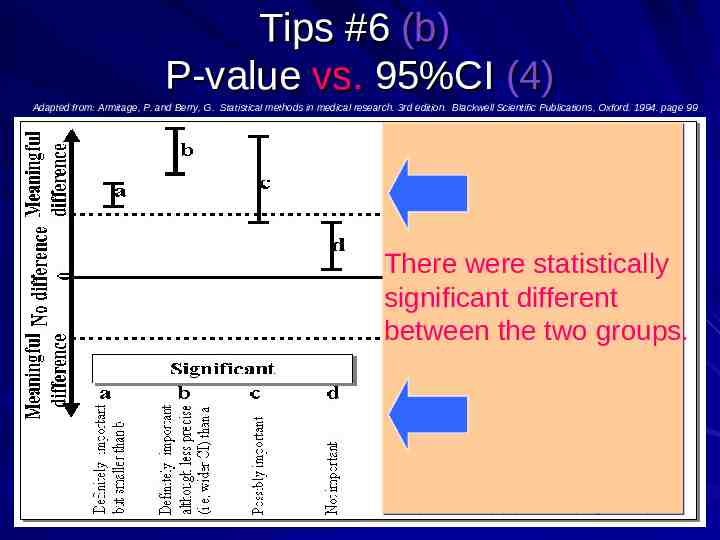
Tips #6 (b) P-value vs. 95%CI (4) Adapted from: Armitage, P. and Berry, G. Statistical methods in medical research. 3rd edition. Blackwell Scientific Publications, Oxford. 1994. page 99 There were statistically significant different between the two groups.
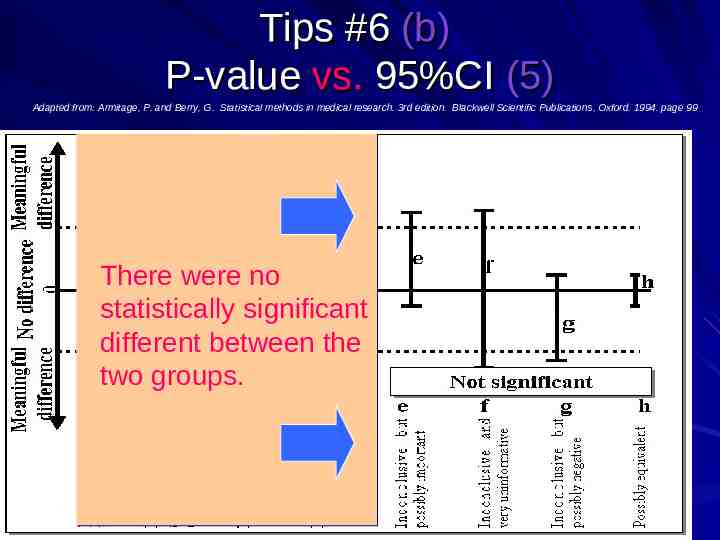
Tips #6 (b) P-value vs. 95%CI (5) Adapted from: Armitage, P. and Berry, G. Statistical methods in medical research. 3rd edition. Blackwell Scientific Publications, Oxford. 1994. page 99 There were no statistically significant different between the two groups.
P-value vs. 95%CI (4) Save tips: – Always report 95%CI with p-value, NOT report solely p-value – Always interpret based on the lower or upper limit of the confidence interval, p-value can be an optional – Never interpret p-value 0.05 as an indication of no difference or no association, only the CI can provide this message.
Steps of Statistical Applications (Practical guides for beginners) Begin at the conclusion Identify the primary research question Identify the primary study outcome Identify type of the study outcome Identify type of the study design Generate a mock data set Identify type of the main statistical goal List choices of the statistical methods Select the most appropriate statistical method Perform the data analysis using a software Report and interpret the results from the outputs
The outcome determine statistics Continuous Mean Median Categorical Proportion (Prevalence Or Risk) Linear Reg. Count Survival Rate per “space” Median survival Risk of events at T(t) Logistic Reg. Poisson Reg. Cox Reg.
Dependency of the study outcome required special statistical methods to handle it Continuous Mean Median Categorical Proportion (Prevalence Or Risk) Linear Reg. Count Survival Rate per “space” Median survival Risk of events at T(t) Logistic Reg. Poisson Reg. Mixed model, multilevel model, GEE Cox Reg.
Back to the conclusion Continuous Categorical Count Survival Appropriate statistical methods Mean Median Proportion (Prevalence or Risk) Rate per “space” Median survival Risk of events at T(t) Magnitude of effect 95% CI Answer the research question based on lower or upper limit of the CI P-value
Steps of Statistical Applications (Practical guides for beginners) Begin at the conclusion Identify the primary research question Identify the primary study outcome Identify type of the study outcome Identify type of the study design Generate a mock data set Identify type of the main statistical goal List choices of the statistical methods Select the most appropriate statistical method Perform the data analysis using a software Report and interpret the results from the outputs
Perform the data analysis using a software Use the data being generated as if it would be after completion of the research Analyze according to the analysis plan Try to understand the computer output and to find if the research question has been answered: – What is the magnitude of effect and its 95% confidence interval? – Was the results due to the role of chance?
Steps of Statistical Applications (Practical guides for beginners) Begin at the conclusion Identify the primary research question Identify the primary study outcome Identify type of the study outcome Identify type of the study design Generate a mock data set Identify type of the main statistical goal List choices of the statistical methods Select the most appropriate statistical method Perform the data analysis using a software Report and interpret the results from the outputs
Writing Results Sections Outline Sections: Study algorithm Characteristics of the study sample Results of an exploratory analysis to support ways to answer the RQ Results to answer the RQ Results of an exploratory analysis to know more about the answer of the RQ Follow formats required by the research sponsor or the target journal Best done with SAP – Statistical Analysis Plan Narrated tables or figures with key messages and avoid repetitions Do not include explanations in Results section
Tips for Writing Results Section Report results with purpose Refer to the corresponding table or figures early at the beginning of the descriptions Report sufficient data to allow evaluation of the calculation while avoid redundancy Document steps of data analysis from which the results were transcribed Provide statistical inference for the main findings that are the basis for the conclusions Always report the confidence intervals, p-value can be an optional – not the main target
Q&A Thank you