Ohio State Presentation Template

28 Slides2.31 MB
Ohio State Presentation Template
Provide learning outcomes, goals or an agenda. Use slide layouts and other template features Improve accessibility for assistive tech users and reduced cognitive load Implement universal design practices for increased audience understanding 2 Updated 3/31/2022
Start a new section when changing topics or presenters. Select Home, Section, Add Section. Provide presenter(s) contact info and/or a short description. 3
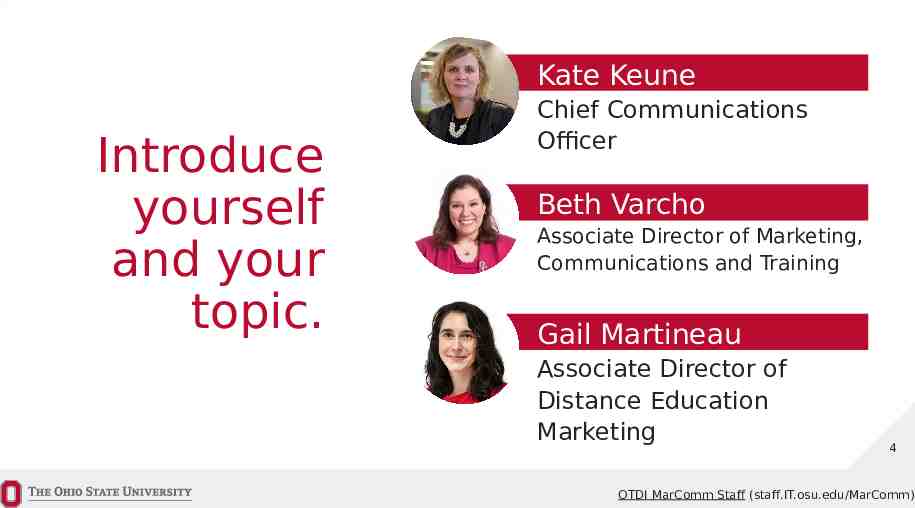
Kate Keune Introduce yourself and your topic. Chief Communications Officer Beth Varcho Associate Director of Marketing, Communications and Training Gail Martineau Associate Director of Distance Education Marketing 4 OTDI MarComm Staff (staff.IT.osu.edu/MarComm)
Template Features Using the slide Layouts provided in the template 5
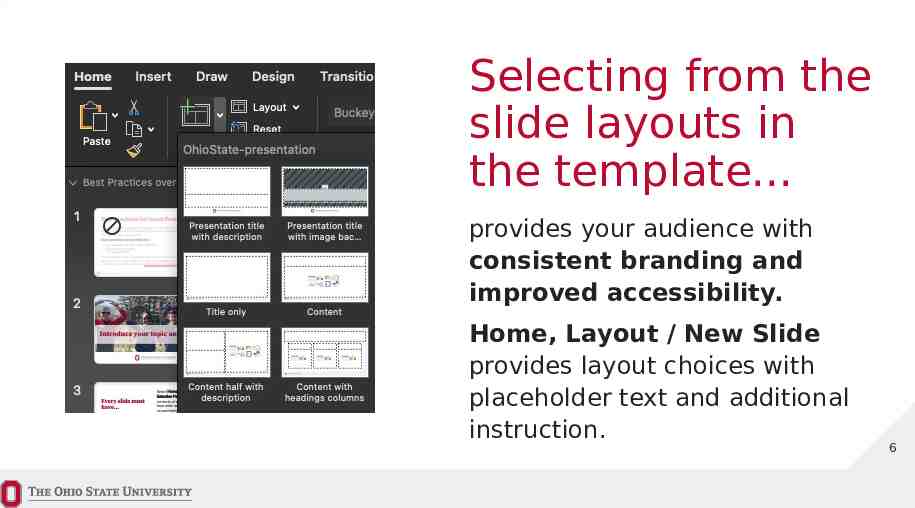
Selecting from the slide layouts in the template. provides your audience with consistent branding and improved accessibility. Home, Layout / New Slide provides layout choices with placeholder text and additional instruction. 6
Use headings and lists to organize content. Use Indent More / Less to cycle through text styles rather than Bullet / Numbering functions or the Tab key. Using a list is a good way to organize thoughts. Numbering creates a sequence or ranking order. 7
Keep it simple with the “Title Only” slide layout. 8
Don’t put everything on every slide. Summarize the takeaway in a few large words. Provide lengthier details in notes and hidden slides for your audience to reference later. 9
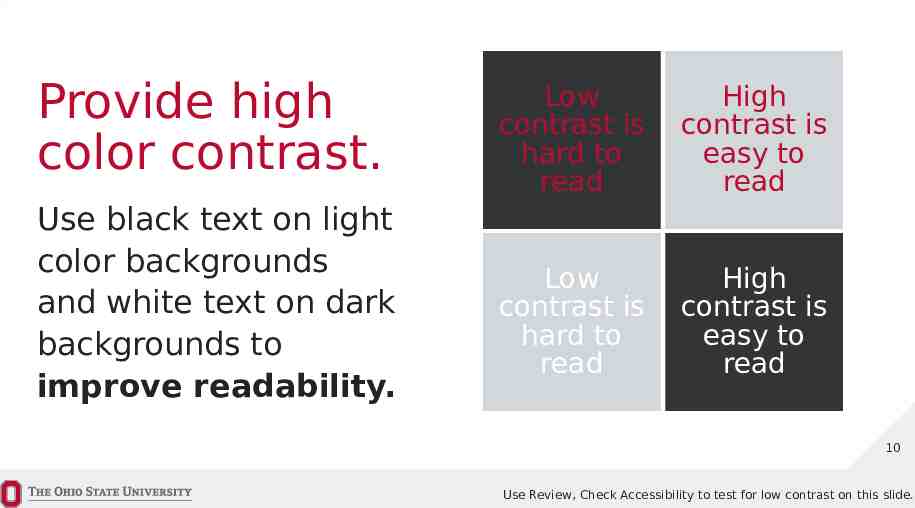
Provide high color contrast. Use black text on light color backgrounds and white text on dark backgrounds to improve readability. Low contrast is hard to read High contrast is easy to read Low contrast is hard to read High contrast is easy to read 10 Use Review, Check Accessibility to test for low contrast on this slide.
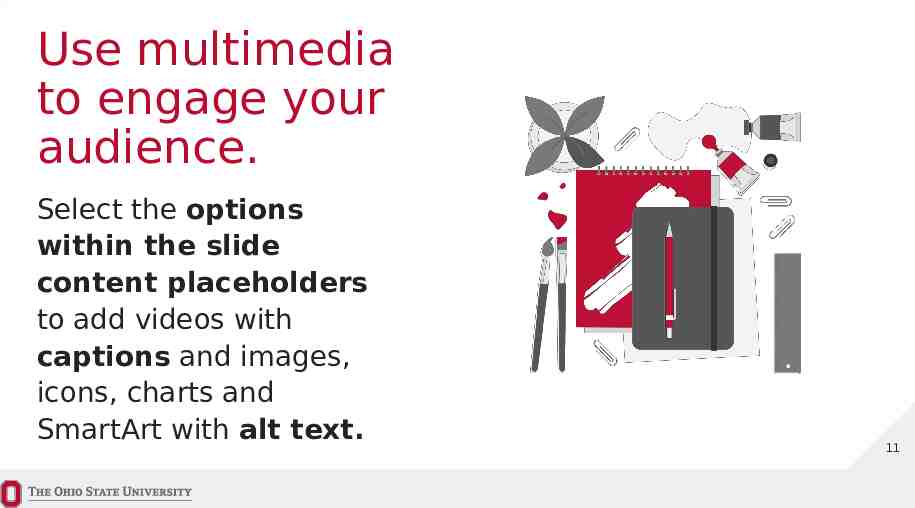
Use multimedia to engage your audience. Select the options within the slide content placeholders to add videos with captions and images, icons, charts and SmartArt with alt text. 11
Accessible Presentations Consider your audience’s experience, size, location and level of understanding. 12 Learn more about creating accessible PowerPoints (go.osu.edu/Accessible-PowerPoint)
Allow your audience to download the presentation. Provide descriptive hyperlinked text followed by the shortened web address in a pre-presentation email and on your first slide. Remember to shorten links (go.osu.edu) and use CamelCase when appropriate. Your audience will appreciate it! 13
Every slide must have a unique and meaningful title, placed within the Title placeholder of one of the slide Layouts provided in the template, and a logical read order. 14
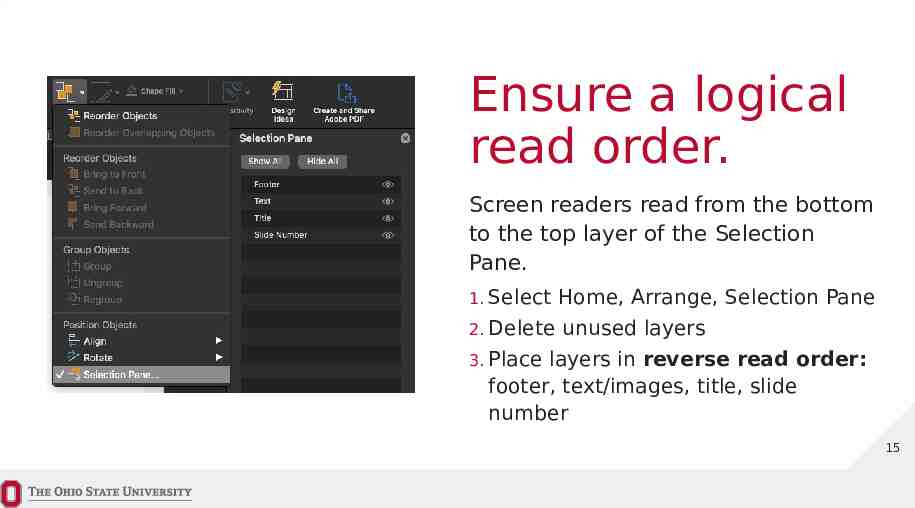
Ensure a logical read order. Screen readers read from the bottom to the top layer of the Selection Pane. 1. Select Home, Arrange, Selection Pane 2. Delete unused layers 3. Place layers in reverse read order: footer, text/images, title, slide number 15
Is your content readable to your audience? Virtual audiences can sit close and see more content on slides, versus in-person audiences who sit far and see less. Also consider the projection display size and scale your content (larger and less text) for smaller screens. 16
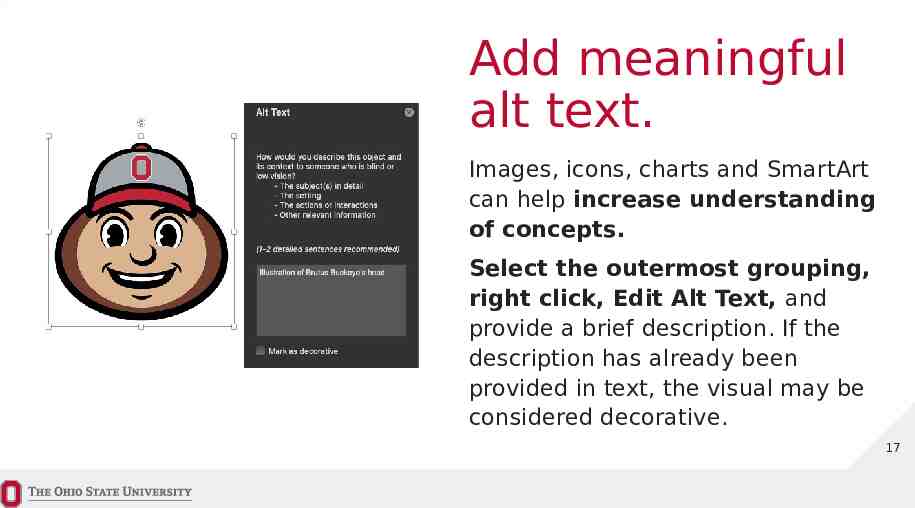
Add meaningful alt text. Images, icons, charts and SmartArt can help increase understanding of concepts. Select the outermost grouping, right click, Edit Alt Text, and provide a brief description. If the description has already been provided in text, the visual may be considered decorative. 17
Use hidden slides or notes to improve understanding and reduce cognitive load. The scenario: You want to show an image while you speak about how it relates to your topic. The problem: Someone who cannot see the image or who is looking at your presentation file only and cannot hear you will not be able to follow your talking points. This affects people with visual, auditory and cognitive disabilities. The solution: Add a note or create a hidden slide by right clicking the slide thumbnail and selecting “Hide Slide.” Provide information that will aid in your audience’s comprehension and that of screen reader users. The information will be available to those who have your presentation file. 18
Charts and SmartArt Represent data and processes while adding visual interest and increasing understanding of concepts! 19
Use Charts and SmartArt to demonstrate data, concepts or processes. Thoughtfully consider which type would best represent what you are trying to convey. Examples will follow! Charts and SmartArt are not easily read by screen readers, so do not rely exclusively on visuals and colors to communicate your message. Apply alt text to the outermost grouping to fully describe the message that needs to be communicated. 20
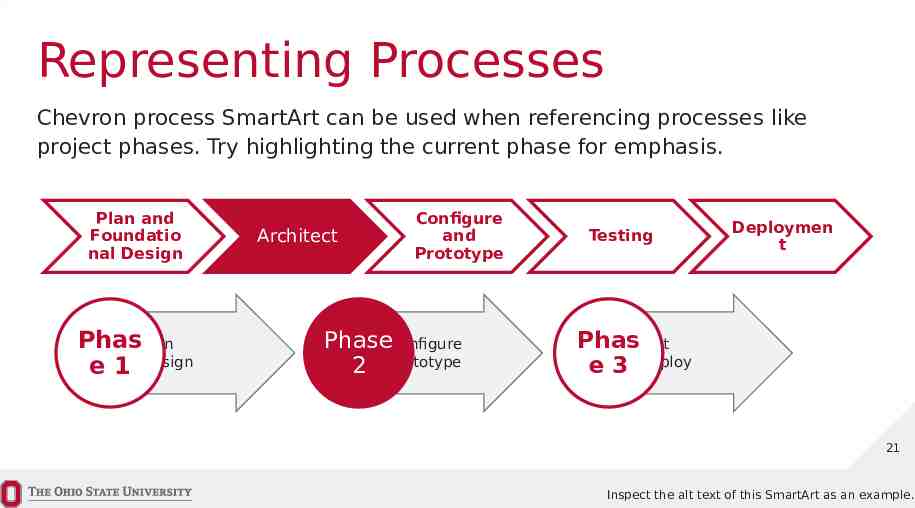
Representing Processes Chevron process SmartArt can be used when referencing processes like project phases. Try highlighting the current phase for emphasis. Plan and Foundatio nal Design Phas Plan e 1 Design Architect Configure and Prototype Configure Phase 2 Prototype Testing Deploymen t Phas Test e 3 Deploy 21 Inspect the alt text of this SmartArt as an example.
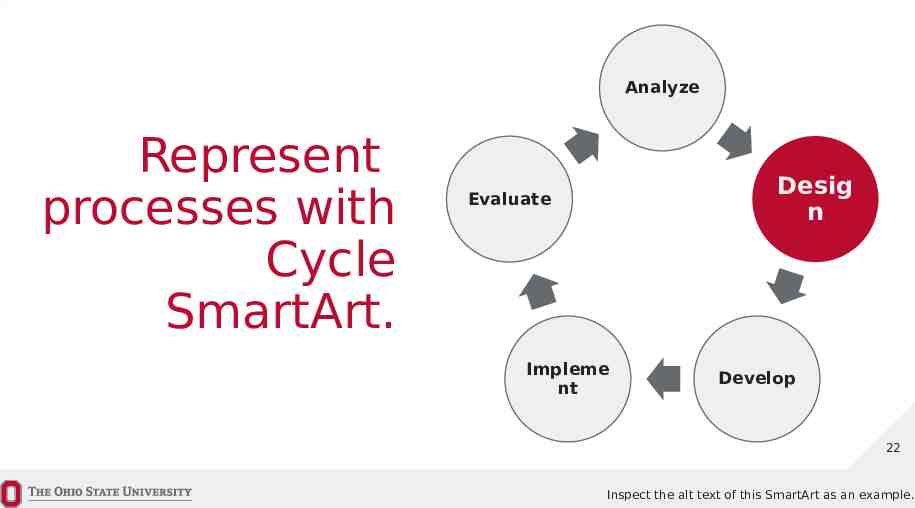
Analyze Represent processes with Cycle SmartArt. Desig n Evaluate Impleme nt Develop 22 Inspect the alt text of this SmartArt as an example.
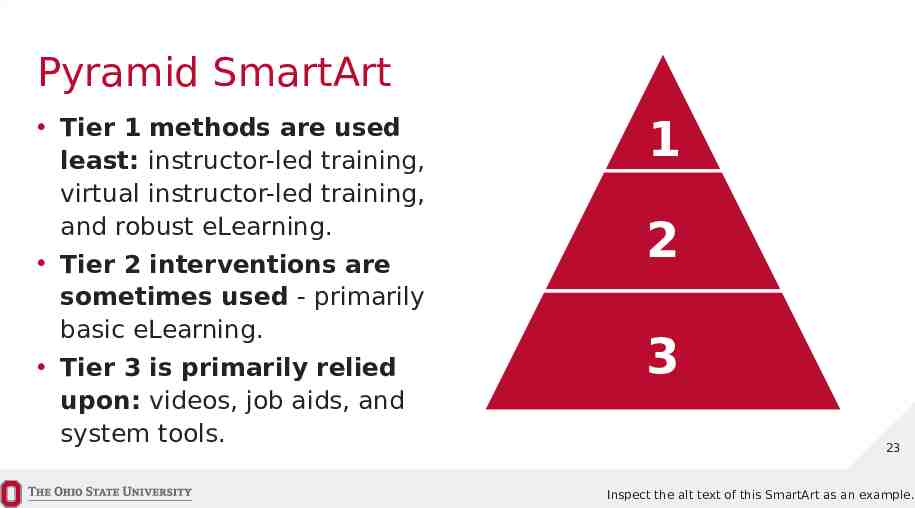
Pyramid SmartArt Tier 1 methods are used least: instructor-led training, virtual instructor-led training, and robust eLearning. Tier 2 interventions are sometimes used - primarily basic eLearning. Tier 3 is primarily relied upon: videos, job aids, and system tools. 1 2 3 23 Inspect the alt text of this SmartArt as an example.
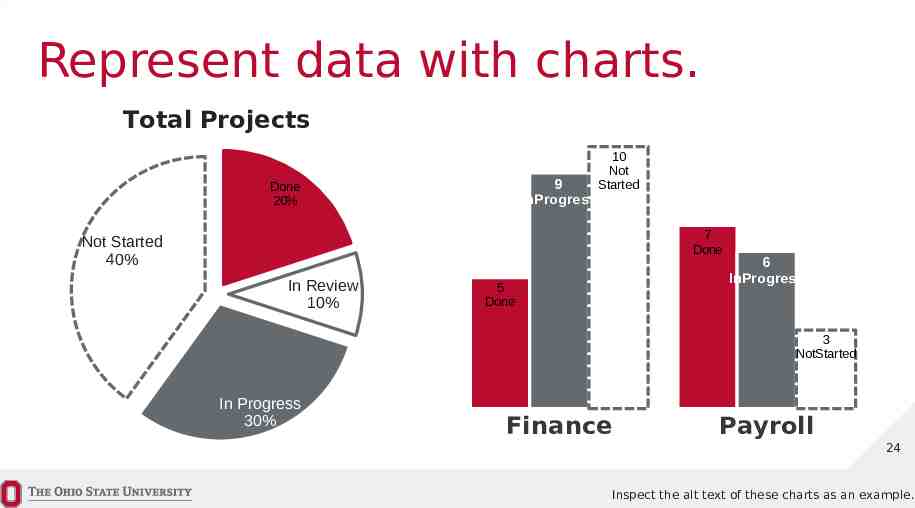
Represent data with charts. Total Projects 9 InProgress Done 20% 10 Not Started 7 Done Not Started 40% In Review 10% 5 Done 6 InProgress 3 NotStarted In Progress 30% Finance Payroll 24 Inspect the alt text of these charts as an example.
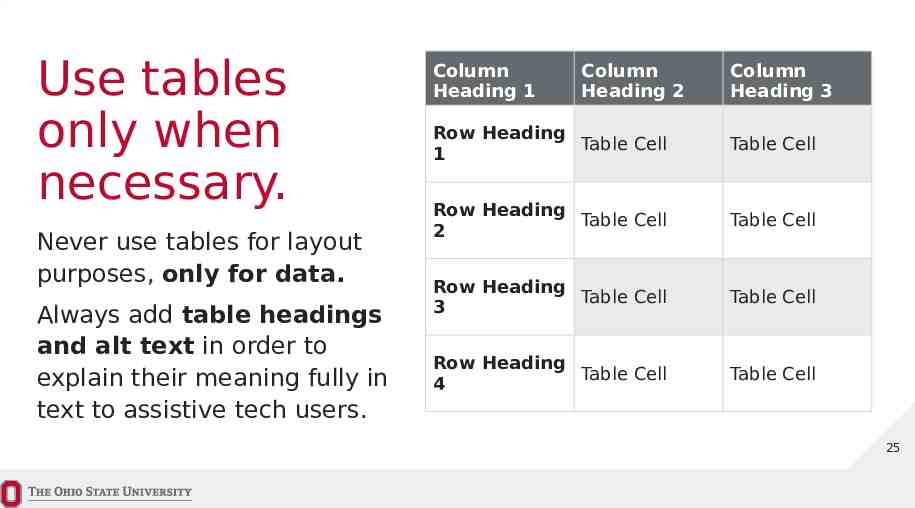
Use tables only when necessary. Never use tables for layout purposes, only for data. Always add table headings and alt text in order to explain their meaning fully in text to assistive tech users. Column Heading 1 Column Heading 2 Column Heading 3 Row Heading Table Cell 1 Table Cell Row Heading Table Cell 2 Table Cell Row Heading Table Cell 3 Table Cell Row Heading Table Cell 4 Table Cell 25
In conclusion Review key points and acknowledge future directions. Provide a summary takeaway statement. Direct your audience to useful resources. Encourage next steps or course of action. Provide contact information. Take questions from the audience. Request feedback by providing a survey. 26
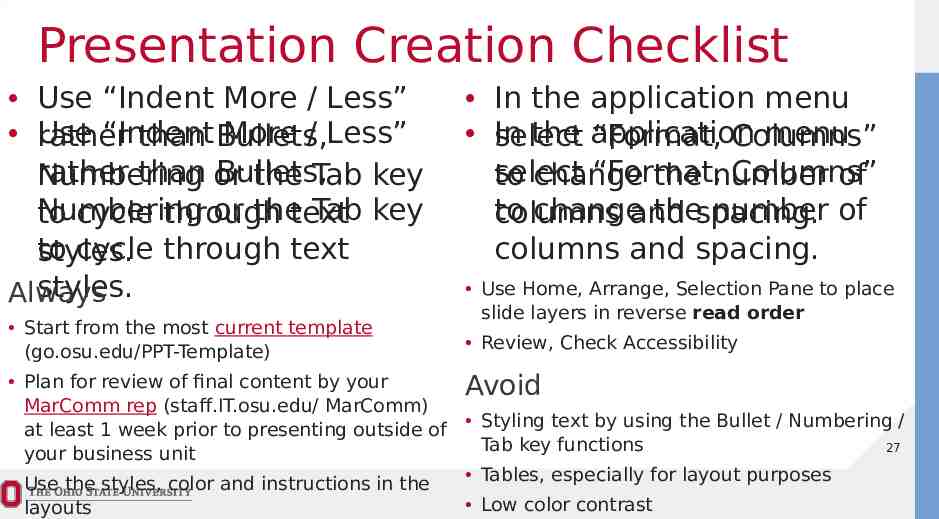
Presentation Creation Checklist Use “Indent More / Less” Use “Indent More / Less” rather than Bullets, rather than or Bullets, Numbering the Tab key Numbering or thetext Tab key to cycle through to cycle through text styles. styles. Always Start from the most current template (go.osu.edu/PPT-Template) Plan for review of final content by your MarComm rep (staff.IT.osu.edu/ MarComm) at least 1 week prior to presenting outside of your business unit Use the styles, color and instructions in the layouts In the application menu In the application menu select “Format, Columns” select “Format, Columns” to change the number of to changeand thespacing. number of columns columns and spacing. Use Home, Arrange, Selection Pane to place slide layers in reverse read order Review, Check Accessibility Avoid Styling text by using the Bullet / Numbering / Tab key functions 27 Tables, especially for layout purposes Low color contrast
Thank you! Learn more about creating accessible PowerPoints (go.osu.edu/Accessible-PowerPoint)