Benchmarking Ahmed Mohammed Seth Shafer Shou-Jen Steve Wang


67 Slides413.00 KB
Benchmarking Ahmed Mohammed Seth Shafer Shou-Jen Steve Wang
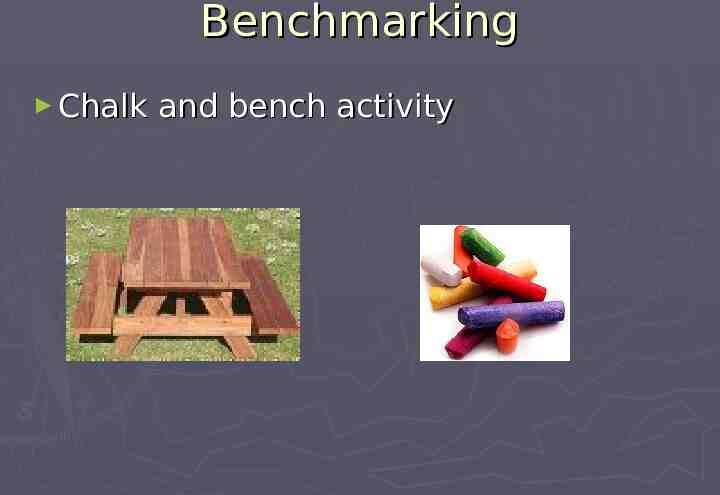
Benchmarking Chalk and bench activity
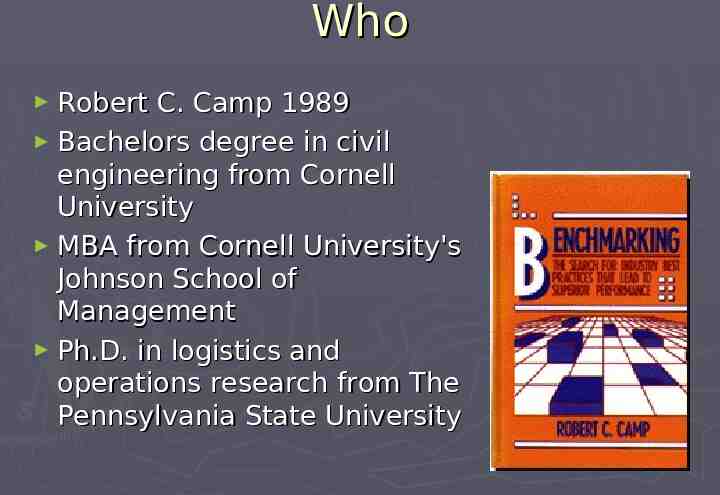
Who Robert C. Camp 1989 Bachelors degree in civil engineering from Cornell University MBA from Cornell University's Johnson School of Management Ph.D. in logistics and operations research from The Pennsylvania State University
Benchmarking Is a process Is secrets of success
Four Forms Generic Functional Competitive Internal
Types Process benchmarking Financial benchmarking Benchmarking from an investor perspective Performance benchmarking Product benchmarking Strategic benchmarking Functional benchmarking Best-in-class benchmarking Operational benchmarking
Activity Connect the dots Rules 1. Draw in a straight line. 2. Pen does not leave the blackboard. 3. All dots have to be connected Goal: As few lines as possible.
Prerequisites Will and commitment Vision and strategic objective link Goals to becoming the best Openness to new ideas
Prerequisites (cont.) Understanding of existing processes, products, services, practices, and customer needs Documented Processes Process analysis Research, communication, and teambuilding skills
Obstacles Internal Focus Objective too broad Unrealistic timetables Poor team composition OK-in-class Improper emphasis Insensitivity to partners Limited top-management support
Rationale Global competition Current standing of company A best-in-class model Customers are better informed Support of total quality
Examples Xerox Computer Hardware
Computer Hardware Comparison of performance
Xerox Started in 1908 Big company by the 1960s Rapid expansion of the middle management Competition from Japanese companies by 1980s
Benchmarked Processes Supplier management system Inventory management Manufacturing system Marketing Quality
Benefits of benchmarking Fewer customer complaints Reduction of defects Reduction in service response time Reduction in defective incoming parts Reduction in inventory costs Reduction in labor costs Reduction in billing errors
Benefits of benchmarking Increase in customer satisfaction Increase in marketing productivity Increase in distribution productivity Increase in product reliability
Seven steps to benchmarking 1. 2. 3. 4. 5. 6. 7. Identify what to benchmark Determine what to measure Identify who to benchmark Collect the data Analyze the data and determine the gap Set goals and develop an action plan Monitor the process
Seven steps to benchmarking Step-1 Identify what to benchmark Activities involved in step-1 are Clarifying the benchmarking objective Decide whom to involve Define the process Consider the scope Set the boundaries Agree on what happens in the process Flow chart the process
Step-1 continue Identify what to benchmark Two approaches of benchmarking 1) Strategic benchmarking Financial function could benchmark it activities (billing process) 2) Organizational benchmarking Considerable research is done. Like soldering process, driver motor assembly benchmarking
Step-1 continue As a starting point benchmark your customer interfaces by not limiting benchmarking to products. Like contract truckers, answering phone calls, accuracy of bills. Benchmarking Product, manufacturing process, equipment, and business processes.
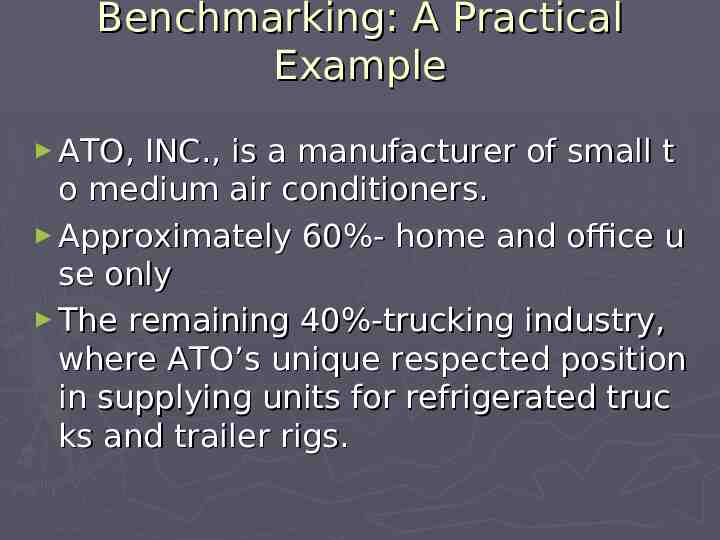
Benchmarking: A Practical Example ATO, INC., is a manufacturer of small t o medium air conditioners. Approximately 60%- home and office u se only The remaining 40%-trucking industry, where ATO’s unique respected position in supplying units for refrigerated truc ks and trailer rigs.
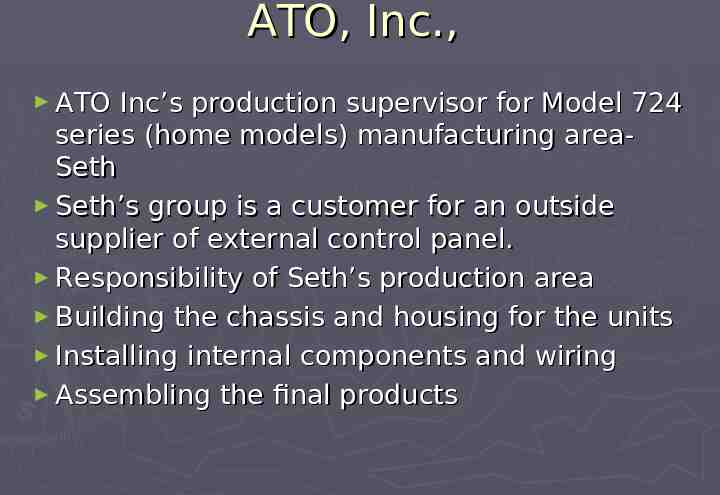
ATO, Inc., ATO Inc’s production supervisor for Model 724 series (home models) manufacturing areaSeth Seth’s group is a customer for an outside supplier of external control panel. Responsibility of Seth’s production area Building the chassis and housing for the units Installing internal components and wiring Assembling the final products
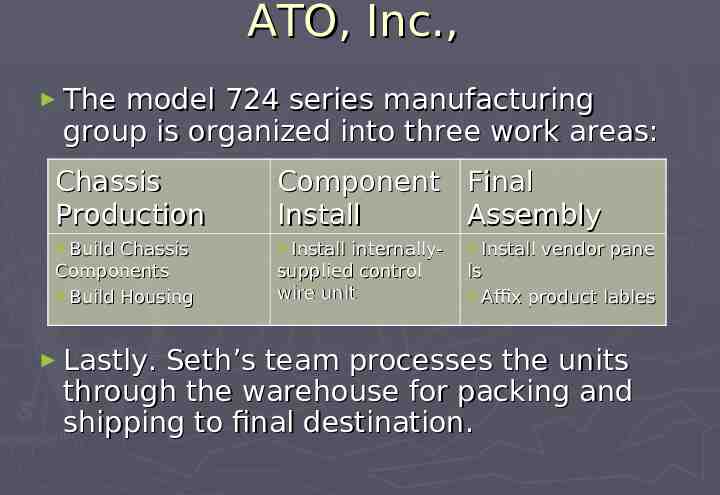
ATO, Inc., The model 724 series manufacturing group is organized into three work areas: Chassis Production Component Final Install Assembly Build Install Chassis Components Build Housing Lastly. internallysupplied control wire unit Install vendor pane ls Affix product lables Seth’s team processes the units through the warehouse for packing and shipping to final destination.
ATO, Inc., What is cooking in ATO’s Each of the work area is organized into work teams responsible for setting and attaining their goals and managing the ir work processes. Seth handles most of the interaction b etween the work team to ensure coord ination and planning.
ATO, Inc., Seth’s production group members are working towards continuously improving the process. Revamping of the production line and installation of new equipment. The feel they have reached the plateau. Steve, most experienced assembler, put it this way “Look, we’ve done all we can on this process. We’ve tried everything and our numbers are as good as they are going to get. Got it?”
ATO, Inc., Ahmed: “Steve’s feelings are understandable, you got to do something Seth wake up.” They have been working hard and their recent most improvement produced smaller gains. Seth wakes up Let us do benchmarking study for the entire assembly process.
Step-1 The first step identify what to benchmark has following sub steps Clarify the benchmarking objectives Decide whom to involve Define the process Consider the scope Set the boundaries Agree on the process Flow chart the process
Clarify The Benchmarking Objective We have already discussed why we have decided to benchmark-setting priorities for improvement, addressing a specific problem which needs attention and not meeting goals. Why Seth has decided to do benchmark They have upgraded equipment, everyone had needed skills, and taken steps to improve quality but they are still searching for way to improve. Their objective was to have best in class final assembly process.
Seth is deciding whom to involve in benchmarking team Management support to the team Include employees who are close to the process. Include employees who have interest and knowledge about what goes on outside the boundaries of process. “Let us also consider internal suppliers and customers of the process. Who supply products, information, or other key inputs. Customers receive our service, products or output.”
Benchmarking team Seth-Production supervisor for the Model 724 series. Given decision making authority. Steve- A senior assembler, member of the quality improvement team. Bill- An assembler a new employee at ATO Maria-An inspector got promoted from the shipping department and just completed training for final assembly area. She installs the labels and information plates at the end of the process (is some sense she is a final customer for the process) Simon-A former assembler who now works in component installation area, but occasionally done assembly when team requires backup (brings internal supplier perspective)
Sub steps of step-1 Define the process One need to clearly define process. A process is a series of interrelated task that are organized to produce an output. Consider the scope Not to be too broad or too narrow.
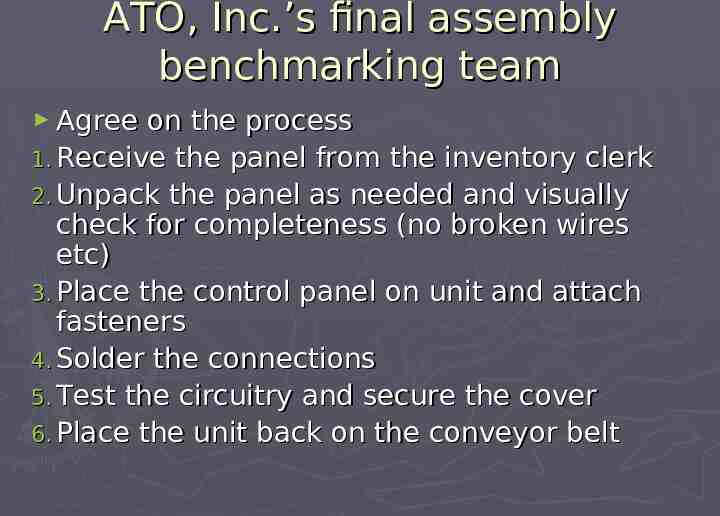
ATO, Inc.’s final assembly benchmarking team The decide to benchmark control panel installation because they had recently experienced troubled with connections coming loose. Steve-”That’s a good place to focus, and it is broad enough to achieve something and narrow enough that we can wrap our arms around it”
ATO, Inc.’s final assembly benchmarking team Simon-” Sure. Let us define the starting and ending point of the process so that we all know exactly what we are working on?” . Set the boundaries After a few minutes of discussion the team reached an agreement. Starting point-receive the panel from the inventory clerk Ending boundary-place the unit back to the conveyor belt.
ATO, Inc.’s final assembly benchmarking team Agree on the process 1. Receive the panel from the inventory clerk 2. Unpack the panel as needed and visually check for completeness (no broken wires etc) 3. Place the control panel on unit and attach fasteners 4. Solder the connections 5. Test the circuitry and secure the cover 6. Place the unit back on the conveyor belt
Step-2 of seven step model Determine what to measure has three major sub steps to consider 1. Examine the flow chart 2. Establish the process measures 3. Verify that measures match objectives
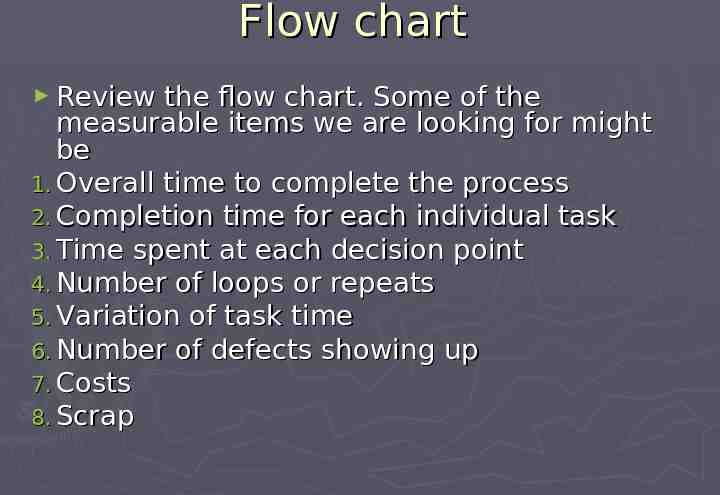
Flow chart Review the flow chart. Some of the measurable items we are looking for might be 1. Overall time to complete the process 2. Completion time for each individual task 3. Time spent at each decision point 4. Number of loops or repeats 5. Variation of task time 6. Number of defects showing up 7. Costs 8. Scrap
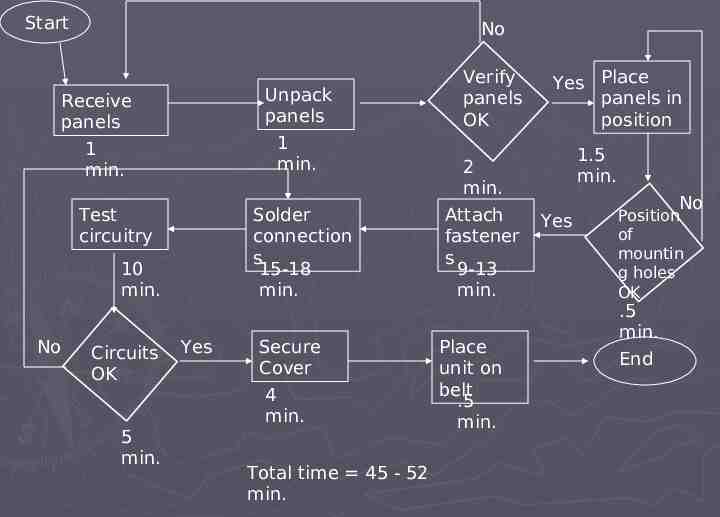
Start No Unpack panels 1 min. Receive panels 1 min. Test circuitry Solder connection s 15-18 min. 10 min. No Circuits OK 5 min. Yes Secure Cover 4 min. Total time 45 - 52 min. Verify panels OK 2 min. Attach fastener s 9-13 min. Place unit on belt .5 min. Yes Place panels in position 1.5 min. Yes No Position of mountin g holes OK .5 min. End
Step-2 Bill-” Since we know where our inputs and outputs are coming from, shouldn’t we consider measuring that are important to our internal suppliers and customers too?”. 2)Establish process measures Consider measures outside the process Measures of your external customers should influence the choice of process measures to benchmark (even though it is distant from customers contact)
Step-2 Measures of your internal suppliers and customers requirement. Since their performance is linked to yours, your measures should be linked as well ATO, Inc internal customers are the shipping and warehouse department and their internal suppliers are component installation area and inventory department.
Step-2 Link supplier and customer measures with in-process measures.(fig) Seth’s benchmarking team took the intervi ew of both internal suppliers and custome rs. As the team looked back they concluded b ased on the flow chart, internal suppliers a nd customer measures. They concluded that the total time for the process varied due to several reasons.
Step-2 Seth’s decided to benchmark three measures Time for completion. Downtime Number of reworks Verify that measures match objectives For example, if a group’s goal was to increase productivity, they would need to look at measures such as time quantities of output, cost per unit
Step-3 Identify who to benchmark Conduct general research Choose the level to benchmark Internal Competitive and noncompetitive World class Seth’s team considered their ATO’s pla nt in northwest region and best in class Bestco, Inc.
Step-4 :collect the data It’s time to gather information on the performance level of your benchmarking target and how they mange their processes. Three main sources Internal Public information Other companies: this is the most exciting part, we actually go out and discover new ideas and make careful observation.
Step-4 The techniques for gathering benchmarking information. Using a questionnaire Conducting a benchmarking site visit Using a questionnaire: things to remember Include a detail information of the process List task included List problem or concerns relating to it
Step-4 Including information and questions on the how the process is measures and performance criteria 1. Quality 2. Time 3. Cost, etc.
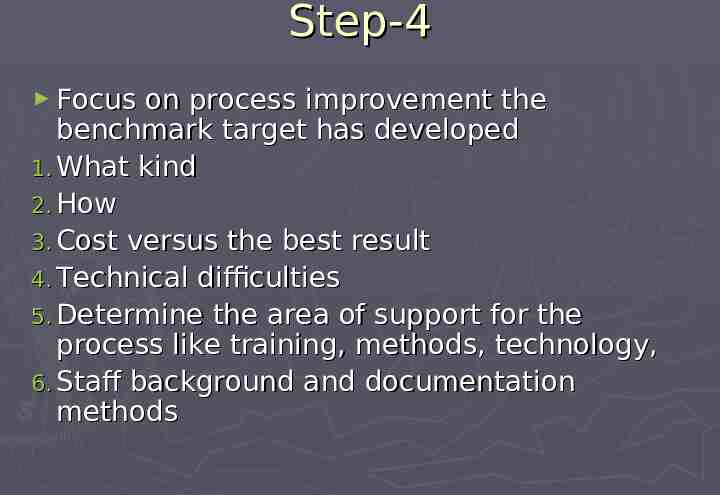
Step-4 Focus on process improvement the benchmark target has developed 1. What kind 2. How 3. Cost versus the best result 4. Technical difficulties 5. Determine the area of support for the process like training, methods, technology, 6. Staff background and documentation methods
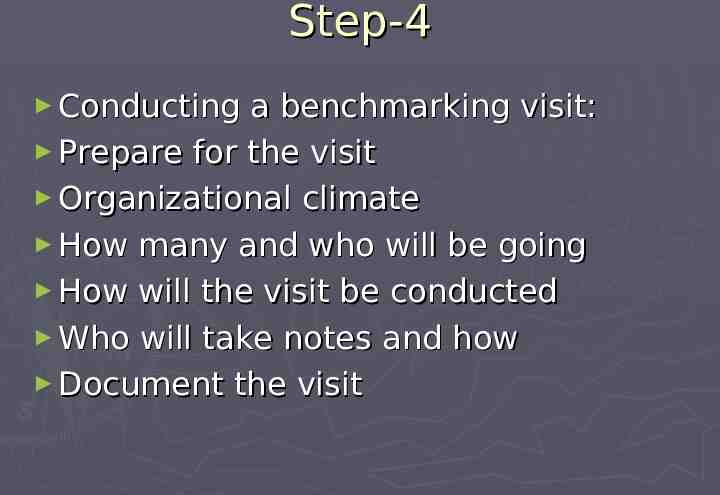
Step-4 Conducting a benchmarking visit: Prepare for the visit Organizational climate How many and who will be going How will the visit be conducted Who will take notes and how Document the visit
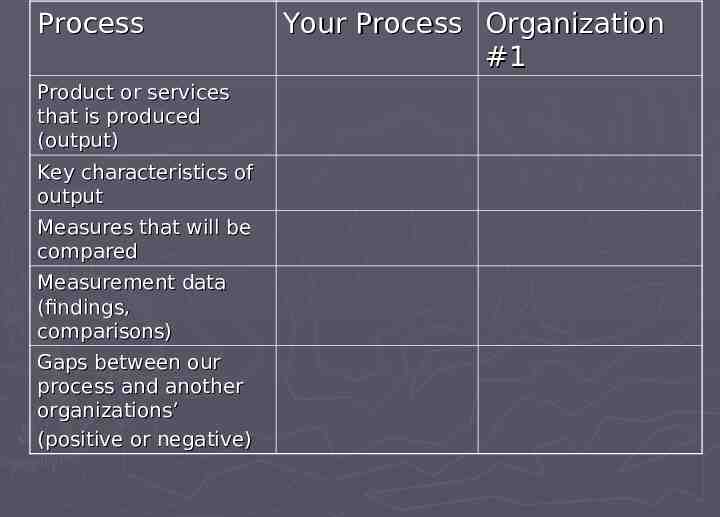
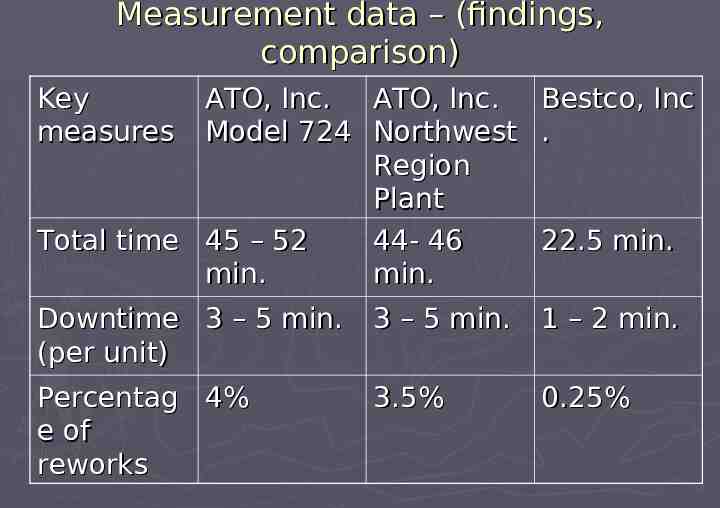
Process Product or services that is produced (output) Key characteristics of output Measures that will be compared Measurement data (findings, comparisons) Gaps between our process and another organizations’ (positive or negative) Your Process Organization #1
Step-4 Seth’s team have the results
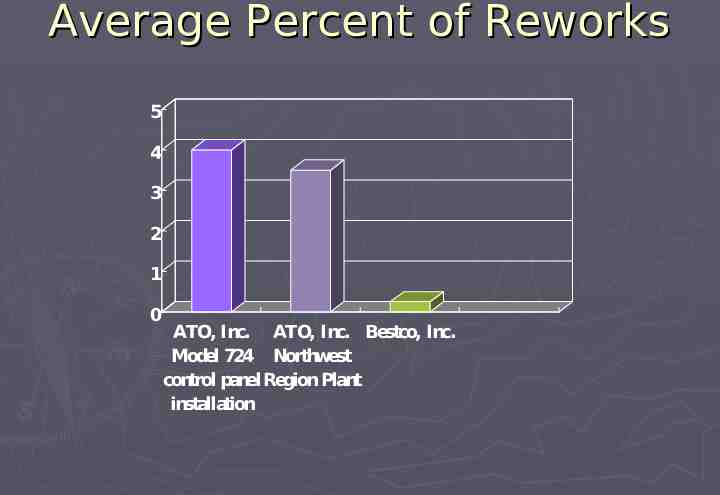
Measurement data – (findings, comparison) Key measures ATO, Inc. ATO, Inc. Model 724 Northwest Region Plant Total time 45 – 52 44- 46 min. min. Bestco, Inc . Downtime 3 – 5 min. (per unit) 3 – 5 min. 1 – 2 min. Percentag 4% e of reworks 3.5% 0.25% 22.5 min.
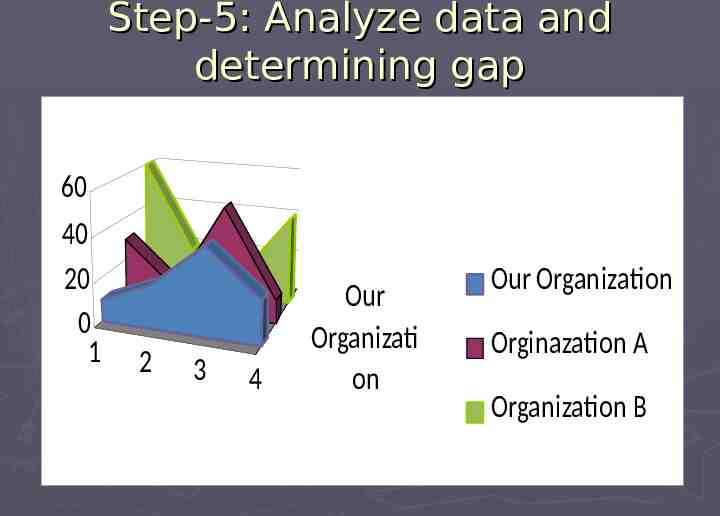
Step-5: Analyze data and determining gap 60 40 20 0 1 2 3 4 Our Organizati on Our Organization Orginazation A Organization B
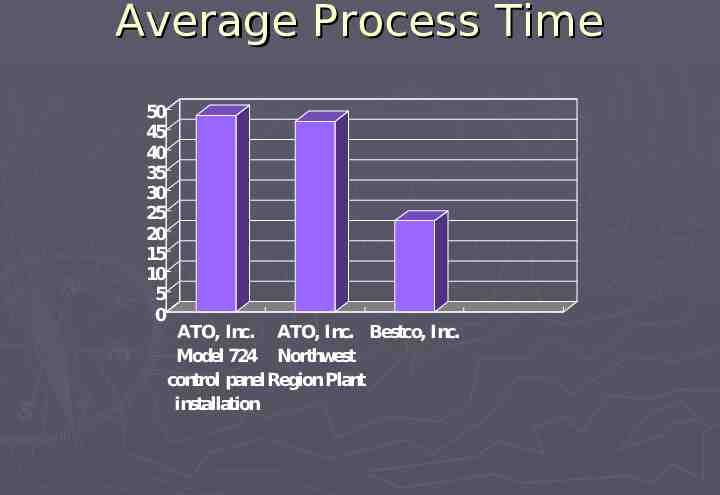
Average Process Time 50 45 40 35 30 25 20 15 10 5 0 ATO, Inc. ATO, Inc. Bestco, Inc. Model 724 Northwest control panel Region Plant installation
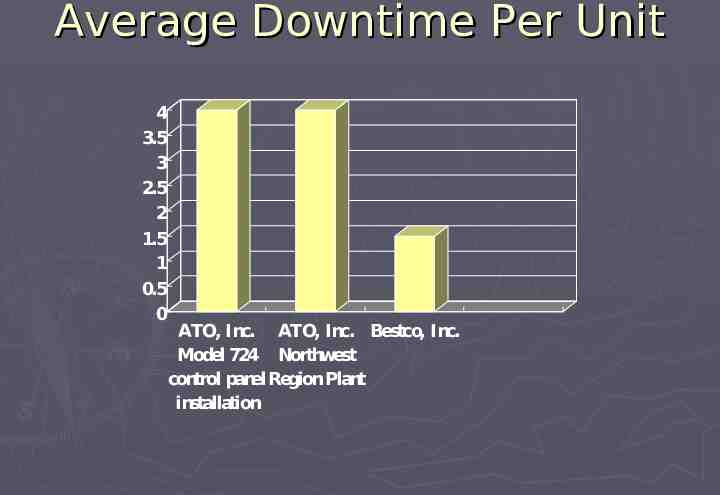
Average Downtime Per Unit 4 3.5 3 2.5 2 1.5 1 0.5 0 ATO, Inc. ATO, Inc. Bestco, Inc. Model 724 Northwest control panel Region Plant installation
Average Percent of Reworks 5 4 3 2 1 0 ATO, Inc. ATO, Inc. Bestco, Inc. Model 724 Northwest control panel Region Plant installation
Step-5 Seth’s team was surprised after looking at the gap between their processes and that of Bestco, Inc. Steve added “ You know, if someone ha ve told me a month ago that you could g et these kind of numbers, I wouldn’t hav e believed it,” Seth” we thought we have improved our process as much as we could.”
Step-6: Set goals and develop and action plan Set performance goal Goal should be achievable in increment( 3*5 15 hrs) Goals should realistic (time, res, abilities, skills and budget) Goal should be measurable ( reducing three hours) Goal should be finite (starting and ending pt) Goal should be supported
Step-6 Seth’s team benchmarking goals Reduce total task time to 30 minutes (5m per Q) Reduce downtime from three to one minute per unit (end goals to be reached in 9 m) Reduce reworks from 4 percent to 2.5 percent (6m)
Step-6 Developing action plan Step One-determine tasks, timelines, and responsibilities Points to consider-who will be affected and responsible for implementation? What resources will the person responsible for task need. How the information will be shared Step Two-develop contingency plan
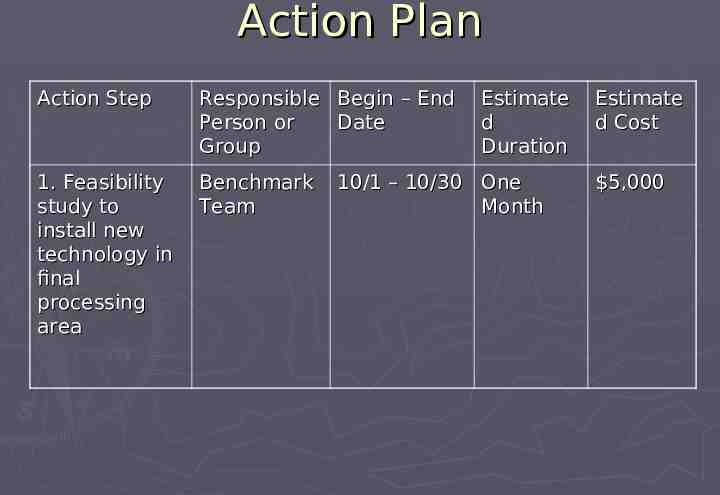
Action Plan Action Step Responsible Begin – End Person or Date Group 1. Feasibility study to install new technology in final processing area Benchmark Team Estimate d Duration 10/1 – 10/30 One Month Estimate d Cost 5,000
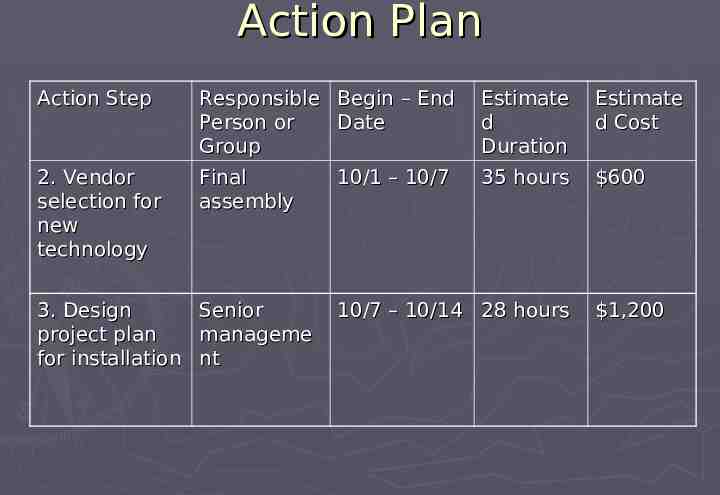
Action Plan Action Step Responsible Begin – End Person or Date Group Estimate d Duration Estimate d Cost 2. Vendor selection for new technology Final assembly 35 hours 600 3. Design Senior project plan manageme for installation nt 10/1 – 10/7 10/7 – 10/14 28 hours 1,200
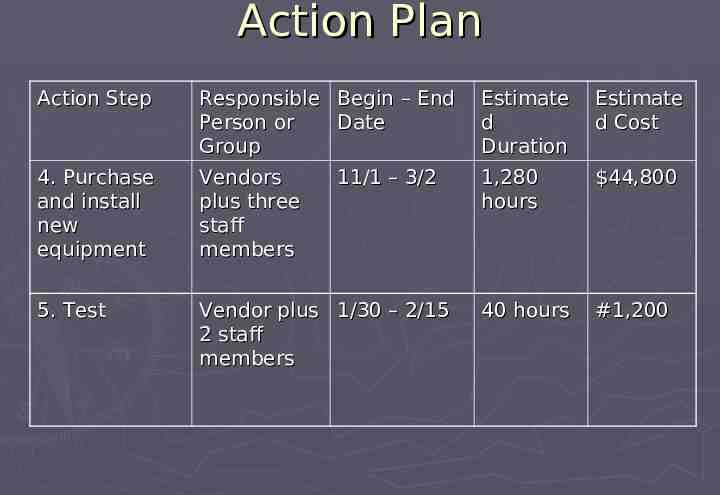
Action Plan Action Step Responsible Begin – End Person or Date Group Estimate d Duration Estimate d Cost 4. Purchase and install new equipment Vendors plus three staff members 1,280 hours 44,800 5. Test Vendor plus 1/30 – 2/15 2 staff members 40 hours #1,200 11/1 – 3/2
Step-7: Monitor the process Track the change Make benchmarking a habit Benchmarking progress report Regular progress meeting Monitor customers (internal and external) Monitor suppliers (internal and customer)
Discussion
Conclusion VS continuous improvement VS reengineering 7 Step benchmarking model
Thank you for your time.