Finance Workshop


74 Slides921.84 KB
Finance Workshop
Aims of the Finance Unit To develop an understanding of the basic financial and accounting concepts with emphasis on application in a pharmaceutical and biotechnology business development and licensing context. To provide an appreciation of accounting treatment, currency and tax and the effect on deal valuations and negotiations To provide an appreciation of the sources of finance available to companies and the impact it has on deal structures. To develop an understanding of financial modelling techniques to evaluate different types of licensing and business development deals. To provide an appreciation of valuation techniques and their applicability in different situations. To provide an appreciation of trends / benchmarks in deal values for different types of deals. To develop a practical capability to undertake financial modelling and valuations for different types of business development deals
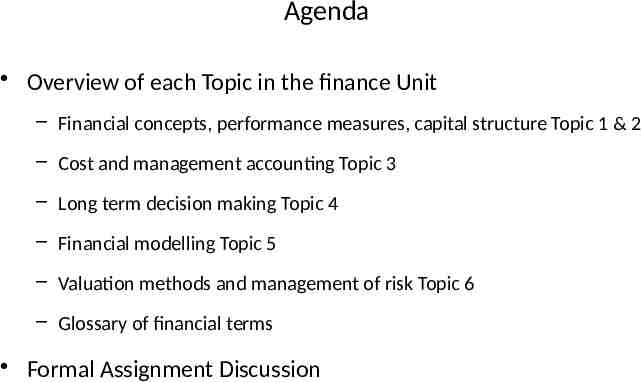
Agenda Overview of each Topic in the finance Unit – Financial concepts, performance measures, capital structure Topic 1 & 2 – Cost and management accounting Topic 3 – Long term decision making Topic 4 – Financial modelling Topic 5 – Valuation methods and management of risk Topic 6 – Glossary of financial terms Formal Assignment Discussion
Financial concepts Financial techniques Deals P&L Sales forecasts Operating costs Co-commercialisation Balance Sheet Funding Cash Flow Valuations WACC Benchmarks All deals Accounting Distribution, generics NPV Distribution, product acquisitions Company acquisitions Risk eNPV Decision trees Licensing & co-development Deal terms Scenarios Monte Carlo The Financial Journey
Finance Affects Every Type of Deal (except CDA) Early Stage Late stage Type of agreement Research Confidentiality Patent licences Material Transfers ( option to license) Contract Research Research collaboration ( licence) Contract Development Development collaboration ( licence) Manufacture ( supply) Product licence ( supply) Co-commercialisation Distribution Product acquisition Joint ventures Company acquisition / M&A Pre-clinical Phase I Phase II Phase III Preregistration Launch Marketed Patent Maturity Expiry Post patent expiry
UCLA and Medivation Early Stage Deal Example August 2005: Medivation licensed patents covering series of androgen synthesis inhibitors from UCLA in 2005 – Upfront 15,000 plus annual maintenance fee and reimbursement of patent filing and prosecution fees – 150,000 shares (1.6% of total) – sold for 49m August 2016 – 4% royalty on net sales – 13m NPV 1,140m monetisation Mar 16 – 8% of ‘sub-licensing income’ excluding royalty – 44m NPV May 2009: Phase 1 / 2 results in castration resistant prostate cancer patients reported at ASCO Oct 2009: Medivation signed global license deal with Astellas
Astellas and Medivation Enter Into Worldwide Agreement to Co-Develop and Co-Commercialize MDV3100 for the Treatment of Prostate Cancer -- Medivation to Receive 110 Million Upfront Cash Payment and Eligible to Receive 655 Million in Milestone Payments, 50 Percent of U.S. Profits and Double-Digit Royalties on Ex-U.S. Sales -TOKYO and SAN FRANCISCO, Oct 27, 2009 /PRNewswire-FirstCall via COMTEX News Network/ -- Astellas Pharma Inc. ("Astellas") and Medivation, Inc. (Nasdaq: MDVN) announced today that they have entered into a global agreement to develop and commercialize MDV3100, Medivation's investigational drug for the treatment of prostate cancer. MDV3100 is currently being evaluated in the Phase 3 AFFIRM clinical trial in men with castration-resistant prostate cancer who were previously treated with docetaxel-based chemotherapy. Under the terms of the agreement, Medivation will receive an up-front cash payment of 110 million. Medivation is also eligible to receive payments of up to 335 million upon the attainment of development and regulatory milestones plus up to an additional 320 million in commercial milestone payments. The companies will collaborate on a comprehensive development program that will include additional studies to develop MDV3100 for both lateand early-stage prostate cancer. Subject to receipt of regulatory approval, the companies will jointly commercialize MDV3100 in the U.S. The companies will share equally all U.S. development costs, commercialization costs, and profits. Astellas will have responsibility for developing and commercializing MDV3100 outside the U.S. and will pay Medivation tiered double-digit royalties on ex-U.S. sales.
Medivation and Astellas Deal Terms – October 2009 Source: SEC Global exclusive rights under patents to develop, manufacture and commercialise Product (Xtandi) containing patented compound for life of patent Co-commercialisation in US based on profit share 770m headline value – 110m signature – Astellas pay development costs, Medivation pay 50% of US studies – Development milestones 335m split by event by indication – Sales milestones 325m – sales 400m, 800m, 1,200m, 1600m – Tiered royalty – low teens to low twenties, e.g. 13%, 16%, 19%, 22%
Learning Objective 1 Recognise the key components of published corporate financial information and distinguish between their principal functions whilst reviewing the key conceptual issues which underpin the production of the information
Topic 1 – Basic Financial Concepts Financial accounting The income statement and balance sheet Deferred revenue, depreciation / amortization, tax and foreign exchange, Pharmaceutical industry accounts and accounting issues, Profit versus cash flow
The Financial Triangle P&L, balance sheet and cash flow are linked Example: capital spend Cash Flow Capital spend 10m January 17 Life of machine 10 years Profit & Loss / Income Statement Depreciation 1m Jan - Dec 17 Balance Sheet Fixed asset 9m December 17
Profit and Loss Account / Income Statement 2008 Medivation m Sales / licensing income 13 Cost of sales Gross profit 13 Distribution AstraZeneca bn AZ % sales 32 100% (7) 22% 25 78% ( 1) (1%) R&D (55) (5) (16%) S,G&A (22) (11) (34%) 1 1% Other income / expense Operating income (64) 9 28% Finance income / costs (2) ( 1) (1%) Profit before tax (62) 9 27% No tax (3) (8%) (62) 6 19% Tax Profit after tax Medivation cash burn amount?
Profit and Loss Account / Income Statement
Balance Sheet - basic accounting equation Assets What a company owns Liabilities What a company owes Equity What is leftover for the owners of the company This equality must always be true Example: An increase in an assets must be offset by a decrease in an asset or an increase in a liability or equity
Balance sheet item definitions Assets Accounts receivableMoney owned from customers Inventory Assets held for sale (or in process of being produced for sale) Prepaid expenses Expenses that are paid in advance (e.g. rent) Property, plant, equipment Land, building and equipment owned by the company, shown before and after depreciation Deferred charges Asset used to reduce future income (usually taxes) Goodwill Intangible asset created upon an acquisition Liabilities and shareholders‘ equity Accounts payable Money owed to vendors for product purchased Accrued liabilities Expenses incurred but not yet paid (e.g. salaries) provisions Capital lease obligations Payments on a lease treated as a loan Deferred credits / revenue Income received but not yet reported as income Loans Money borrowed from banks or shareholders Minority interest Third party ownership in company subsidiary Stockholders‘ equityInterest in assets after all liabilities are paid
Balance Sheet – AstraZeneca 31 Dec 08 Assets Cash marketable securities bn Liabilities and equity bn 4.3 Payables / Creditors* incl accruals 7.2 Receivables / Debtors* incl prepayments Inventory* Other current assets (tax receivable) Current assets 7.3 Tax payable 4.6 1.6 3.0 16.2 Other current liabilities (loans 1 year) Current liabilities 1.6 13.4 Tangible assets (Buildings) Intangible (Licence fees) 7.0 12.5 Long term debt ( 1 year) Deferred tax 10.9 3.1 Goodwill (Acq. Value NBV) 9.9 Deferred tax / other 1.2 Other non current liabilities 3.4 Non current assets 30.6 Non-current liabilities 17.4 Total assets 46.8 Total liabilities 30.8 Equity 4.4 Retained profit 11.6 Total liabilities equity 46.8 Total assets 46.8 Over 1 year
Balance Sheet – Medivation 31 Dec 08
Some Important Accounting Issues Financial standards require revenue and costs to be ‘matched’ over time. – 225m revenue received by Medivation is ‘recognised’ over the period until the obligations and costs for that revenue have been exhausted. Medivation estimated 3.46 years so annual revenue recognised each year is 65m. Remainder is ‘deferred revenue’ (Topic 1) Depreciation and amortisation – the spreading of costs over the useful life of the asset – Depreciation of tangible asset (equipment) 10m over 10 years 1m per year – Amortisation of intangible asset (IP licence fee) 10m over remaining life of patent say 8 years 1.25m per year Impairment – the write down in value of a long term asset because the value is no longer expected to generate the cash flow originally expected. – Goodwill on a company acquisition is written down in value because the acquisition is found not to have the cash generating capability originally expected Why are accounting issues important?
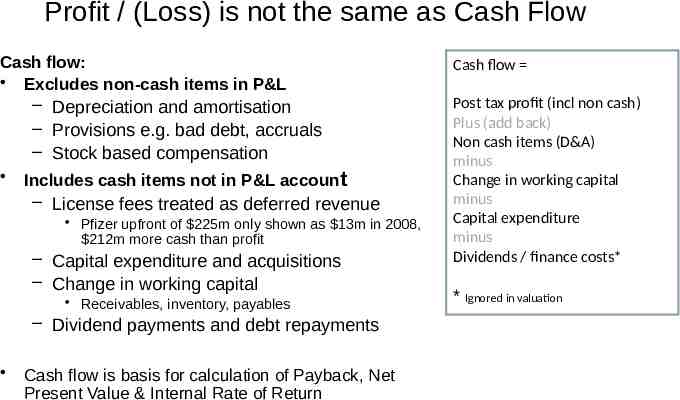
Profit / (Loss) is not the same as Cash Flow Cash flow: Excludes non-cash items in P&L – Depreciation and amortisation – Provisions e.g. bad debt, accruals – Stock based compensation Includes cash items not in P&L account – License fees treated as deferred revenue Pfizer upfront of 225m only shown as 13m in 2008, 212m more cash than profit – Capital expenditure and acquisitions – Change in working capital Receivables, inventory, payables – Dividend payments and debt repayments Cash flow is basis for calculation of Payback, Net Present Value & Internal Rate of Return Cash flow Post tax profit (incl non cash) Plus (add back) Non cash items (D&A) minus Change in working capital minus Capital expenditure minus Dividends / finance costs* * Ignored in valuation
Profit vs Cash Flow Medivation Cash Flow and Income Statement
Learning Objective 2 Undertake a range of calculations to demonstrate the financial strengths and weaknesses of pharmaceutical businesses, to recognise the limitations of such information and to communicate the information in an appropriate manner
Topic 2 - Financial Performance Measures, Working Capital and Cash Flow Financial ratios Working capital management Cash flow
Company Performance Analysis Financial Ratio Analysis is used to assess the strength and weaknesses of companies – As a company – In comparison to its peer group Financial information readily available for public companies Significant differences between large and small pharma companies, generics, OTC and biotech Look at trends, compare ratios to other companies, explain results by reference to the business context
KEY indicators of company performance Profit margins – Gross profit, EBITDA, operating profit margin, post tax profit margin – Return on equity [Profit after tax/Equity], earnings per share [EPS] Solvency – Rate of cash burn - Medivation 75m cash burn, 222m cash 3 years ‘runway’ – Quick asset ratio (current assets – inventory)/current liabilities Efficiency – Return on capital employed [Operating profit/Shareholders Equity] – Working capital ratios: days of receivables, inventory, payables Financial Gearing ratio (Debt / Equity) measures ‘leverage’ Acceptable level of gearing depends on company and sector Large company generating large positive cash flow can have high gearing Why are these ratios important?
Working Capital Cash required to run the business – Current assets: inventory plus receivables (debtors) less – Current liabilities: payables (creditors) Calculated in a financial model as Cash flow Post tax profit (incl non cash) Plus (add back) Non cash items (D&A) minus Change in working capital minus Capital expenditure minus Dividends / finance costs* – Inventory CoGS x days of inventory * Ignored in valuation – Receivables Sales x days of sales outstanding – Payables Other costs (excl. employment) x creditor days taken Difference between working capital balance at start and end of year working capital movement used in cash flow Usually small for patented pharmaceutical products
Working Capital – AstraZeneca 2008 Assets bn Liabilities bn Sales 31.6 Cost of sales incl distribution 6.9 Receivables 7.3 R&D 50% 2.6 Receivables / sales days 84 SG&A 50% 5.5 Tax 2.5 Cost of sales 6.6 Total costs excl. employment 17.5 Inventory 1.6 Payables 7.0 Inventory / cost of sales days 91 Payables / costs days 151 Are these ratios reasonable for a speciality pharmaceutical business? Calculation Receivables: 7.3 / 31.6 x 365 days sales outstanding Inventory: 1.6 / 6.6 x 365 days of inventory Payables : 7.0 / 17.5 (cost of sales 50% (R&D SG&A) tax) x 365 days credit taken
Learning Objective 3 Explain the nature and importance of internal business costs and cost behaviour within a typical pharmaceutical business and construct information relevant for internal decisionmaking in different deal scenarios
Topic 3 – Cost and Management Accounting UNIT 3 : COST AND MANAGEMENT ACCOUNTING . 1 OBJECTIVES . 3 Direct manufacturing costs Overhead allocation and full costing Break even analysis and marginal costing Transfer pricing REQUIRED READING . 4 3.1. INTRODUCTION . 4 3.2. THE COST AND MANAGEMENT ACCOUNTING FUNCTION . 4 3.3. FEATURES OF COST AND MANAGEMENT ACCOUNTING . 4 3.4. COST OBJECTS, COLLECTION AND CLASSIFICATION . 5 3.5. THE MANUFACTURING ACCOUNT . 5 3.5.1 DIRECT COSTS . 6 3.5.2 PRIME COST . 6 3.5.3 MANUFACTURING OVERHEAD. 6 3.5.4 INDIRECT COSTS. 7 3.5.6 OTHER INDIRECT COSTS . 7 3.6. FULL COSTING AND OVERHEAD ABSORPTION . 7 3.6.1 OVERHEAD ALLOCATION AND ABSORPTION EXAMPLE. . 7 3.6.2 A DIFFERENT APPROACH? . 11 3.7. ACTIVITY BASED COSTING .12 3.7.1 COMPARISON WITH TRADITIONAL SYSTEMS . 12 3.7.2 COST DRIVERS . 13 3.8. STOCK VALUATION . 13 3.9. COST BEHAVIOUR . 14 3.9.1 VARIABLE COSTS . 15 3.9.2 FIXED COSTS . 15 3.9.3 OTHER CATEGORIES OF COST. 15 3.9.4 COST BEHAVIOUR – AN EXAMPLE . 16 3.9.5 THE NATURE OF ‘CONTRIBUTION’ AND BREAK-EVEN . 18 3.10. COST, VOLUME, PROFIT ANALYSIS . 18 3.10.1 SIMPLE CASE STUDY . 19 3.10.2 LIMITATIONS OF CVP ANALYSIS . 20 3.11. MARGINAL COSTING AND DECISION MAKING .21 3.11.1 DROPPING A PRODUCT OR SERVICE. 21 3.11.2 MAKE OR BUY DECISIONS . 23 3.11.3 UNDERTAKING ADDITIONAL ACTIVITY . 24 CONSIDER THE FOLLOWING CASE, HALFCAP . 24 3.12. TRANSFER PRICING . 26 3.12.1 AN EXAMPLE FROM THE PHARMACEUTICAL INDUSTRY. 27 3.12.2 ARMS LENGTH METHODS . 27 3.12.3 COMPARABLE UNCONTROLLED PRICE (CUP) . 28 3.12.4 COST PLUS . 28 3.12.5 RESALE PRICE. 29 3.12.6 TRANSACTIONAL PROFIT METHODS. 29 3.12.7 THE EFFECT OF INTERCOMPANY CONSIDERATIONS ON BUSINESS DEVELOPMENT AND LICENSING DEALS . 29 3.13. INTERNATIONAL TRADE TERMS .31 3.14 SUMMARY .33
Understanding Costing Necessary in order to be able to cost and price products under supply agreements, licensing and development agreements (Topic 3, page 2) Full costing (absorption costing) is necessary to understand the total cost of a product including the overheads (Topic 3, page 5)
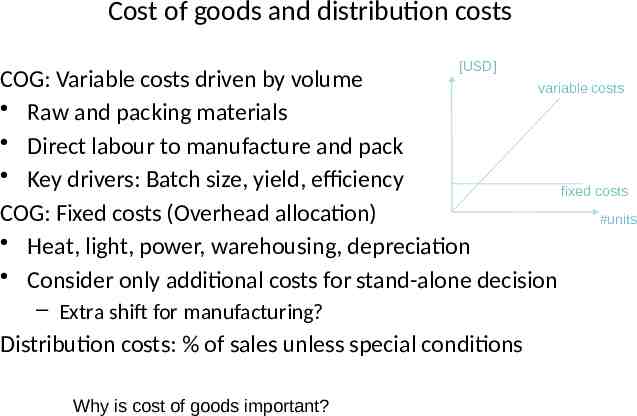
Cost of goods and distribution costs [USD] COG: Variable costs driven by volume variable costs Raw and packing materials Direct labour to manufacture and pack Key drivers: Batch size, yield, efficiency fixed costs COG: Fixed costs (Overhead allocation) #units Heat, light, power, warehousing, depreciation Consider only additional costs for stand-alone decision – Extra shift for manufacturing? Distribution costs: % of sales unless special conditions Why is cost of goods important?
Understanding Costing Marginal costing is important to assist with decision-making where understanding cost behaviour becomes vital (Topic 3 page 18) It is important to understand the relationship between profit mark-up and the margins earned especially in situations where there may be a manufacturer, a wholesaler and a pharmacist (Topic 3 page 9)
Cost of goods and distribution costs Licensee Buys Finished Packs from Licensor (at 2009 Costs) Assumptions 218 Batch size kg API cost per kg Yield Mg per cap Caps per batch Pack size caps Packs per batch 25 15,000.00 90.0% 40 562,500 100 5,625 Batch size kg API cost per kg Yield Mg per cap Caps per batch Pack size caps Packs per batch 50 15,000.00 90.0% 40 1,125,000 100 11,250 Variable costs Cost / pack Cost / pack API 66.67 66.67 Packing materials and excipients 17.00 17.00 Direct labour 17.00 17.00 Total variable costs 100.67 100.67 Fixed costs Fixed costs 1,000 177.78 1,000 88.89 Total variable and fixed costs 278.44 189.56 Shipping and insurance and CMO profit CMO profit 15% 41.77 15% 28.43 Total costs 320.21 217.99 Licensor mark-up 25% 80.05 25% 54.50 Total supply price to licensee 400.26 272.49 Average net selling price per pack 2016 5,020 5,020 COG % net selling price 8.0% 5.4% Assumes annual cost increases affecting direct and indirect costs are offset by savings from improvement in productivity
Learning Objective 4 Contrast the different means by which pharmaceutical business raise their finance and appraise the impact of such finance on the cost of capital of the organisation and its effect on appraisals of company value and deal structures
Topic 4 – Long Term Decision Making Source of finance Present Value Analysis, Discounted Cash Flow, Internal Rate of Return Cost of capital
Sources and Types of Funding Sources Government or NGO grants (part of company operating cash flow) Company cash flow, if positive – Trading, licensing income, royalty monetisation Investors (private and public) - equity Banks - debt Types of funds Company operating cash flow Shares - Ordinary or Preference Loans - Repayment or Convertible Application of funds - Why it important to understand funding? Pay interest and tax Buy assets Fund working capital
Net Present Value (NPV) The objective of NPV is to ensure long-term decisions maximise market value of shareholder wealth (Topic 4, page 11) Long time span between research and marketing in pharma industry so financial decisions must take account of the time value of money (Topic 4, page 13) Money received or expended in the future is worth less than the same amount received or spent today – an earlier receipt of money defers financing costs or an earlier payment increases them Discounted cash flow converts future receipts and payments to present value by using a discounting technique (Topic 4 page 15)
Net Present Value The discounting technique uses the opportunity cost of capital or weighted average cost of capital (WACC) as the discount rate. (Topic 4, page 15) – Company funding derived from debt and equity. If 40% debt at 5.9% interest and 60% equity at 7.7% investor return then WACC 7% discount rate AZ post tax WACC Organisations should not invest in projects which do not yield in excess of the weighted average cost of capital. (Topic 4, page 15) Projects with a significantly positive Net Present Value can be accepted
Learning Objective 5 Demonstrate ability to use a computer spreadsheet to produce financial information using a number of methodologies in order to – Value a business proposal - valuation – Appraise critically the strengths and weaknesses of the information and methodologies used – Assess the impact of risk on the valuation
Topic 5 - Financial Modelling Sales and cost forecasting Cash flow forecasts Discounted cash flow, NPV, IRR, payback Terminal value Sensitivity analysis
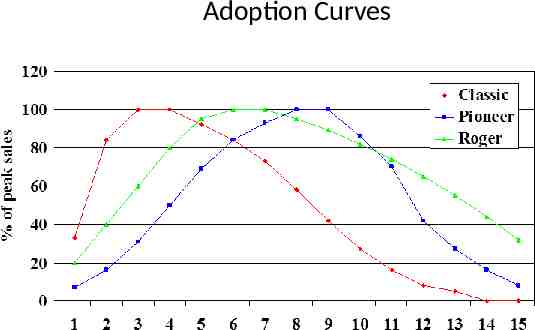
Sales Forecasting Process Top down or bottom up or both Identify appropriate forecast method(s) – Epidemiological – Market based – Historic trend Calculate peak sales – Zipf’s law – Market research intention to Rx, share of voice, health economics – Comparisons to similar products peak sales Identify appropriate product life cycle – Adoption curve to peak sales – Sales trend post peak sales
Market Share Drivers - Xtandi Number of competitors and timing of entrant – Zipf’s Law Competitive advantage versus competitor (Zytiga) – Improved clinical or safety outcomes / intention to prescribe Price levels and health economic benefits - market access – Pricing acceptable to payers Share of voice versus competitors – Target audience salesforce calls and marketing spend
Adoption Curves
Operating Costs Develop forecasts for each cost element: Cost of goods, distribution, royalties payable Sales and Marketing R&D and regulatory Medical and pharmacovigilance Administration, finance and other Amortisation and depreciation Interest (ignore) Tax (include if possible)
Project P&L excluding deal terms
NPV Formula Cash flow is discounted at discount rate or WACC (weighted average cost of capital) DCF CFn (1 R)n – CF cash flow – R discount rate – n year NPV Σ0n CFn (1 R)n Internal rate of return is the discount rate where NPV 0
Project Discounted Cash Flow excluding deal terms PROJECT P&L AND CASH FLOW Years from first launch Years from signature Total sales m Sales Costs of goods sold Cost of goods COG Distribution (% sales) 3% Gross profit Royalties payable (University) 4.0% R&D R&D Sales and Marketing S&M General & Administration 0% Total operating expenses Operating income / (loss) EBITDA Depreciation & amortisation Tax 30% Post tax profit Depreciation & amortisation Working capital movement Capital expenditure on manufacture Cash flow Payback Cumulative undiscounted cash flow Years from signature NPV of project excl sunk costs Cash flow Discount factor 8% Discounted cash Sum discounted cash m Excel formula calc m Internal rate of return 0 2009 1 2010 2 2011 19 19 (19) 57 57 (57) 86 86 (86) (6) (13) (17) (40) (26) (60) 5 (13) (35) 2 (30) (88) (13) 4 (48) (136) 1 3 2012 3 5 2014 5 7 2016 1,900 2,491 3,066 3,635 4,138 4,651 Terminal value x sales 2022 5.3 4,973 26,354 6 8 2017 7 9 2018 8 10 2019 9 11 2020 10 12 2021 447 2 2 67 3 110 65 178 (110) 3 (34) (79) 3 1 12 13 422 18 118 213 348 73 3 21 49 3 (20) 39 32 990 42 140 421 604 387 3 115 269 3 (36) 72 57 1,771 76 135 569 780 990 3 296 691 3 (63) 96 75 2,320 100 85 569 753 1,567 3 469 1,095 3 (57) 119 92 2,854 123 54 560 737 2,117 3 634 1,480 3 (54) 141 109 3,385 145 37 560 743 2,643 3 792 1,848 3 (52) 161 124 3,852 166 20 560 745 3,107 3 931 2,173 3 (46) 181 140 4,330 186 20 560 766 3,564 3 1,068 2,493 3 (46) 193 149 4,630 199 20 560 779 3,851 3 1,154 2,694 3 (28) (75) 33 235 631 1,041 1,429 1,799 2,130 2,450 2,668 18,448 (211) (178) 57 688 1,730 3,158 4,957 7,087 9,537 12,205 18,448 235 631 1,041 0.68 0.63 0.58 160 398 607 5,778 to 2020 excl TV 5,778 to 2020 excl TV 1,429 0.54 772 1,799 0.50 900 33 0.74 24 1,061 4 6 2015 71 (13) (35) (88) (75) 1.00 0.93 0.86 0.79 (13) (32) (75) (60) 12,561 to 2021 incl terminal value 12,561 to 2021 incl terminal value 88% 2 4 2013 2,130 2,450 0.46 0.43 986 1,051 Terminal value Terminal value % of total 2,668 0.40 1,060 6,783 54% 26,354 26,354 7,906 18,448 18,448 0.37 6,783
Learning Objective 6 To develop an understanding of the application of valuation methods in various types of deals and the assessment and management of risk including: – Valuation methods and the advantages and disadvantages of each method; – The assessment of risk and how it can be managed both internally and externally; – How different deal terms can be used to manage risk; – The importance of different financial terms in various types of deals; – How legal drafting can affect the financial deal terms
Topic 6 - Valuation Methods and Management of Risk Overview of valuation methods Project risk assessment and management Financial deal terms Valuation and risk in different types of deals Financial aspects in legal agreements
Valuation Methods Market Comparables / benchmarks Rules of thumb Financial Companies: Market cap Cost Income Multiples Net book value Non-discounted cash flow Discounted cash flow 25% rule Cost incurred Accounting rate of return NPV and IRR Replacement cost Payback eNPV Decision Trees Monte Carlo analysis Real Options Payback can also be calculated using DCF
Benchmark Deal Terms
Financial Valuation and Deal Terms Each party Calculates target share of project NPV Splits NPV between – Upfront, development and sales milestones – R&D costs payable to other side and royalty on sales Calculates NPV for themselves and for other party Starts negotiation – Aligns expectations Product potential peak sales, benchmark deal headline value, NPV share – Negotiates specific financial terms
Financial Analysis of Deal Value for Each Party
Licensee Share of NPV
Risk Analysis Hurdle Rates Multiple Scenarios Probability Adjustments – Simple probability of success/failure at each development phase – Decision tree analysis Black box methods Monte Carlo simulation Real Options Valuation
Managing Risk Governance – Project management, dispute mechanism Deal terms pre signature negotiated to share risk – Milestones linked to performance Payments by indication by territory – Milestones and royalty linked to sales 4 tiers of sales – Profit sharing arrangements e.g. co-commercialisation Post signature re-negotiation of deal terms – 5 amendments of UCLA/Medivation, 2 of Medivation/Astellas
Risks for Medivation and Astellas? Medivation Astellas
Risks for Medivation and Astellas Medivation Astellas Product fails in development Product registered but limited indication Competition Astellas fails to promote IP challenge Product fails in development Product registered but limited indication Competition Medivation fails to promote in US IP challenge Cost of manufacture higher than plan Medivation insolvent Astellas terminates
Management of Risks for Medivation Risks Mitigation Product fails in development Product registered but limited indication Competition Astellas fails to promote IP challenge Astellas terminates High upfront and early milestones Manage governance (committees) Astellas non compete Absolute obligations so in breach Astellas to step in Return of rights and data free
Management of Risks for Astellas Risks Mitigation Product fails in development Low upfront, late milestones, more royalties Reduce promotion Product registered but limited indication Competition Medivation fails to promote in US IP challenge Cost of manufacture than plan Medivation insolvent Medivation non compete Royalty reduced Reduction in profit share Astellas step in but M help Takeover manufacture US law with legal protection
Financial Deal Terms in the Legal agreement What issues arise? Definition of net sales and profit (for profit share) – Net sales - free goods, rebates, bundling, combinations – Profit – costs to be charged Governance and decision making – Dispute procedure Reporting and right to audit – Development and market activity and royalties Hardship or Insolvency – Ownership of IP Termination – Both, Medivation, Astellas right to terminate
Any Questions?
Formal Assignment Objective The objective of this assignment is to test the student’s understanding of the concepts and information presented in this Unit and to verify that the learning objectives have been achieved. The formal assignment requires the student to research, analyse and report on a real-life licensing example using the knowledge gained from the Unit
Formal Assignment Requirements The assignment requires the student to: Use the knowledge gained from Topic 1 to obtain and analyse the financial information of two companies, one is a large pharmaceutical company and the other is a small development company. Use the knowledge gained from Topic 2 to evaluate and explain the financial strengths and weaknesses of each company Build a financial model of the deal agreed between the two companies using the techniques described in Topic 5 with the revenue, cost and cash flow elements described in Topics 3 and 4. Undertake a number of financial valuations of the project using the techniques described in Topic 6, suggest some financial deal terms and compare them to the actual terms and finally explain, by reference to the actual agreement, how each side sought to manage risk through the deal terms. Ref Unit 3 Formal assignment
Formal Assignment Deliverable 6,000 word report plus supporting Excel spreadsheet consisting of: – The strategy of each company and why the deal was of interest – The financial structure and status of each company at the date of the deal – The product and potential indications, the product advantages and market opportunity – The structure and content of the deal particularly financial terms and the accounting treatment in the biotech company – A spreadsheet for each company (including the deal terms) showing forecast profit and loss, cash flow and valuations (NPV, IRR and payback) – A conclusion, suggesting some deal terms compared to the actual terms and how each company sought to manage risk through the deal terms
Formal Assignment Licensing Deal GPC Biotech and Pharmion 22 December 2005 Pharmion licensed exclusive rights to satraplatin for Europe, Middle East and Australasia All information on website and in public domain If any data not available provide your own estimates with reasons If you get stuck contact the tutors
Formal Assignment Process Obtain information from various sources and read and analyse the data Develop the spreadsheet, fill in any gaps with your own estimates (explain the source and justify where relevant) – Note: If students prefer they can use the structure of the spreadsheet ‘Topic 5 Example Spreadsheet’ on the website. Write the report (6,000 words) Send the report and spreadsheet to the PIAT office Following assessment, students will be notified of the result Assessment procedures are described in the Course Handbook
Information (most on website) Company financial information (SEC, company website) Agreements relating to the deal (SEC) Press releases relating to the deal (co. website) Brokers reports relating to the companies (if available) Financial terms of comparable deals (if available) Epidemiological, market and pricing data relating to the product and its indications (various sources) Estimates of development, regulatory, supply and commercialisation costs (various sources)
Formal Assignment First Thoughts The strategy of each company and why the deal was of interest? GPC Biotech partnering strategy? License out now or later? And who to? Pharmion strategy?
Formal Assignment First Thoughts The financial structure and status of each company at the date of the deal GPC Biotech need short term cash? Ability to raise more cash in future? Pharmion financial issues, if any?
Formal Assignment First Thoughts The product and potential indications, the product advantages and market opportunity Lead indication? Size of opportunity? Additional indications? Size of opportunity? Product advantages versus competitor products?
Formal Assignment First Thoughts The structure and content of the deal particularly financial terms and the accounting treatment in the biotech company GPC Biotech impact on cash and profit (accounting treatment) and on share price? Pharmion impact on profit and cash and share price?
Formal Assignment First Thoughts A spreadsheet showing for each company (including the deal terms) forecast profit and loss, cash flow and valuations (NPV, IRR and payback) Sales forecast methodology? Development costs and timing? Marketing resources needed? Profits and cash flow for each company?
Formal Assignment First Thoughts A conclusion, suggesting some deal terms compared to the actual terms and how each company sought to manage risk through the deal terms GPC Biotech and Pharmion share of NPV? GPC Biotech and Pharmion share of risk? What are reasonable deal terms compared to other similar deals?
Before starting the formal assignment, it is important to check with the tutors that you have understood the question and if possible send the tutors in advance an outline of the assignment answer