Microsoft Analytics Platform System 02


48 Slides4.60 MB
Microsoft Analytics Platform System 02 – Hardware/Software Architecture Brian Walker Microsoft Architect – Data Insights COE Jesse Fountain Microsoft WW TSP Lead 5/14/23 Click to edit Master subtitle style
Agenda SMP and MPP differences What is APS? APS hardware components High availability PDW region overview PDW tools of the trade
Differences between SMP and MPP
SQL upgrade prospect scenario: SQL Server 2014 or APS SQL Server customers with scale and performance needs have a choice to make Customer Application SQL 2014 Step 1: Upgrade Customer Application SQL 2008 R2 Start Here Step 2: Optimize Effects All Systems. Total Upgrade. Upgrade 2 releases greater Infrastructure Re-Architecture Replace/Upgrade SAN Regression Testing Solution? New H/W & back to Step1 New Requirements: More Business, More Growth ! Re-optimization is required for new version Re-Optimization required Unknown maintenance & cost requirements Unknown gain in performance Heavy testing and thought required Customer Application APS Step 1: Migrate Migrate once. Quickly deliver value Pre-Optimized Infrastructure Best Practice Configuration Built-In Automatic Data Distribution & Placement Migrate once and upgrades are managed New Requirements? Solution? Add Capacity Push-Button Upgrade Automatic Data Distribution Infrastructure Optimized Data Center Rack Optimized
Data warehousing comparison: SMP vs. MPP Data Volume Mixed Workload 5 PB Strategic, Tactical Loads, SLA Strategic, Tactical 10.000 10 TB Ad Hoc Queries Data Analysis/Mining 1.000 100 Query complexity 3-5 Way Joins Weekly Load Batch Reporting, Repetitive Queries SMP – Tunable in one dimension at cost of other dimensions 50 TB Strategic Near Real Time Daily Data Feeds Load APS – Multi-dimensonal Scalability 100 TB Strategic, Tactical Loads Data Freshness Query Concurrency 500 TB 5-10 Way Joins Simple Star Multiple, MB’s Integrated Stars Joins OLAP operations Aggregation Complex “Where” constraints Views Parallelism Normalized GB’s Multiple, Integrated Stars and Normalized Query Freedom TB’s Query Data Volume Schema Sophistication The spiderweb depicts important attributes to consider when evaluating Data Warehousing options. Big Data support is newest dimension.
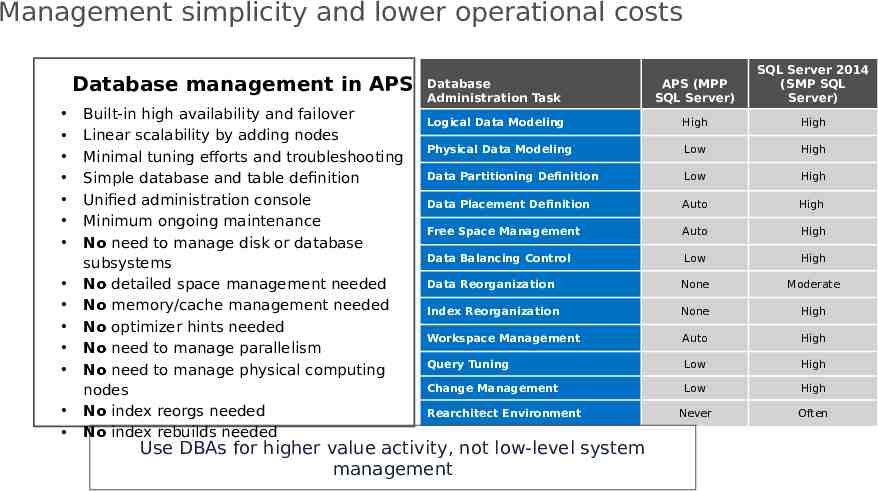
Management simplicity and lower operational costs Database management in APS Built-in high availability and failover Linear scalability by adding nodes Minimal tuning efforts and troubleshooting Simple database and table definition Unified administration console Minimum ongoing maintenance No need to manage disk or database subsystems No detailed space management needed No memory/cache management needed No optimizer hints needed No need to manage parallelism No need to manage physical computing nodes No index reorgs needed No index rebuilds needed Database Administration Task APS (MPP SQL Server) SQL Server 2014 (SMP SQL Server) Logical Data Modeling High High Physical Data Modeling Low High Data Partitioning Definition Low High Data Placement Definition Auto High Free Space Management Auto High Data Balancing Control Low High Data Reorganization None Moderate Index Reorganization None High Workspace Management Auto High Query Tuning Low High Change Management Low High Never Often Rearchitect Environment Use DBAs for higher value activity, not low-level system management
What is APS?
Microsoft Analytics Platform System High-Performance Analytics MPP: Powerful: Massively Parallel Processing (MPP) Engine Mature: Parallel Cost-Based Optimizer from SQL Server Dedicated: Direct-attached high-speed servers and storage Insight on All Data POLYBASE-SQL: easy-access to both relational and Hadoop data Near Real-Time: Access multiple data sources quickly Shared-Nothing: allow linear scalability to store all Low-Cost, Rapid Value historical data Appliance: System is pre-configured at factory Industry Standard: Co-engineered with HP/Dell/Quanta Automatic Compression: 5X-15X with Columnar
The foundation for data warehousing and advanced analytics Combines Hardware & Software to provide a turn-key, balanced platform specific to data warehouse & analytical workloads Built for easy scale-out as Data Warehouse capacity requirements grow Deep, native integration with Hadoop High Performance & Concurrent Data Warehouse Workloads for simultaneous data Loading & Query Built-in Development Engineering Best Practices Integrated Systems Monitoring & Management
New features come first to APS Updateable Column Store Agnostic Hadoop Integration via Polybase Cardinality Estimation Cost-Based Distributed SQL Query Engine Hub and Spoke Architecture Support Analytical Functions (e.g. Lag and Lead) Incremental functional releases each year
APS hardware components
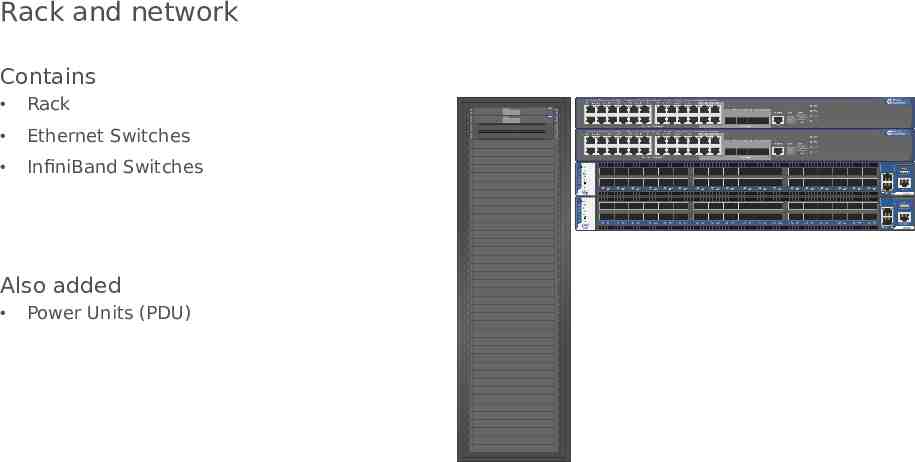
Rack and network Contains Rack Ethernet Switches InfiniBand Switches Also added Power Units (PDU)
PDW Base Scale Unit Contains Orchestration Host Passive Host Optional Passive Host Data Scale Unit
Hadoop Base Scale Unit Contains Rack & Network PDW Base Scale Unit Orchestration Host Passive Host Data Scale Unit
Data Scale Unit Servers “active” in WFC Unit of growth Used by both regions Varies in size By Vendor By Appliance Size Uses Existing Switches
HP configuration Infiniband Infiniband Ethernet Ethernet Control Node Failover Node Reserved Compute Node 7 Compute Node 8 JBOD 4 Compute Node 5 Compute Node 6 3 Rack 181.2TB (Raw) 1¼ Rack JBOD 1 ¼ Rack Compute Node 1 Compute Node 2 2 Rack 1 1/2 Rack 75.5TB 90.6TB (Raw) (Raw) 120.8TB (Raw) JBOD 2 Compute Compute 15 Scale UnitNode (7U):23 Scale Unit (7U): Scale UnitNode (7U): Compute Node 24 Compute Node 16 2 HP 1U Servers 2 HP 1U Servers 2 HP 1U Servers (16 Cores/Ea. Total: 32) (16 Cores/Ea. Total: 32) (16 Cores/Ea. Total: 32) JBOD 5U JBODJBOD JBOD 5U 5U 8 JBOD 12 1TB Drives 1TB Drives 1TB Drives User Data Capacity: 75TB User Data Capacity: 75TB User Data Capacity: 75TB Compute Node 21 Compute Node 13 Scale Unit (7U): Scale Unit (7U): Scale Unit (7U): Compute Node 22 14 2 HP 1U Servers 2 HP 1U Servers Compute 2 HP 1U Node Servers (16 Cores/Ea. Total: 32) (16 Cores/Ea. Total: 32) (16 Cores/Ea. Total: 32) JBOD 5U JBODJBOD JBOD 5U 5U 7 JBOD 11 1TB Drives 1TB Drives 1TB Drives User Data Capacity: 75TB User Data Capacity: 75TB User Data Capacity: 75TB Compute Compute 11 Scale UnitNode (7U):19 Scale Unit (7U): Scale UnitNode (7U): Compute Node 20 12 2 HP 1U Servers 2 HP 1U Servers Compute 2 HP 1U Node Servers (16 Cores/Ea. Total: 32) (16 Cores/Ea. Total: 32) (16 Cores/Ea. Total: 32) JBOD 5U JBODJBOD JBOD 5U 5U 6 JBOD 10 1TB Drives 1TB Drives 1TB Drives User Data Capacity: 75TB User Data Capacity: 75TB User Data Capacity: 75TB Compute Node 17 Compute Node 9 Extension Base Unit (7U): Extension Base Unit (7U): Base Unit (7U): Compute Node 18 Node 10 2 HP 1U Servers 2 HP 1U Servers Compute 2 HP 1U Servers (16 Cores/Ea. Total: 32) (16 Cores/Ea. Total: 32) (16 Cores/Ea. Total: 32) JBOD JBOD 5U 9 JBOD 5U JBODJBOD 5U 5 1TB Drives 1TB Drives 1TB Drives User Data Capacity: 75TB User Data Capacity: 75TB User Data Capacity: 75TB Full Rack Compute Node 3 Compute Node 4 Details Customer Space (9U) Customer Space (8U) ETL Servers ETL Reserved Reserved Space (9U) Reserved Servers Backup Servers Backup Servers Passive Unit (Additional spares) Passive Unit (Additional spares) 1/2 Rack 15TB 60TB (Raw) 30TB (Raw) (Raw) JBOD 3 Infiniband Base Infiniband Unit (6U): Extension Base Unit (5U): Extension Base Unit (5U): Infiniband InfinibandInfiniband Redundant Redundant Infiniband Redundant Infiniband EthernetEthernet Redundant Ethernet EthernetEthernet Redundant Redundant Ethernet Mgmt & Control (Active) Rack Failover Node (Passive) RackEthernet Failover Node (Passive) Failover Node Failover Node Rack Failover Node (Passive) 2 – 56 compute nodes 1 – 7 racks 1, 2, or 3 TB drives 15.1 – 1268.4 TB raw 53 – 6342 TB User data Up to 7 spare nodes available across the entire appliance
Dell and Quanta configuration Infiniband Infiniband Ethernet Ethernet Control Node Failover Node PDW Backplane (6U): Redundant Infiniband Redundant Ethernet Mgmt & Control (Active) Rack Failover Node (Passive) Reserved (6U) Reserved Compute Node 7 Compute Node 8 Compute Node 9 JBOD 5 JBOD 6 JBOD 4 JBOD JBOD 2 1 1 2 1 3 2 3 Base Unit (10U): 3 Servers in 2U enclosure (16 Cores/Ea. Total: 48) 2 JBOD 4U ea. 1TB Drives User Data Capacity: 79TB Base Unit (10U): 3 Servers in 2U enclosure (16 Cores/Ea. Total: 48) 2 JBOD 4U ea. 1TB Drives User Data Capacity: 79TB Full Rack 2/3 Rack JBOD 3 Base Unit (10U): 3 Servers in 2U enclosure (16 Cores/Ea. Total: 48) 2 JBOD 4U ea. 1TB Drives User Data Capacity: 79TB 1/3 Rack 67.9TB (Raw) 45.3TB (Raw) 22.6TB (Raw) Compute Node 4 Compute Node 5 Compute Node 6 Compute Node Compute Node Compute Node Compute Node Compute Node Compute Node JBOD 1 JBOD 2 Details 2 – 54 compute nodes 1 – 6 racks 1, 2, or 3 TB drives 22.65 – 1223.1 TB raw 79 – 6116 TB User data Up to 6 spare nodes available across the entire appliance
High availability
Failover in Action: Control host failure HST01 node marked as failed (AD02 Persists on HST02) CTL01 AD01 VMM HST01 Cluster fails over to HST02 CTL01 AD02 VMM HST02 HST02 already “warm” so Failover is very Fast WFOHST01 CMP01 CMP02 CMP03 CMP04 CMP05 CMP06 ISCSI0 1 ISCSI0 2 ISCSI0 3 ISCSI0 4 ISCSI0 5 ISCSI0 6 HSA01 DAS01 HSA02 HSA03 DAS02 HSA04 HSA05 DAS03 HSA06
Failover in Action: Compute node failure Compute node marked as failed PDW Cluster restarts compute node on a passive server ISCSI VM does not fail over WFOHST01 CTL01 AD01 VMM CMP01 CMP01 CMP02 CMP03 CMP04 CMP05 CMP06 HST01 HST02 ISCSI0 1 ISCSI0 2 ISCSI0 3 ISCSI0 4 ISCSI0 5 ISCSI0 6 HSA01 DAS01 HSA02 HSA03 DAS02 HSA04 HSA05 DAS03 HSA06
APS disk layout: LUNs and filegroups/files Design Details Each LUN is composed of 2 drives in RAID1 mirroring configuration Distributions are now split into 2 files TempDB and Log are across all 16 LUNs No fixed TempDB or log size allocation VHDXs are on JBODs to ensure high availability Disk I/O further parallelized relative to V1: bandwidth to increase by 70% in V2 RTM Disk 1 Disk 2 Node 1: Distribution A – file 1 Disk 3 Disk 4 Node 1: Distribution A – file 2 Disk 5 Disk 6 Node 1: Distribution B – file 1 Disk 7 Disk 8 . . . Node 1: Distribution B – file 2 . . . . . . Disk 29 Disk 30 Node 1: Distribution H – file 1 Disk 31 Disk 32 Node 1: Distribution H – file 2 Disk 33 Disk 34 Node 2: Distribution A – file 1 Disk 35 Disk 36 Node 2: Distribution A – file 1 . . . . . . . . . Disk 65 Disk 66 Disk 67 Disk 68 Disk 69 Disk 70 . . . . . . Fabric storage (VHDXs for node) Hot spares JBOD Temp DB Log Temp DB Log
Hadoop region HA Head/Controlling Nodes behave exactly the same as for PDW Data Nodes are different APS relies on Hadoop data replication for data availability Disks are not Mirrored Data Nodes do not failover Replication Factor is configurable #Scale Units Replicati Polybase on Factor 1 2 3 1 3 3
PDW region overview
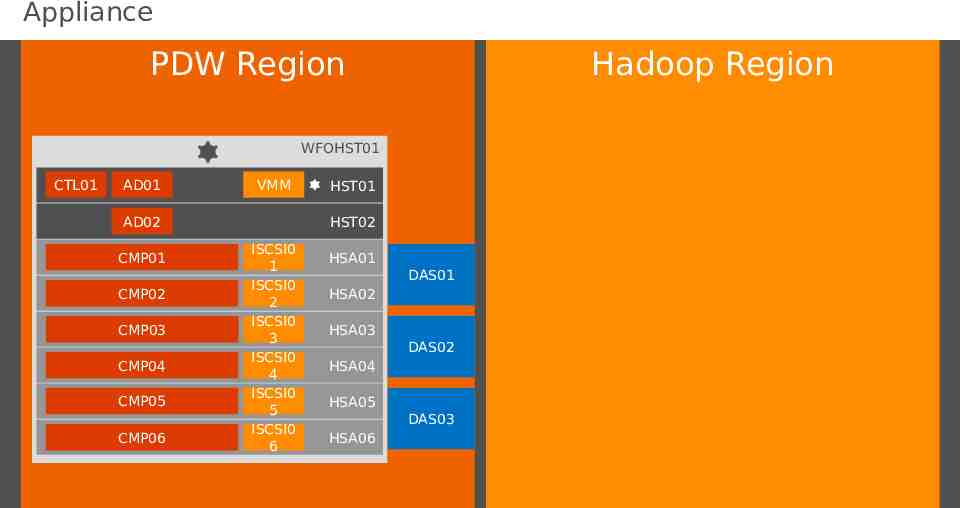
Appliance PDW Region Hadoop Region WFOHST01 CTL01 AD01 VMM AD02 CMP01 CMP02 CMP03 CMP04 CMP05 CMP06 HST01 HST02 ISCSI0 1 ISCSI0 2 ISCSI0 3 ISCSI0 4 ISCSI0 5 ISCSI0 6 HSA01 DAS01 HSA02 HSA03 DAS02 HSA04 HSA05 DAS03 HSA06
PDW region nodes PDW Nodes Control Compute ( 1) WFOHST01 CTL01 AD01 VMM AD02 CMP01 CMP02 CMP03 CMP04 CMP05 CMP06 HST01 HST02 ISCSI0 1 ISCSI0 2 ISCSI0 3 ISCSI0 4 ISCSI0 5 ISCSI0 6 HSA01 DAS01 HSA02 HSA03 DAS02 HSA04 HSA05 DAS03 HSA06 Infrastructure Nodes Virtual Machine Manager Fabric Active Directory
Control and Compute workload nodes Control Node Compute Node Compute Node Compute Node 0110101010101 0101011010101 1101010101011 011010010 0110101010101 0101011010101 1101010101011 011010010 0110101010101 0101011010101 1101010101011 011010010 Compute Node Compute Node Compute Node 0110101010101 0101011010101 1101010101011 011010010 0110101010101 0101011010101 1101010101011 011010010 0110101010101 0101011010101 1101010101011 011010010
Services inside the Control node PDW Services Responsibilities PDW Engine Parse SQL / Syntax Check DMS Core Validate & Authorize PDW Agent Generate D-SQL Plan SQL Server Orchestrate D-SQL Plan Admin Console (IIS) Collate Diagnostic Info Admin Console Web App
Services inside the Compute node PDW Services Responsibilities DMS Core Hold User Data PDW Agent Process Queries SQL Server Move Data Load Data
Virtual Machine Manager (VMM) Deployment of Virtual Machines Configuration of Virtual Machines Hosts Windows Update Services (WSUS) Sits in the Fabric domain
PDW tools of the trade
Tools of the trade PDW Development Management SSDT (Visual Studio) Management Console SQLCMD dwconfig.exe SSIS / SSAS / SSRS pav.exe Power BI PowerShell SSIS adapters System Center dwloader.exe
Tool distribution with PDW Location Download http:// www.microsoft.com/en-us/download/ details.aspx?id 45294 Tools Distributed SSIS Destinations Clienttools.msi dwloader Adventureworks Help File
Connecting to PDW Management Console https://Control Node IP Address/ Development tools TCP Port 17001 Security Connecting from SQL 2012? Connecting from SQL 2008 R2? Use SNAC 11 Use SNAC 10
SQL Server Data Tools (SSDT) SQL Server Data Tools Used for writing queries against PDW SSMS is not a supported tool SSDT for PDW part of standard SSDT deployment model
SQL Server Integration Services Destination Adapters available for SSIS 2008R2 SSIS 2012 SSIS 2014
BI solution development Power Query Power Pivot Power Map Power View SQL Server Analysis Services ROLAP Facts MOLAP Dimensions SQL Server Reporting Services
SQLCMD support .\Microsoft SQL Server\110\Tools\Binn\ SNAC 10 2008 R2 SNAC 11 for 2012 QUOTED IDENTIFIER ON Mandatory Must be set at SQLCMD Invocation SQLCMD.exe -I
Third-party tools Attunity Replicate PDW Region supported target http://www.attunity.com/solutions/data-wa rehousing/microsoft-pdw MicroDesigner (MicroERD) Data Modelling tool http://microerd.com/
PDW region configuration
Region must be restarted once reset
Management & monitoring
Management console Read-Only View of Management Information Can cancel User Sessions, Queries, Loads Can easily visualize DSQL structures Requires View Server State All data accessible via DMVs
Demo Admin Console
2014 Microsoft Corporation. All rights reserved. Microsoft, Windows, Windows Vista and other product names are or may be registered trademarks and/or trademarks in the U.S. and/or other countries. The information herein is for informational purposes only and represents the current view of Microsoft Corporation as of the date of this presentation. Because Microsoft must respond to changing market conditions, it should not be interpreted to be a commitment on the part of Microsoft, and Microsoft cannot guarantee the accuracy of any information provided after the date of this presentation. MICROSOFT MAKES NO WARRANTIES, EXPRESS, IMPLIED OR STATUTORY, AS TO THE INFORMATION IN THIS PRESENTATION.