Introduction to Marketing Analytics


32 Slides489.37 KB
Introduction to Marketing Analytics
Introduction to Marketing Analytics Outline The new realities of marketing decision making Marketing Engineering (ME) The role of models in ME Allegro exercise
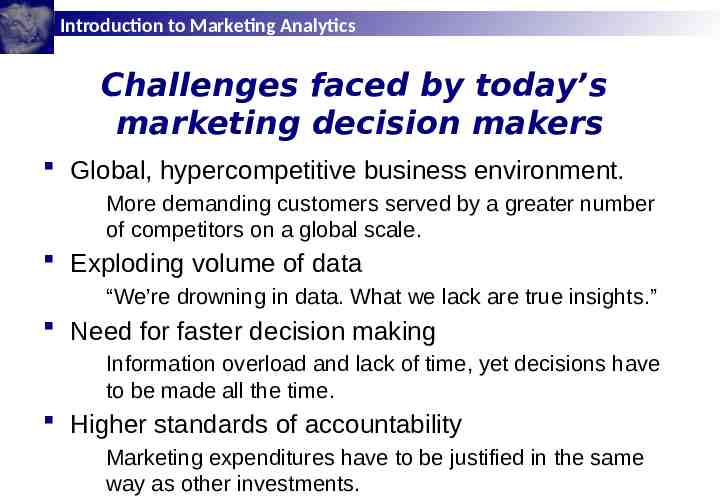
Introduction to Marketing Analytics Challenges faced by today’s marketing decision makers Global, hypercompetitive business environment. More demanding customers served by a greater number of competitors on a global scale. Exploding volume of data “We’re drowning in data. What we lack are true insights.” Need for faster decision making Information overload and lack of time, yet decisions have to be made all the time. Higher standards of accountability Marketing expenditures have to be justified in the same way as other investments.
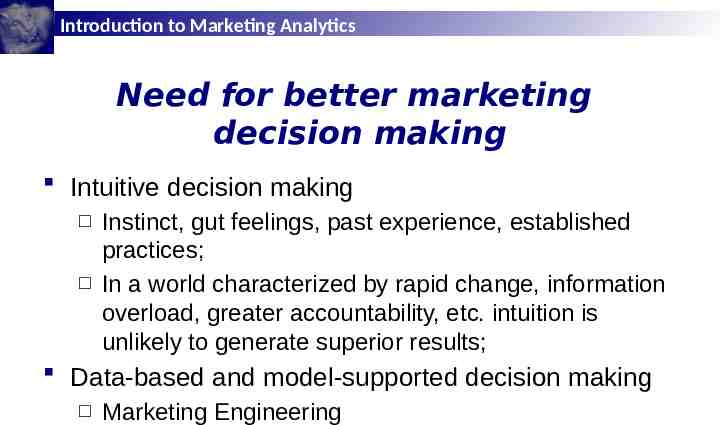
Introduction to Marketing Analytics Need for better marketing decision making Intuitive decision making Instinct, gut feelings, past experience, established practices; In a world characterized by rapid change, information overload, greater accountability, etc. intuition is unlikely to generate superior results; Data-based and model-supported decision making Marketing Engineering
Introduction to Marketing Analytics Marketing Engineering (ME) “a systematic approach to harness data and knowledge to drive effective marketing decision making and implementation through a technologyenabled and model-supported interactive decision process.” (LRB, p. 2).
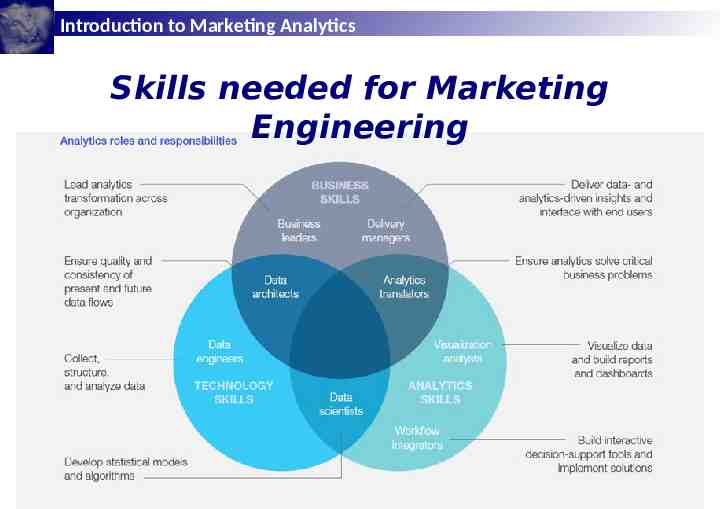
Introduction to Marketing Analytics Skills needed for Marketing Engineering
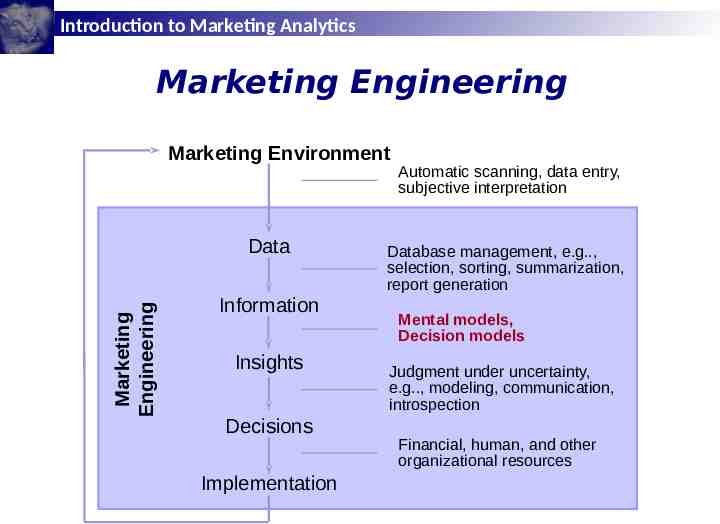
Introduction to Marketing Analytics Marketing Engineering Marketing Environment Marketing Engineering Data Information Insights Decisions Implementation Automatic scanning, data entry, subjective interpretation Database management, e.g., selection, sorting, summarization, report generation Mental models, Decision models Judgment under uncertainty, e.g., modeling, communication, introspection Financial, human, and other organizational resources
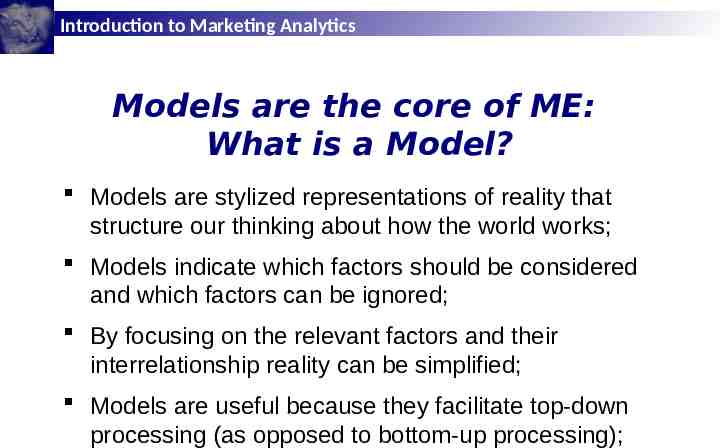
Introduction to Marketing Analytics Models are the core of ME: What is a Model? Models are stylized representations of reality that structure our thinking about how the world works; Models indicate which factors should be considered and which factors can be ignored; By focusing on the relevant factors and their interrelationship reality can be simplified; Models are useful because they facilitate top-down processing (as opposed to bottom-up processing);
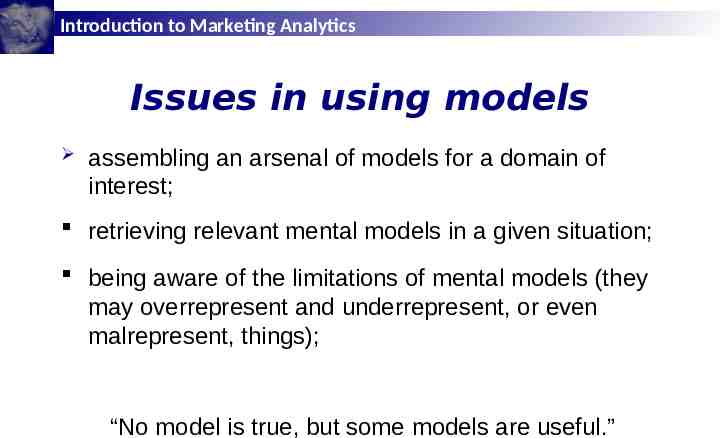
Introduction to Marketing Analytics Issues in using models assembling an arsenal of models for a domain of interest; retrieving relevant mental models in a given situation; being aware of the limitations of mental models (they may overrepresent and underrepresent, or even malrepresent, things); “No model is true, but some models are useful.”
Introduction to Marketing Analytics Types of models Verbal Verbal “Sales “Salesare areaa function functionofof advertising” advertising” Box Boxand andArrow Arrow Graphical Graphical Mathematical Mathematical sales SS aa bbAA ee Advertising Sales advertising
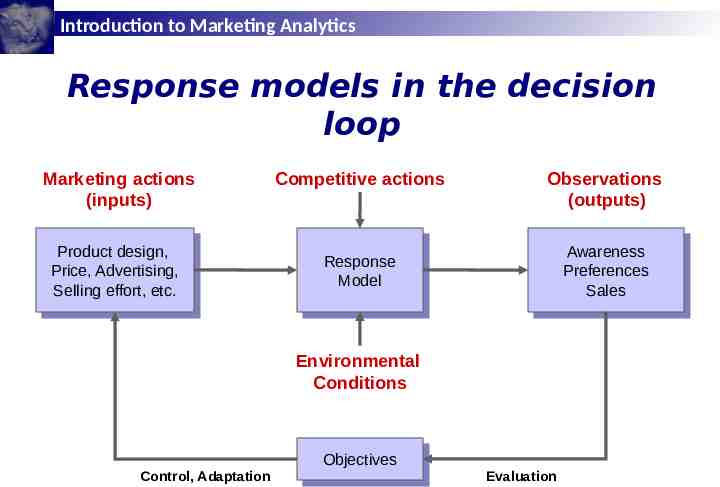
Introduction to Marketing Analytics Response models in the decision loop Marketing actions (inputs) Product Productdesign, design, Price, Price,Advertising, Advertising, Selling Sellingeffort, effort,etc. etc. Competitive actions Observations (outputs) Awareness Awareness Preferences Preferences Sales Sales Response Response Model Model Environmental Conditions Control, Adaptation Objectives Objectives Evaluation
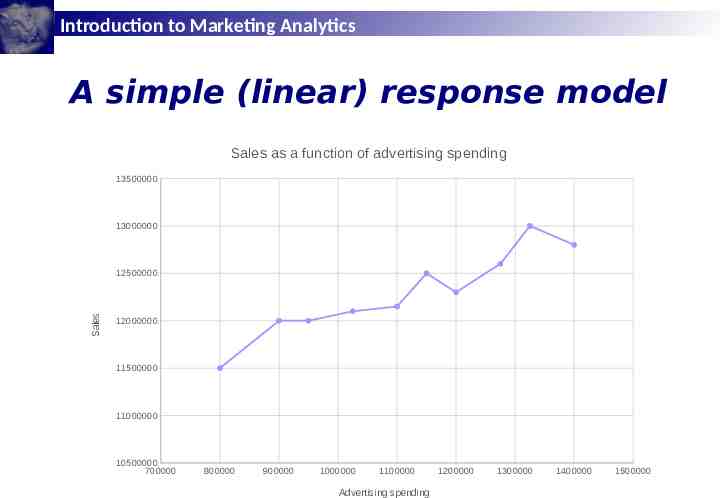
Introduction to Marketing Analytics A simple (linear) response model Sales as a function of advertising spending 13500000 13000000 Sales 12500000 12000000 11500000 11000000 10500000 700000 800000 900000 1000000 1100000 Advertising spending 1200000 1300000 1400000 1500000
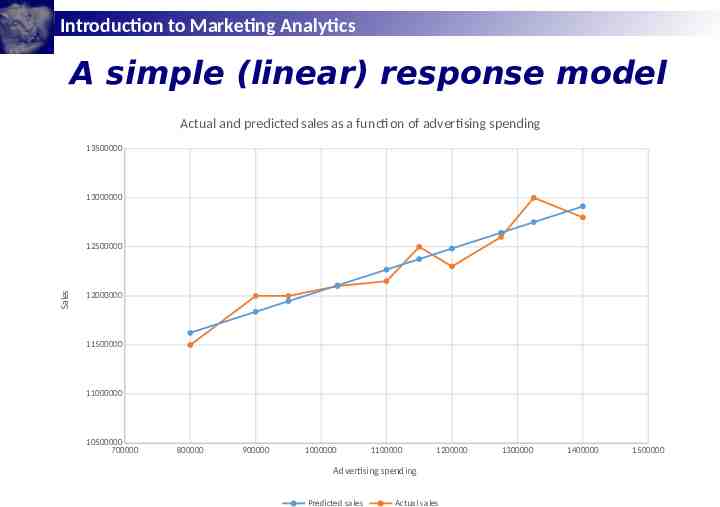
Introduction to Marketing Analytics A simple (linear) response model Actual and predicted sales as a function of advertising spending 13500000 13000000 Sales 12500000 12000000 11500000 11000000 10500000 700000 800000 900000 1000000 1100000 1200000 Advertising spending Predicted sales Actual sales 1300000 1400000 1500000
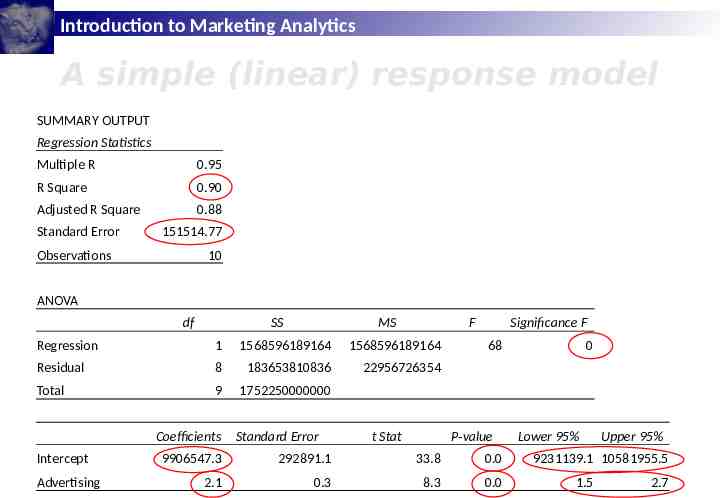
Introduction to Marketing Analytics A simple (linear) response model SUMMARY OUTPUT Regression Statistics Multiple R 0.95 R Square 0.90 Adjusted R Square 0.88 Standard Error 151514.77 Observations 10 ANOVA df SS MS F Regression 1 1568596189164 1568596189164 Residual 8 183653810836 22956726354 Total 9 1752250000000 Coefficients Intercept Advertising Standard Error t Stat Significance F 68 P-value 9906547.3 292891.1 33.8 0.0 2.1 0.3 8.3 0.0 0 Lower 95% Upper 95% 9231139.1 10581955.5 1.5 2.7
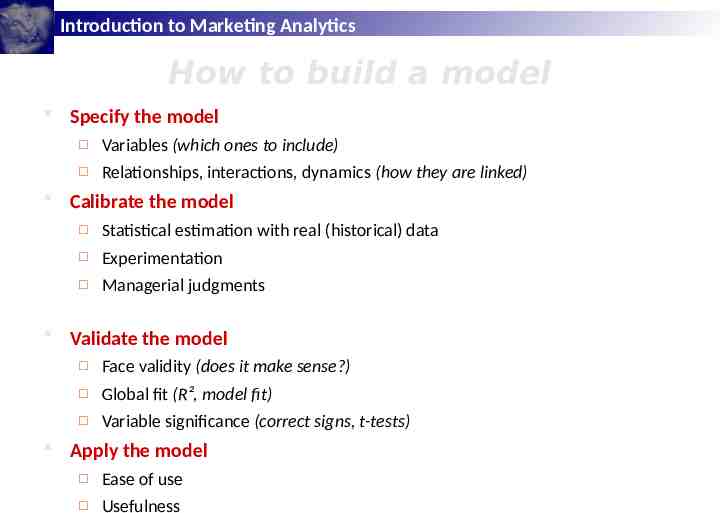
Introduction to Marketing Analytics How to build a model Specify the model Variables (which ones to include) Relationships, interactions, dynamics (how they are linked) Calibrate the model Statistical estimation with real (historical) data Experimentation Managerial judgments Validate the model Face validity (does it make sense?) Global fit (R², model fit) Variable significance (correct signs, t-tests) Apply the model Ease of use Usefulness
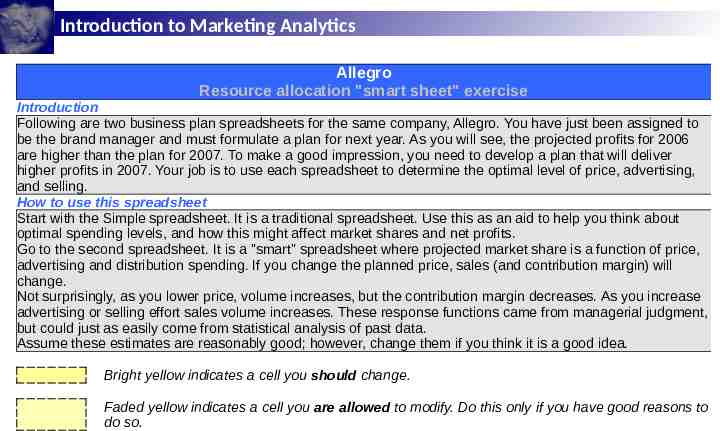
Introduction to Marketing Analytics Allegro Resource allocation "smart sheet" exercise Introduction Following are two business plan spreadsheets for the same company, Allegro. You have just been assigned to be the brand manager and must formulate a plan for next year. As you will see, the projected profits for 2006 are higher than the plan for 2007. To make a good impression, you need to develop a plan that will deliver higher profits in 2007. Your job is to use each spreadsheet to determine the optimal level of price, advertising, and selling. How to use this spreadsheet Start with the Simple spreadsheet. It is a traditional spreadsheet. Use this as an aid to help you think about optimal spending levels, and how this might affect market shares and net profits. Go to the second spreadsheet. It is a "smart" spreadsheet where projected market share is a function of price, advertising and distribution spending. If you change the planned price, sales (and contribution margin) will change. Not surprisingly, as you lower price, volume increases, but the contribution margin decreases. As you increase advertising or selling effort sales volume increases. These response functions came from managerial judgment, but could just as easily come from statistical analysis of past data. Assume these estimates are reasonably good; however, change them if you think it is a good idea. Bright yellow indicates a cell you should change. Faded yellow indicates a cell you are allowed to modify. Do this only if you have good reasons to do so.
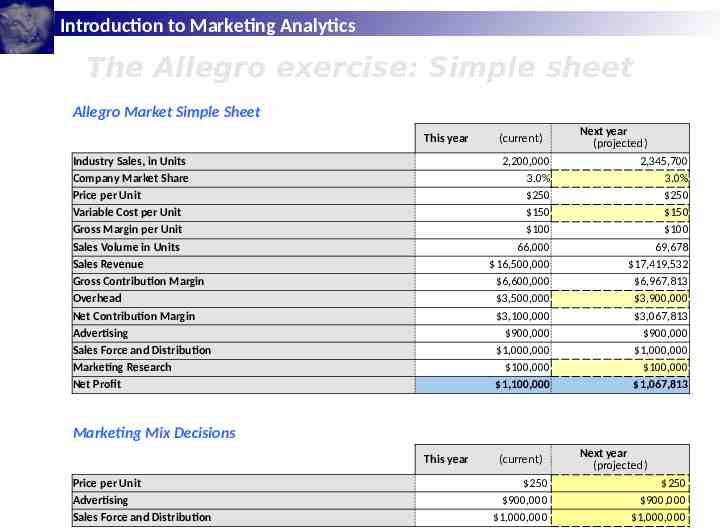
Introduction to Marketing Analytics The Allegro exercise: Simple sheet Allegro Market Simple Sheet This year Industry Sales, in Units Company Market Share Price per Unit Variable Cost per Unit Gross Margin per Unit Sales Volume in Units Sales Revenue Gross Contribution Margin Overhead Net Contribution Margin Advertising Sales Force and Distribution Marketing Research Net Profit (current) 2,200,000 3.0% 250 150 100 66,000 16,500,000 6,600,000 3,500,000 3,100,000 900,000 1,000,000 100,000 1,100,000 Next year (projected) 2,345,700 3.0% 250 150 100 69,678 17,419,532 6,967,813 3,900,000 3,067,813 900,000 1,000,000 100,000 1,067,813 Marketing Mix Decisions This year Price per Unit Advertising Sales Force and Distribution (current) 250 900,000 1,000,000 Next year (projected) 250 900,000 1,000,000
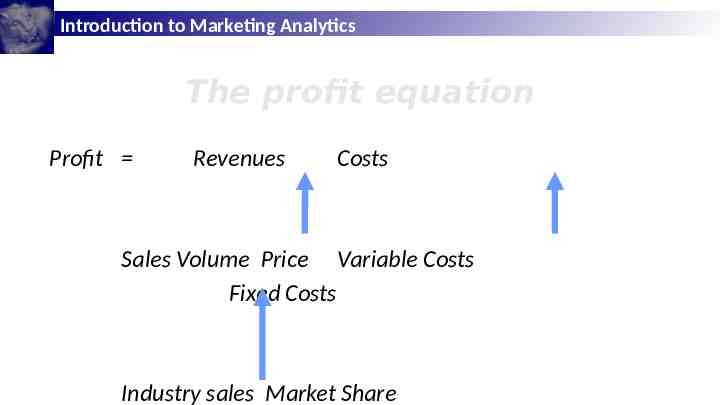
Introduction to Marketing Analytics The profit equation Profit Revenues Costs Sales Volume Price Variable Costs Fixed Costs Industry sales Market Share
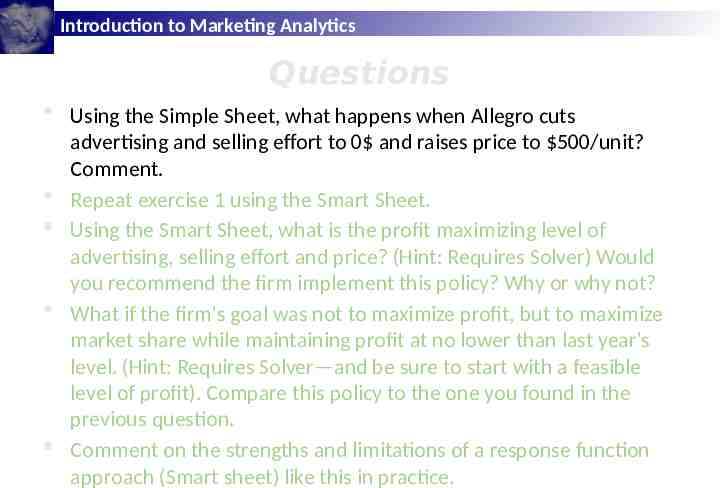
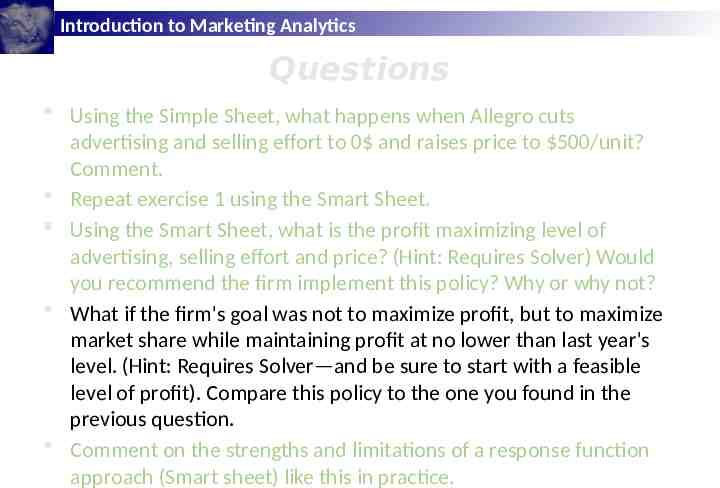
Introduction to Marketing Analytics Questions Using the Simple Sheet, what happens when Allegro cuts advertising and selling effort to 0 and raises price to 500/unit? Comment. Repeat exercise 1 using the Smart Sheet. Using the Smart Sheet, what is the profit maximizing level of advertising, selling effort and price? (Hint: Requires Solver) Would you recommend the firm implement this policy? Why or why not? What if the firm's goal was not to maximize profit, but to maximize market share while maintaining profit at no lower than last year's level. (Hint: Requires Solver—and be sure to start with a feasible level of profit). Compare this policy to the one you found in the previous question. Comment on the strengths and limitations of a response function approach (Smart sheet) like this in practice.
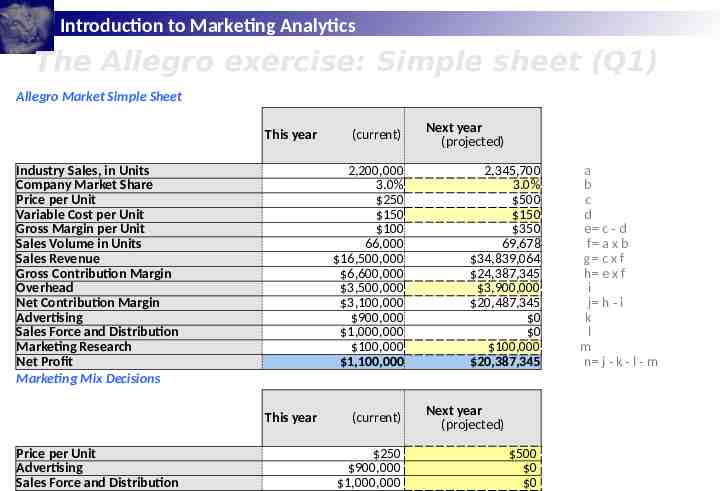
Introduction to Marketing Analytics The Allegro exercise: Simple sheet (Q1) Allegro Market Simple Sheet This year Industry Sales, in Units Company Market Share Price per Unit Variable Cost per Unit Gross Margin per Unit Sales Volume in Units Sales Revenue Gross Contribution Margin Overhead Net Contribution Margin Advertising Sales Force and Distribution Marketing Research Net Profit Marketing Mix Decisions 2,200,000 3.0% 250 150 100 66,000 16,500,000 6,600,000 3,500,000 3,100,000 900,000 1,000,000 100,000 1,100,000 This year Price per Unit Advertising Sales Force and Distribution (current) (current) 250 900,000 1,000,000 Next year (projected) 2,345,700 3.0% 500 150 350 69,678 34,839,064 24,387,345 3,900,000 20,487,345 0 0 100,000 20,387,345 Next year (projected) 500 0 0 a b c d e c - d f a x b g c x f h e x f i j h - i k l m n j - k - l - m
Introduction to Marketing Analytics Questions Using the Simple Sheet, what happens when Allegro cuts advertising and selling effort to 0 and raises price to 500/unit? Comment. Repeat exercise 1 using the Smart Sheet. Using the Smart Sheet, what is the profit maximizing level of advertising, selling effort and price? (Hint: Requires Solver) Would you recommend the firm implement this policy? Why or why not? What if the firm's goal was not to maximize profit, but to maximize market share while maintaining profit at no lower than last year's level. (Hint: Requires Solver—and be sure to start with a feasible level of profit). Compare this policy to the one you found in the previous question. Comment on the strengths and limitations of a response function approach (Smart sheet) like this in practice.
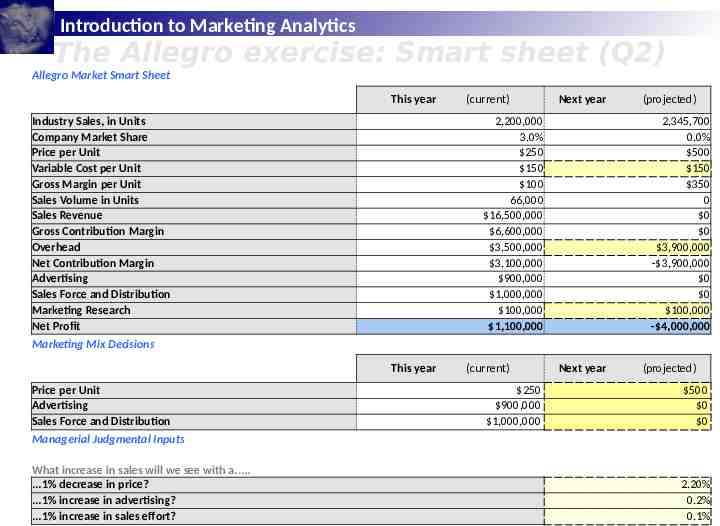
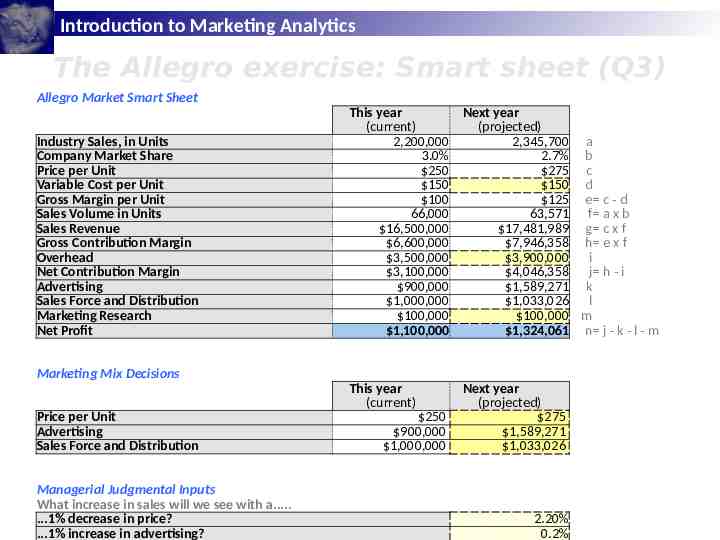
Introduction to Marketing Analytics The Allegro exercise: Smart sheet (Q2) Allegro Market Smart Sheet This year Industry Sales, in Units Company Market Share Price per Unit Variable Cost per Unit Gross Margin per Unit Sales Volume in Units Sales Revenue Gross Contribution Margin Overhead Net Contribution Margin Advertising Sales Force and Distribution Marketing Research Net Profit (current) Next year 2,200,000 3.0% 250 150 100 66,000 16,500,000 6,600,000 3,500,000 3,100,000 900,000 1,000,000 100,000 1,100,000 (projected) 2,345,700 0.0% 500 150 350 0 0 0 3,900,000 - 3,900,000 0 0 100,000 - 4,000,000 Marketing Mix Decisions This year Price per Unit Advertising Sales Force and Distribution (current) 250 900,000 1,000,000 Next year (projected) 500 0 0 Managerial Judgmental Inputs What increase in sales will we see with a. .1% decrease in price? .1% increase in advertising? .1% increase in sales effort? 2.20% 0.2% 0.1%
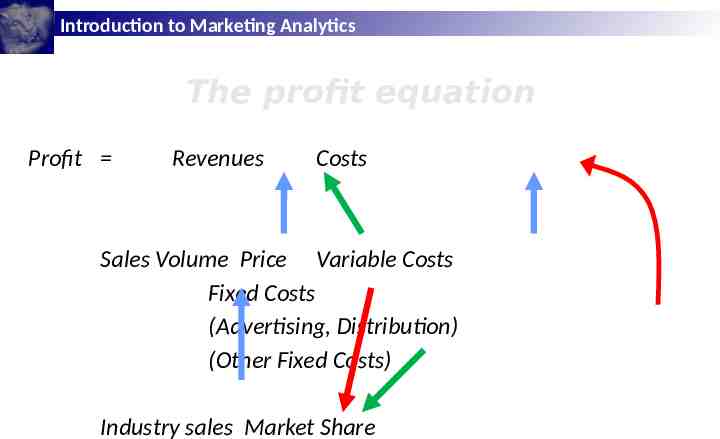
Introduction to Marketing Analytics The profit equation Profit Revenues Costs Sales Volume Price Variable Costs Fixed Costs (Advertising, Distribution) (Other Fixed Costs) Industry sales Market Share
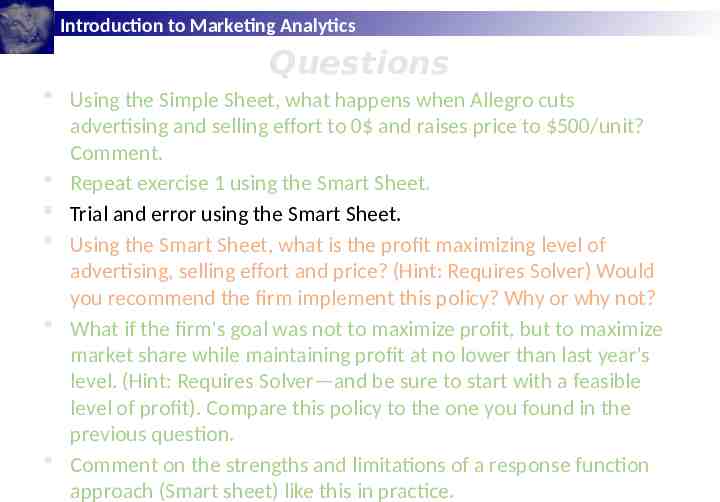
Introduction to Marketing Analytics Questions Using the Simple Sheet, what happens when Allegro cuts advertising and selling effort to 0 and raises price to 500/unit? Comment. Repeat exercise 1 using the Smart Sheet. Trial and error using the Smart Sheet. Using the Smart Sheet, what is the profit maximizing level of advertising, selling effort and price? (Hint: Requires Solver) Would you recommend the firm implement this policy? Why or why not? What if the firm's goal was not to maximize profit, but to maximize market share while maintaining profit at no lower than last year's level. (Hint: Requires Solver—and be sure to start with a feasible level of profit). Compare this policy to the one you found in the previous question. Comment on the strengths and limitations of a response function approach (Smart sheet) like this in practice.
Introduction to Marketing Analytics Questions Using the Simple Sheet, what happens when Allegro cuts advertising and selling effort to 0 and raises price to 500/unit? Comment. Repeat exercise 1 using the Smart Sheet. Using the Smart Sheet, what is the profit maximizing level of advertising, selling effort and price? (Hint: Requires Solver) Would you recommend the firm implement this policy? Why or why not? What if the firm's goal was not to maximize profit, but to maximize market share while maintaining profit at no lower than last year's level. (Hint: Requires Solver—and be sure to start with a feasible level of profit). Compare this policy to the one you found in the previous question. Comment on the strengths and limitations of a response function approach (Smart sheet) like this in practice.
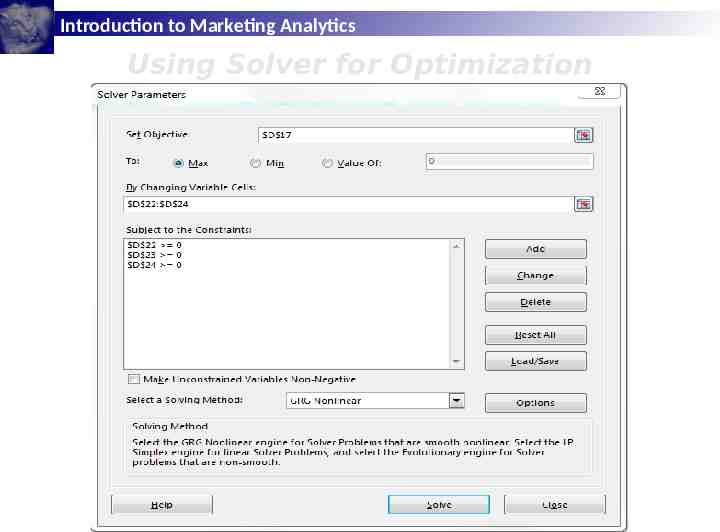
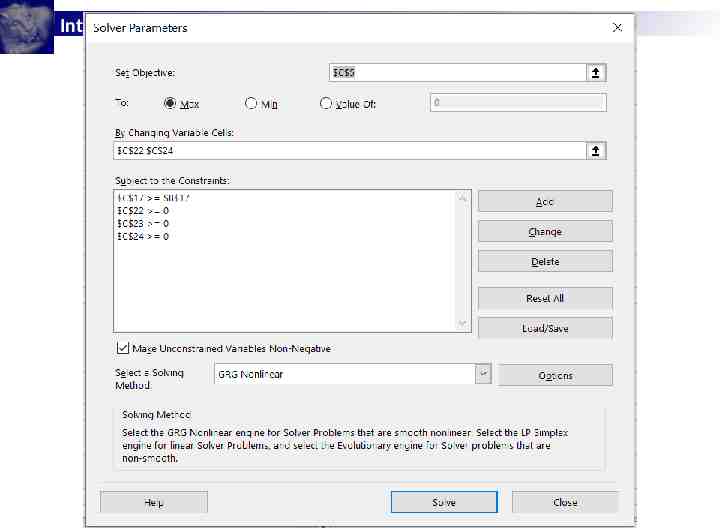
Introduction to Marketing Analytics Using Solver for Optimization
Introduction to Marketing Analytics The Allegro exercise: Smart sheet (Q3) Allegro Market Smart Sheet Industry Sales, in Units Company Market Share Price per Unit Variable Cost per Unit Gross Margin per Unit Sales Volume in Units Sales Revenue Gross Contribution Margin Overhead Net Contribution Margin Advertising Sales Force and Distribution Marketing Research Net Profit This year Next year (current) (projected) 2,200,000 2,345,700 a 3.0% 2.7% b 250 275 c 150 150 d 100 125 e c - d 66,000 63,571 f a x b 16,500,000 17,481,989 g c x f 6,600,000 7,946,358 h e x f 3,500,000 3,900,000 i 3,100,000 4,046,358 j h - i 900,000 1,589,271 k 1,000,000 1,033,026 l 100,000 100,000 m 1,100,000 1,324,061 n j - k - l - m Marketing Mix Decisions This year (current) Price per Unit Advertising Sales Force and Distribution Managerial Judgmental Inputs What increase in sales will we see with a. .1% decrease in price? .1% increase in advertising? 250 900,000 1,000,000 Next year (projected) 275 1,589,271 1,033,026 2.20% 0.2%
Introduction to Marketing Analytics Questions Using the Simple Sheet, what happens when Allegro cuts advertising and selling effort to 0 and raises price to 500/unit? Comment. Repeat exercise 1 using the Smart Sheet. Using the Smart Sheet, what is the profit maximizing level of advertising, selling effort and price? (Hint: Requires Solver) Would you recommend the firm implement this policy? Why or why not? What if the firm's goal was not to maximize profit, but to maximize market share while maintaining profit at no lower than last year's level. (Hint: Requires Solver—and be sure to start with a feasible level of profit). Compare this policy to the one you found in the previous question. Comment on the strengths and limitations of a response function approach (Smart sheet) like this in practice.
Introduction to Marketing Analytics
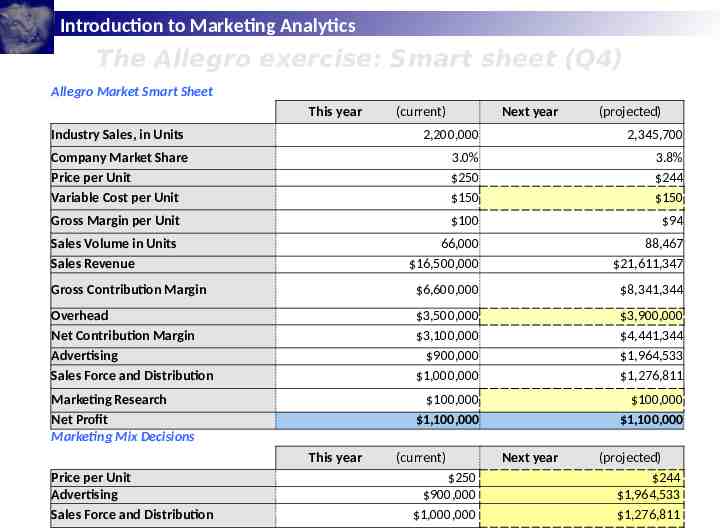
Introduction to Marketing Analytics The Allegro exercise: Smart sheet (Q4) Allegro Market Smart Sheet This year (current) Next year (projected) Industry Sales, in Units 2,200,000 2,345,700 Company Market Share Price per Unit Variable Cost per Unit 3.0% 250 150 3.8% 244 150 Gross Margin per Unit 100 94 Sales Volume in Units Sales Revenue 66,000 16,500,000 88,467 21,611,347 Gross Contribution Margin 6,600,000 8,341,344 Overhead Net Contribution Margin Advertising Sales Force and Distribution 3,500,000 3,100,000 900,000 1,000,000 3,900,000 4,441,344 1,964,533 1,276,811 Marketing Research Net Profit Marketing Mix Decisions 100,000 1,100,000 100,000 1,100,000 This year Price per Unit Advertising Sales Force and Distribution (current) 250 900,000 1,000,000 Next year (projected) 244 1,964,533 1,276,811
Introduction to Marketing Analytics Questions Using the Simple Sheet, what happens when Allegro cuts advertising and selling effort to 0 and raises price to 500/unit? Comment. Repeat exercise 1 using the Smart Sheet. Using the Smart Sheet, what is the profit maximizing level of advertising, selling effort and price? (Hint: Requires Solver) Would you recommend the firm implement this policy? Why or why not? What if the firm's goal was not to maximize profit, but to maximize market share while maintaining profit at no lower than last year's level. (Hint: Requires Solver—and be sure to start with a feasible level of profit). Compare this policy to the one you found in the previous question. Comment on the strengths and limitations of a response function approach (Smart sheet) like this in practice.
Introduction to Marketing Analytics Assignment for next class Read LRB Chapter 3 Download Segmentation.pptx or Segmentation.pdf Read the Segmentation Tutorial (Enginius)