Informing Strategic Investments in Enhancing Agricultural

24 Slides4.79 MB
Informing Strategic Investments in Enhancing Agricultural Technology Development and Use: The Role of Agricultural Statistics Stanley Wood Senior Research Fellow, International Food Policy Research Institute (IFPRI) Co-Principal Investigator, HarvestChoice Contribution of Partners in the Development of Agricultural Statistics in Africa Twentieth Session, African Commission on Agricultural Statistics Algiers, Algeria, 10-13th December 2007
Overview Reinvigorated engagement in agricultural development in Africa What is HarvestChoice? Need for improved agricultural statistical data to support strategy/policy/ investment analysis HarvestChoice/FAO initiatives related to agricultural statistics in Africa
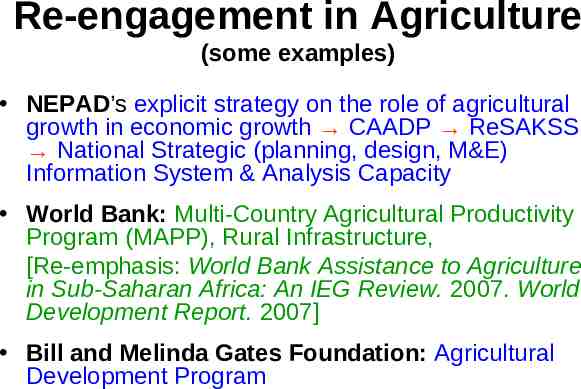
Re-engagement in Agriculture (some examples) NEPAD’s explicit strategy on the role of agricultural growth in economic growth CAADP ReSAKSS National Strategic (planning, design, M&E) Information System & Analysis Capacity World Bank: Multi-Country Agricultural Productivity Program (MAPP), Rural Infrastructure, [Re-emphasis: World Bank Assistance to Agriculture in Sub-Saharan Africa: An IEG Review. 2007. World Development Report. 2007] Bill and Melinda Gates Foundation: Agricultural Development Program
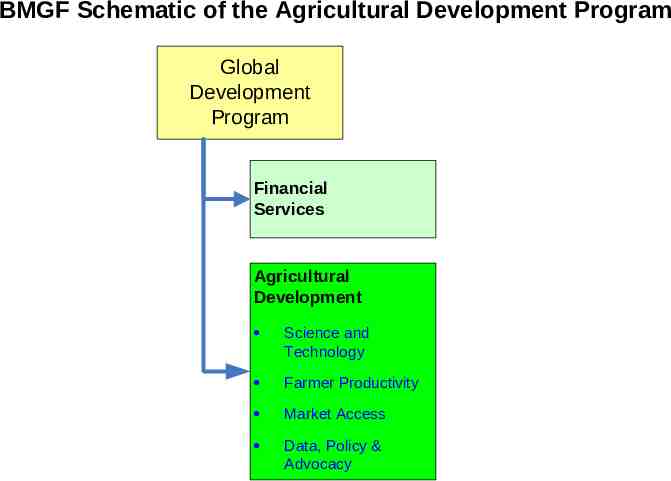
BMGF Schematic of the Agricultural Development Program Global Development Program Financial Services Agricultural Development · Science and Technology · Farmer Productivity · Market Access · Data, Policy & Advocacy
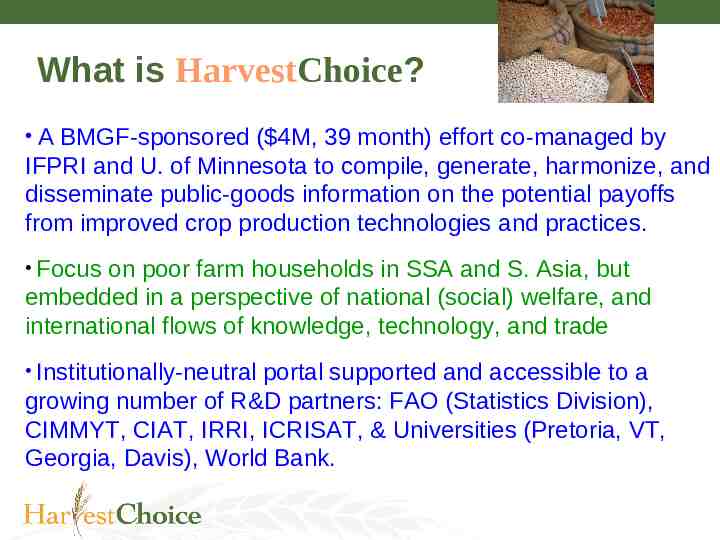
What is HarvestChoice? A BMGF-sponsored ( 4M, 39 month) effort co-managed by IFPRI and U. of Minnesota to compile, generate, harmonize, and disseminate public-goods information on the potential payoffs from improved crop production technologies and practices. Focus on poor farm households in SSA and S. Asia, but embedded in a perspective of national (social) welfare, and international flows of knowledge, technology, and trade Institutionally-neutral portal supported and accessible to a growing number of R&D partners: FAO (Statistics Division), CIMMYT, CIAT, IRRI, ICRISAT, & Universities (Pretoria, VT, Georgia, Davis), World Bank.
What is HarvestChoice? Partner/user programs: HarvestPlus, Generation Challenge Program, USAID/IPM-CRSP, USAID/IEHA, (AGRA/PASS, WB/MAPP, Howard Buffet Foundation, Sainsbury Family Trust) Regional partners and processes, e.g. CAADP (ReSAKSS), ASARECA, (SADC, CORAF)
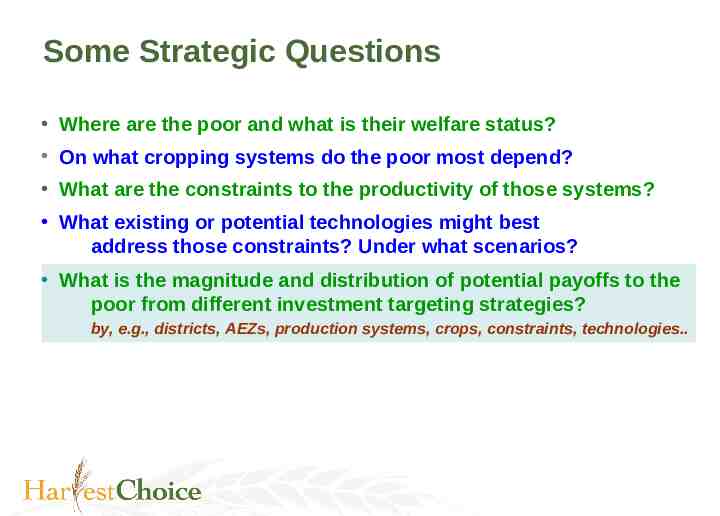
Some Strategic Questions Where are the poor and what is their welfare status? On what cropping systems do the poor most depend? What are the constraints to the productivity of those systems? What existing or potential technologies might best address those constraints? Under what scenarios? What is the magnitude and distribution of potential payoffs to the poor from different investment targeting strategies? by, e.g., districts, AEZs, production systems, crops, constraints, technologies.
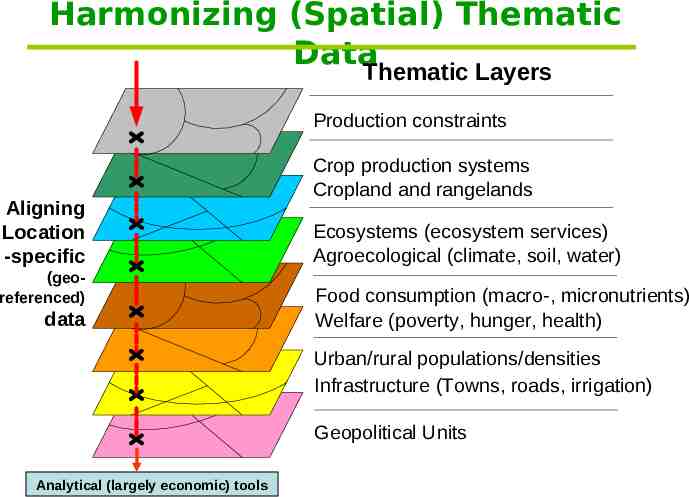
Harmonizing (Spatial) Thematic Data Thematic Layers Geopolitical Production constraints Ecosystems (ecosystem services) Crop production(climate, systemssoil, water) Agroecological Aligning Location -specific (georeferenced) data Cropland and rangelands Cropland and rangelands services) Ecosystems (ecosystem Production systems Agroecological (climate, soil, water) Food consumption (macro-, micronutrients) Infrastructure (Towns, roads, irrigation) Welfare (poverty, hunger, health) Urban/rural populations/densities Demography (population density) Infrastructure (Towns, roads, irrigation) VulnerabilityUnits (poverty, hunger, Geopolitical health, conflict) Analytical (largely economic) tools
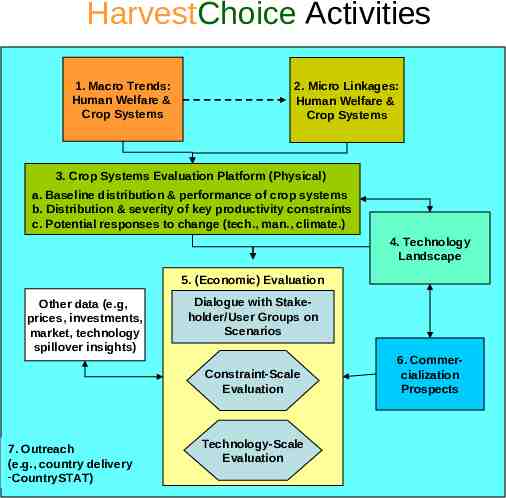
HarvestChoice Activities 1. Macro Trends: Human Welfare & Crop Systems 2. Micro Linkages: Human Welfare & Crop Systems 3. Crop Systems Evaluation Platform (Physical) a. Baseline distribution & performance of crop systems b. Distribution & severity of key productivity constraints c. Potential responses to change (tech., man., climate.) 4. Technology Landscape 5. (Economic) Evaluation Other data (e.g, prices, investments, market, technology spillover insights) Dialogue with Stakeholder/User Groups on Scenarios Constraint-Scale Evaluation 7. Outreach (e.g., country delivery -CountrySTAT) Technology-Scale Evaluation 6. Commercialization Prospects
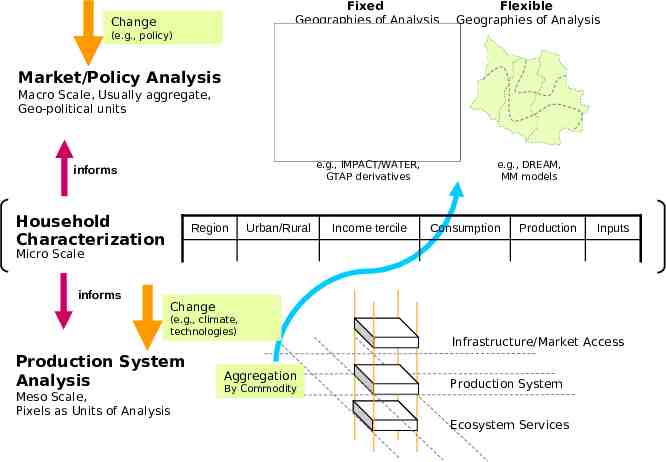
Change Fixed Geographies of Analysis Flexible Geographies of Analysis e.g., IMPACT/WATER, GTAP derivatives e.g., DREAM, MM models (e.g., policy) Market/Policy Analysis Macro Scale, Usually aggregate, Geo-political units informs Household Characterization Region Urban/Rural Income tercile Consumption Production Inputs Micro Scale informs Change (e.g., climate, technologies) Production System Analysis Meso Scale, Pixels as Units of Analysis Aggregation By Commodity Infrastructure/Market Access Production System Ecosystem Services
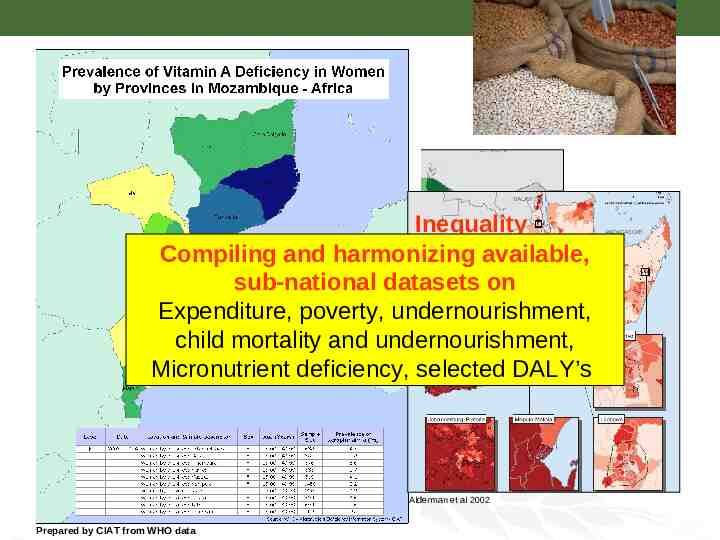
Where are the Africa’s poor and what is their welfare status? Inequality Compiling and harmonizing available, sub-national datasets on Expenditure, poverty, undernourishment, child mortality and undernourishment, Infant Mortality Micronutrient deficiency, selected DALY’s Children Poverty Underweight Hunger Task Force/CIESIN 2005 CBS et al. 2003 Hunger Task Force/CIESIN 2005 Alderman et al 2002 Prepared by CIAT from WHO data
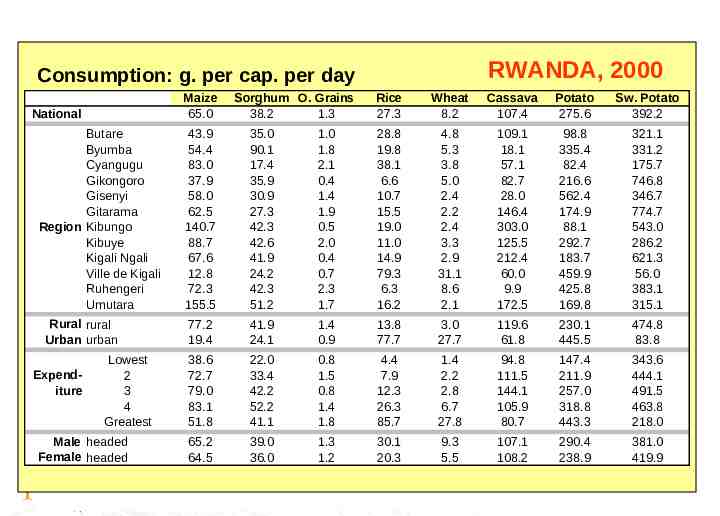
On what cropping systems do RWANDA, 2000 Consumption: g. per cap. per day the poor most Maize depend? Sorghum O. Grains Rice Wheat Cassava Potato Sw. Potato National 65.0 38.2 1.3 27.3 8.2 107.4 275.6 392.2 CONSUMPTION Butare 43.9 35.0 1.0 28.8 4.8 109.1 98.8 321.1 3.0 27.7 119.6 61.8 230.1 445.5 474.8 83.8 0.8 1.5 0.8 1.4 1.8 4.4 7.9 12.3 26.3 85.7 1.4 2.2 2.8 6.7 27.8 94.8 111.5 144.1 105.9 80.7 147.4 211.9 257.0 318.8 443.3 343.6 444.1 491.5 463.8 218.0 290.4 238.9 381.0 419.9 & 9.3 5.5 107.1 108.2 rg hu So ua sh sq Be 30.1 20.3 s 1.3 1.2 m 13.8 77.7 es 1.4 0.9 an s 331.2 175.7 746.8 346.7 774.7 543.0 286.2 621.3 56.0 383.1 315.1 m pk in 39.0 36.0 335.4 82.4 216.6 562.4 174.9 88.1 292.7 183.7 459.9 425.8 169.8 Pu ee t 65.2 64.5 18.1 57.1 82.7 28.0 146.4 303.0 125.5 212.4 60.0 9.9 172.5 a 22.0 33.4 42.2 52.2 41.1 5.3 3.8 5.0 2.4 2.2 2.4 3.3 2.9 31.1 8.6 2.1 as sa v 38.6 72.7 79.0 83.1 51.8 19.8 38.1 6.6 10.7 2000 15.5 19.0 11.0 14.9 79.3 6.3 16.2 C 41.9 24.1 1.8 2.1 0.4 1.4 Rwanda, 1.9 0.5 2.0 0.4 0.7 2.3 1.7 s 77.2 19.4 Sw Pl Male headed Female headed Po Lowest 2 3 4 Greatest an ta i Expenditure ns 0 90.1 17.4 35.9 30.9 27.3 42.3 42.6 41.9 24.2 42.3 51.2 ta to es Rural 100 rural Urban urban 54.4 83.0 37.9 58.0 62.5 140.7 88.7 67.6 12.8 72.3 155.5 po ta to e Byumba Cyangugu Gikongoro g. per cap.Gisenyi per day Gitarama 600 Region Kibungo 500 Kibuye 400 Kigali Ngali Ville de Kigali 300 Ruhengeri 200 Umutara
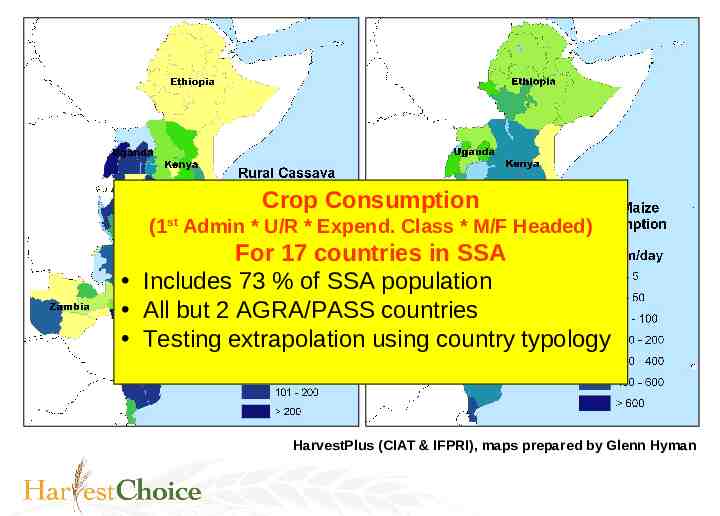
Crop Consumption (1st Admin * U/R * Expend. Class * M/F Headed) For 17 countries in SSA Includes 73 % of SSA population All but 2 AGRA/PASS countries Testing extrapolation using country typology HarvestPlus (CIAT & IFPRI), maps prepared by Glenn Hyman
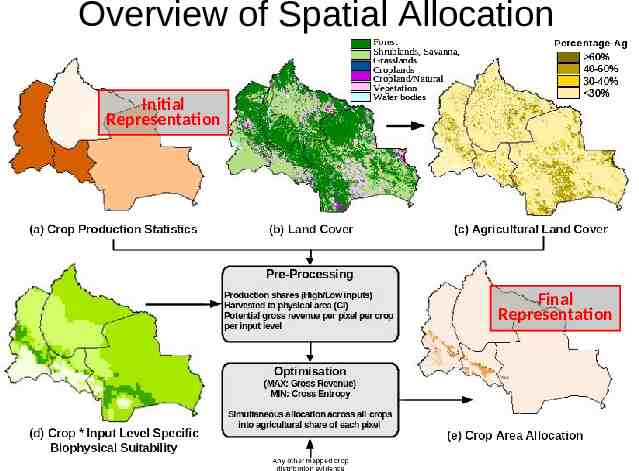
Overview of Spatial Allocation Initial Representation Final Representation
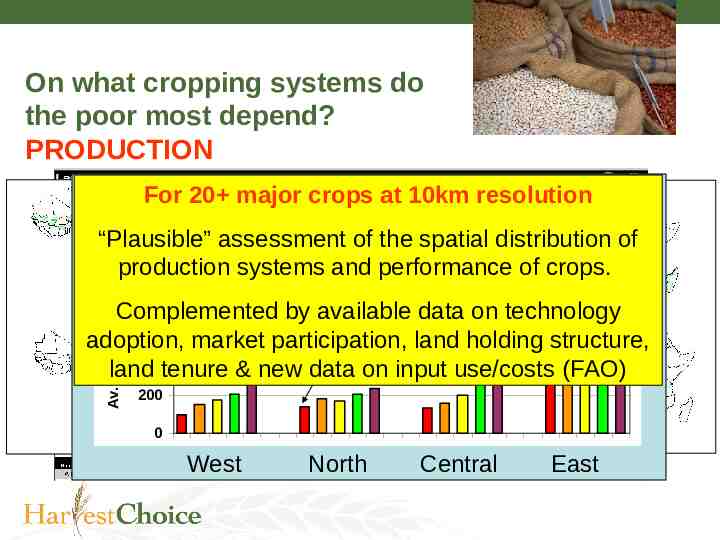
On what cropping systems do the poor most depend? PRODUCTION For 20 major crops at 10km resolution Av. Maize Output perdistribution hh) “Plausible” assessment of the (kg spatial of 1000 Uganda production systems and1999-2000 performance of crops. Av. Maize Output (kg/hh) 1200 800 Complemented by available data on technology 600 Least Poor Poorest adoption, market participation, land holding structure, Quintile Maize Quintile 400 Maize land tenure & new data on input Area use/costs (FAO) Area (1st Level Admin) 0 (2nd Level Admin) 200 1 3 West 5 7 9 11 North 13 15 17 19 Central 21 23 25 East
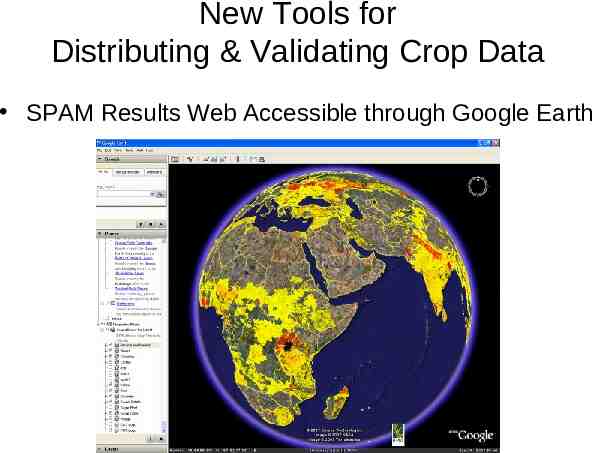
New Tools for Distributing & Validating Crop Data SPAM Results Web Accessible through Google Earth
Evaluating the Payoffs to Crop Improvement for the Poor Economic benefits of technical change arising from; higher (on- and off-farm) productivity, lower unit costs, lower variance of output, quality price premiums, commercialization constraints and opportunities (using 2 stage assessment) Share of benefits to poor producers and poor consumers - Spatial incidence of benefits - Implications for nutrition and incomes Potential sources of benefit – Local, spillins Economic implications of time lags, (e.g. R&D, regulation, commercialization, adoption)
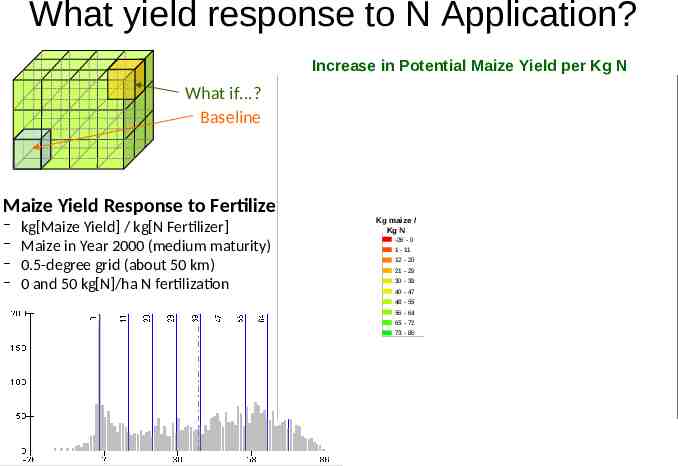
What yield response to N Application? Increase in Potential Maize Yield per Kg N What if.? Baseline Maize Yield Response to Fertilizer – – – – kg[Maize Yield] / kg[N Fertilizer] Maize in Year 2000 (medium maturity) 0.5-degree grid (about 50 km) 0 and 50 kg[N]/ha N fertilization Kg maize / Yield Kg NGain (kg[Yield]/kg[N]) -26 - 0 1 - 11 12 - 20 21 - 29 30 - 39 40 - 47 48 - 55 56 - 64 65 - 72 73 - 86 ?
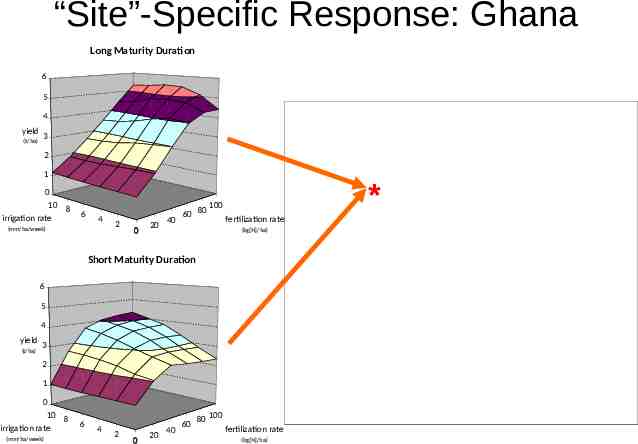
“Site”-Specific Response: Ghana Long Maturity Duration 6 5 4 yield (t/ha) 3 2 1 0 10 8 irrigation rate 6 4 (mm/ha/week) 2 0 20 40 60 80 * 100 fertilization rate (kg[N]/ha) Short Maturity Duration 6 5 4 yield (t/ha) 3 2 1 0 10 8 irrigation rate (mm/ha/week) 6 4 2 0 20 40 60 80 100 fertilization rate (kg[N]/ha)
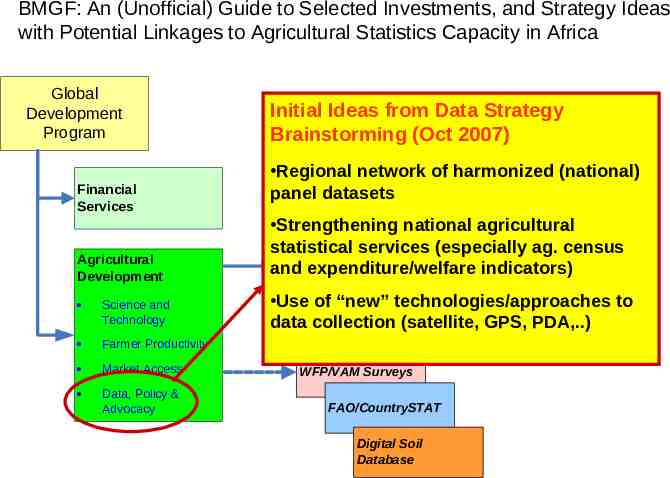
BMGF: An (Unofficial) Guide to Selected Investments, and Strategy Ideas with Potential Linkages to Agricultural Statistics Capacity in Africa Global Development Program Financial Services Agricultural Development · Science and Technology · Farmer Productivity · Market Access · Data, Policy & Advocacy Initial Ideas from Data Strategy Brainstorming (Oct 2007) Regional network of harmonized (national) panel datasets AGRA ( 16 countries)national agricultural Strengthening · Seeds (PASS) statistical services (especially ag. census · Market development · Soil health and expenditure/welfare indicators) · Water management · . Use of “new” technologies/approaches · Monitoring & Evaluation data collection (satellite, GPS, PDA,.) WFP/VAM Surveys FAO/CountrySTAT Digital Soil Database to
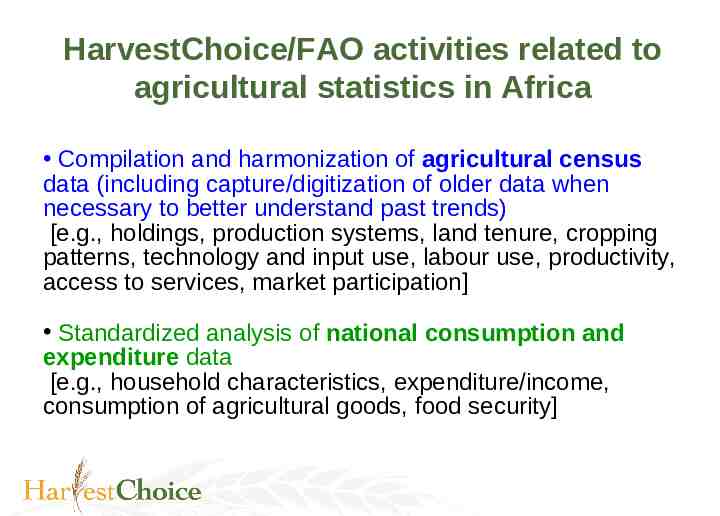
HarvestChoice/FAO activities related to agricultural statistics in Africa Compilation and harmonization of agricultural census data (including capture/digitization of older data when necessary to better understand past trends) [e.g., holdings, production systems, land tenure, cropping patterns, technology and input use, labour use, productivity, access to services, market participation] Standardized analysis of national consumption and expenditure data [e.g., household characteristics, expenditure/income, consumption of agricultural goods, food security]
HarvestChoice/FAO activities related to agricultural statistics in Africa Production system characterization (e.g., orientation, output and input mixes, technologies, management practices, cropping patterns, rotations/fallow use, natural resource needs/impacts, productivity) Cost of production database (to support more detailed productivity and profitability analysis - particularly in the light of potential change, e.g., increased investment or policy change) NB All processed data generated will be made available in digital format and, wherever feasible, made available for national CountrySTAT implementations
HarvestChoice/FAO activities Learning/Partner Hopes from AFCAS Gather and consolidate information on the status of ongoing and planned nationally representative survey and census activities of participating countries Identify opportunities for “data rescue” of past census/ survey data Start to identify potential synergies between country statistical service development plans and potential funding options of relevance to the Gates Foundation portfolio Find partner countries to help develop and test the Cost of Production survey instrument to be administered by FAO/ESSD Communicate new opportunities for investment in statistical and monitoring systems at country level