Impax Asset Management Renewable Energy Infrastructure


9 Slides1.83 MB
Impax Asset Management Renewable Energy Infrastructure Investment Workshop “How to address key deal flow challenges” CLEAR INVESTMENT 19 June 2018 – London, Guildhall
Impax Asset Management The specialist investment manager focused on the transition to a more Investment products 31 March 2018 7.6bn Thematic Equities sustainable economy Specialist manager, 20 years’ experience High quality investment solutions for 1.2bn Unconstrained Equities 926m Smart Beta 11.0bn AUM1 institutional investors 804m Fixed Income 481m Real Assets London LE managed / US LE managed / London PE team managed 2 2017 UNPRI assessment: A Policies, Processes, Practices, and Governance 1. Assets under advice represent 3%, increased to 11.8bn as at 31 May 2018. 2. US- managed AUM refers to Pax World Funds. Impax acquired Pax World Management LLC on 18 January 2018. CLEAR INVESTMENT 2
NEF II: 330m Fund - Risk Management Diversification: Country, site, resource, technology NEF II INVESTED & COMMITTED CAPITAL1 ( 277M) Pan European 2% Italy 6% France 25% Poland 20% 105MW Finland 20% Ireland 13% Germany 14% 78MW High credit rated EU countries Germany Finland France Poland Ireland Italy – – – – – – AAA/Aaa AA /Aaa AA/Aa1 A-/A2 A/ Baa1 BBB-/Baa2 Diversified natural resource base/site location Proven exit-market demand for operating assets 48MW Key as of 31 March 2018 82MW 138MW MW Owned (Wind) Owned (Solar PV) Realised Current operating & in construction capacity 22MW Sources: Impax internal analysis as at 31 March 2018 / Standard & Poor ’s / Moody’s 1 Net invested committed capital, post refinancing proceeds, up to 31 March 2018 CLEAR INVESTMENT 3
Global Metrics: Declining LCOE – all in cost per MWh basis 350 300 250 Offshore wind 200 PV no tracking 150 Onshore wind 100 50 0 H2 H1 H2 H1 H2 H1 H2 H1 H2 H1 H2 H1 H2 H1 H2 H1 H1 2009 2010 2010 2011 2011 2012 2012 2013 2013 2014 2014 2015 2015 2016 2016 2017 2018 CLEAR INVESTMENT Source: Bloomberg New Energy 4
Renewables Projects and Companies Investment 2017 bn 127.9bn 49.4 333.5bn Small-scale solar Total investment 461.4bn 21.6 216.1 14.5 1.3 Gov R&D PE 8.7 49.9 - 3.1 22.1 2.8 VC Corp RD&D Version WF18.04 All values nominal CLEAR INVESTMENT Public markets Total company Re-invested new equity investment eq. Renewable energy AF Digital energy & storage AF M&A/buy-outs Total etc. transactions Source: Bloomberg New Energy Finance Source: Bloomberg New Energy 5
Institutional investment into European renewables projects bn 12 10 8 Loan Platform Index-linked note 6 PE/infrastructure fund Quoted fund Project bond 4 Direct 2 0 2007 2008 2009 2010 2011 2012 2013 2014 2015 2016 2017 CLEAR INVESTMENT Source: Bloomberg New Energy 6
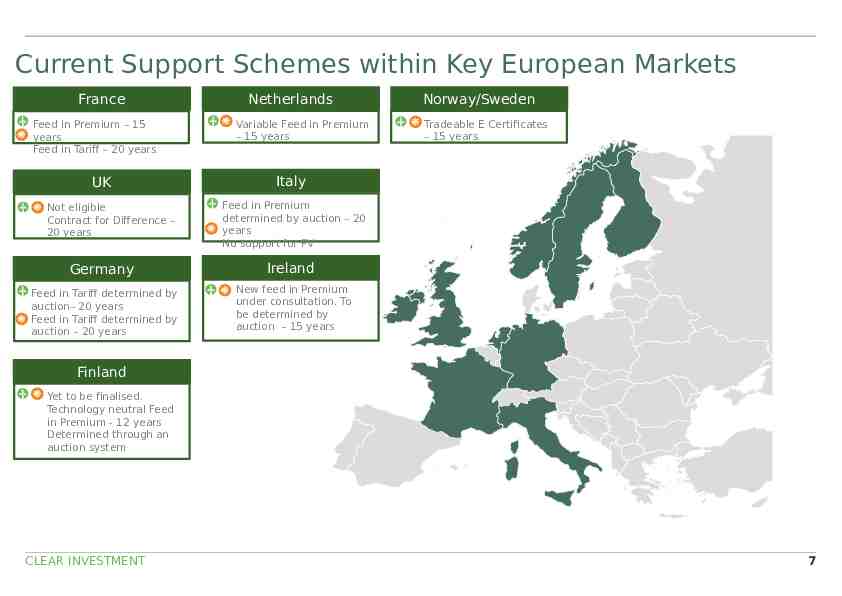
Current Support Schemes within Key European Markets France Feed in Premium – 15 years Feed in Tariff – 20 years UK Not eligible Contract for Difference – 20 years Netherlands Variable Feed in Premium – 15 years Norway/Sweden Tradeable E Certificates – 15 years Italy Feed in Premium determined by auction – 20 years No support for PV Germany Ireland Feed in Tariff determined by auction– 20 years Feed in Tariff determined by auction – 20 years New feed in Premium under consultation. To be determined by auction – 15 years Finland Yet to be finalised. Technology neutral Feed in Premium - 12 years Determined through an auction system CLEAR INVESTMENT 7
Impax Transactions Closed in NEF III in 2017-2018 Germany - Wind: Developer Framework Agreement Project Co-development Agreement France - Wind: Operating Asset Repowering Norway - Hydro Developer Joint Venture CLEAR INVESTMENT 8
France: gap to achieve 2023 renewables target 13.7GW 12.8GW 10.8GW 9.5GW 3.0GW Onshore - High Onshore - Low Offshore PV - High PV - Low An update of France’s five year energy sector plan is due at the end of 2018. Source: Bloomberg New Energy It is expected to increase the targets for renewables CLEAR INVESTMENT Finance 9