Hidden Markov Models and Graphical Models CS294: Practical


69 Slides5.75 MB
Hidden Markov Models and Graphical Models CS294: Practical Machine Learning Oct. 8, 2009 Alex Simma (asimma@eecs) Based on slides by Erik Sudderth
Speech Recognition Given an audio waveform, would like to robustly extract & recognize any spoken words Statistical models can be used to Provide greater robustness to noise Adapt to accent of different speakers Learn from training S. Roweis, 2004
Target Tracking Radar-based tracking of multiple targets Visual tracking of articulated objects (L. Sigal et. al., 2006) Estimate motion of targets in 3D world from indirect, potentially noisy measurements
Robot Navigation: SLAM Simultaneous Localization and Mapping Landmark SLAM (E. Nebot, Victoria Park) CAD Map (S. Thrun, San Jose Tech Museum) Estimated Map As robot moves, estimate its pose & world geometry
Financial Forecasting http://www.steadfastinvestor.com/ Predict future market behavior from historical data, news reports, expert opinions,
Biological Sequence Analysis (E. Birney, 2001) Temporal models can be adapted to exploit more general forms of sequential structure, like those arising in DNA sequences
Analysis of Sequential Data Sequential structure arises in a huge range of applications Repeated measurements of a temporal process Online decision making & control Text, biological sequences, etc Standard machine learning methods are often difficult to directly apply Do not exploit temporal correlations Computation & storage requirements typically scale poorly to realistic applications
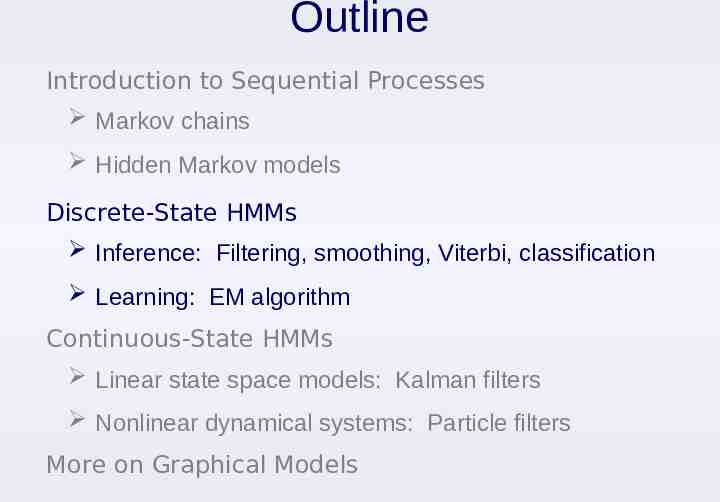
Outline Introduction to Sequential Processes Markov chains Hidden Markov models Discrete-State HMMs Inference: Filtering, smoothing, Viterbi, classification Learning: EM algorithm Continuous-State HMMs Linear state space models: Kalman filters Nonlinear dynamical systems: Particle filters More on Graphical Models
Sequential Processes Consider a system which can occupy one of N discrete states or categories state at time t We are interested in stochastic systems, in which state evolution is random Any joint distribution can be factored into a series of conditional distributions:
Markov Processes For a Markov process, the next state depends only on the current state: This property in turn implies that “Conditioned on the present, the past & future are independent”
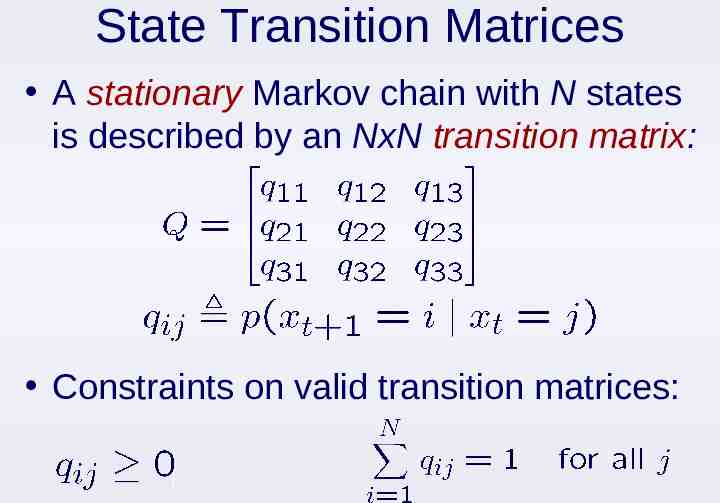
State Transition Matrices A stationary Markov chain with N states is described by an NxN transition matrix: Constraints on valid transition matrices:
State Transition Diagrams 0.5 0.5 0.1 0.0 0.3 0.0 0.4 0.2 0.9 0.6 1 0.3 0.2 0.1 2 0.9 0.6 3 0.4 Think of a particle randomly following an arrow at each discrete time step Most useful when N small, and Q sparse
Graphical Models – A Quick Intro A way of specifying conditional independences. Directed Graphical Modes: a DAG Nodes are random variables. A node’s distribution depends on its parents. Joint distribution: A node’s value conditional on its parents is X3 independent of other ancestors. p(x x ) X1 p(x2 x1) X2 3 2 X6 p(x1) p(x6 x2, x5) p(x4 x1) X4 p(x5 x4) X5
Markov Chains: Graphical Models Graph interpretation differs from state transition diagrams: state values at particular times nodes 0.5 0.1 0.0 0.3 0.0 0.4 0.2 0.9 0.6 Markov properties edges
Embedding Higher-Order Chains Each new state depends on fixed-length window of preceding state values We can represent this as a first-order model via state augmentation: (N2 augmented states)
Continuous State Processes In many applications, it is more natural to define states in some continuous, Euclidean space: parameterized family of state transition densities Examples: stock price, aircraft position,
Hidden Markov Models Few realistic time series directly satisfy the assumptions of Markov processes: “Conditioned on the present, the past & future are independent” Motivates hidden Markov models (HMM): hidden states observed process
Hidden states hidden states observed process Given , earlier observations provide no additional information about the future: Transformation of process under which dynamics take a simple, first-order form
Where do states come from? hidden states observed process Analysis of a physical phenomenon: Dynamical models of an aircraft or robot Geophysical models of climate evolution Discovered from training data: Recorded examples of spoken English Historic behavior of stock prices
Outline Introduction to Sequential Processes Markov chains Hidden Markov models Discrete-State HMMs Inference: Filtering, smoothing, Viterbi, classification Learning: EM algorithm Continuous-State HMMs Linear state space models: Kalman filters Nonlinear dynamical systems: Particle filters More on Graphical Models
Discrete State HMMs hidden states observed process Associate each of the N hidden states with a different observation distribution: Observation densities are typically chosen to encode domain knowledge
Discrete HMMs: Observations Discrete Observations Continuous Observations
Specifying an HMM Observation model: Transition model: Initial state distribution:
Gilbert-Elliott Channel Model Hidden State: Observations: small Time large Simple model for correlated, bursty noise (Elliott, 1963)
Discrete HMMs: Inference In many applications, we would like to infer hidden states from observations Suppose that the cost incurred by an estimated state sequence decomposes: true state estimated state The expected cost then depends only on the posterior marginal distributions:
Filtering & Smoothing For online data analysis, we seek filtered state estimates given earlier observations: In other cases, find smoothed estimates given earlier and later of observations: Lots of other alternatives, including fixed-lag smoothing & prediction:
Markov Chain Statistics By definition of conditional probabilities,
Discrete HMMs: Filtering Normalization constant Prediction: Update: Incorporates T observations in operations
Discrete HMMs: Smoothing The forward-backward algorithm updates filtering via a reverse-time recursion:
Optimal State Estimation Probabilities measure the posterior confidence in the true hidden states The posterior mode minimizes the number of incorrectly assigned states: Bit or symbol error rate What about the state sequence with the Word or sequence highest joint probability? error rate
Viterbi Algorithm Use dynamic programming to recursively find the probability of the most likely state sequence ending with each A reverse-time, backtracking procedure then picks the maximizing state sequence
Time Series Classification Suppose I’d like to know which of 2 HMMs best explains an observed sequence This classification is optimally determined by the following log-likelihood ratio: These log-likelihoods can be computed from filtering normalization constants
Discrete HMMs: Learning I Suppose first that the latent state sequence is available during training The maximum likelihood estimate equals (observation distributions) For simplicity, assume observations are Gaussian with known variance & mean
Discrete HMMs: Learning II The ML estimate of the transition matrix is determined by normalized counts: number of times observed before Given x, independently estimate the output distribution for each state:
Discrete HMMs: EM Algorithm In practice, we typically don’t know the hidden states for our training sequences The EM algorithm iteratively maximizes a lower bound on the true data likelihood: E-Step: Use current parameters to estimate state M-Step: Use soft state estimates to update parameters Applied to HMMs, equivalent to the Baum-Welch algorithm
Discrete HMMs: EM Algorithm Due to Markov structure, EM parameter updates use local statistics, computed by the forward-backward algorithm (E-step) The M-step then estimates observation distributions via a weighted average: Transition matrices estimated similarly May encounter local minima; initialization important.
Outline Introduction to Sequential Processes Markov chains Hidden Markov models Discrete-State HMMs Inference: Filtering, smoothing, Viterbi, classification Learning: EM algorithm Continuous-State HMMs Linear state space models: Kalman filters Nonlinear dynamical systems: Particle filters More on Graphical Models
Linear State Space Models States & observations jointly Gaussian: All marginals & conditionals Gaussian Linear transformations remain Gaussian
Simple Linear Dynamics Brownian Motion Time Constant Velocity Time
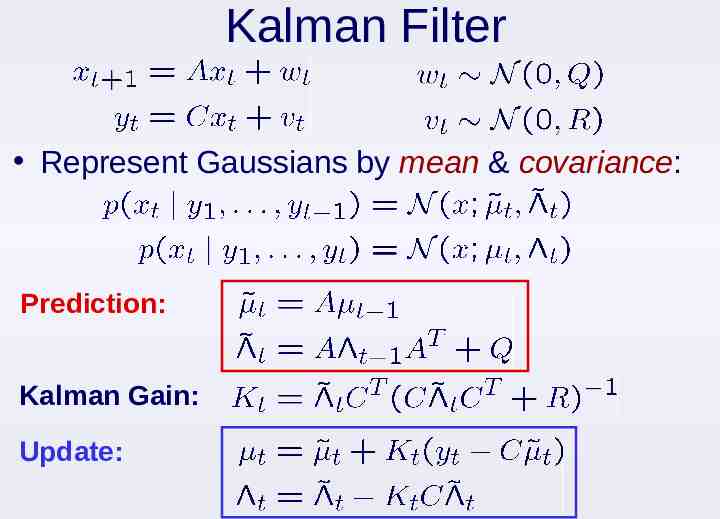
Kalman Filter Represent Gaussians by mean & covariance: Prediction: Kalman Gain: Update:
Kalman Filtering as Regression The posterior mean minimizes the mean squared prediction error: The Kalman filter thus provides an optimal online regression algorithm
Constant Velocity Tracking Kalman Filter Kalman Smoother (K. Murphy, 1998)
Nonlinear State Space Models State dynamics and measurements given by potentially complex nonlinear functions Noise sampled from non-Gaussian distributions
Examples of Nonlinear Models Observed image is a complex function of the 3D pose, other nearby objects & clutter, lighting conditions, camera calibration, etc. Dynamics implicitly determined by geophysical simulations
Nonlinear Filtering Prediction: Update:
Approximate Nonlinear Filters Typically cannot directly represent these continuous functions, or determine a closed form for the prediction integral A wide range of approximate nonlinear filters have thus been proposed, including Histogram filters Extended & unscented Kalman filters Particle filters
Nonlinear Filtering Taxonomy Histogram Filter: Evaluate on fixed discretization grid Only feasible in low dimensions Expensive or inaccurate Extended/Unscented Kalman Filter: Approximate posterior as Gaussian via linearization, quadrature, Inaccurate for multimodal posterior distributions Particle Filter: Dynamically evaluate states with highest probability Monte Carlo approximation
Importance Sampling true distribution (difficult to sample from) assume may be evaluated up to normalization Z proposal distribution (easy to sample from) Draw N weighted samples from proposal: Approximate the target distribution via a weighted mixture of delta functions: Nice asymptotic properties as
Particle Filters Condensation, Sequential Monte Carlo, Survival of the Fittest, Represent state estimates using a set of samples Dynamics provide proposal distribution for likelihood Sample-based density estimate Weight by observation likelihood Resample & propagate by dynamics
Particle Filtering Movie (M. Isard, 1996)
Particle Filtering Caveats Easy to implement, effective in many applications, BUT It can be difficult to know how many samples to use, or to tell when the approximation is poor Sometimes suffer catastrophic failures, where NO particles have significant posterior probability This is particularly true with “peaky” observations in high-dimensional spaces: likelihood dynamics
Continuous State HMMs There also exist algorithms for other learning & inference tasks in continuous-state HMMs: Smoothing Likelihood calculation & classification MAP state estimation Learning via ML parameter estimation For linear Gaussian state space models, these are easy generalizations of discrete HMM algorithms Nonlinear models can be more difficult
Outline Introduction to Sequential Processes Markov chains Hidden Markov models Discrete-State HMMs Inference: Filtering, smoothing, Viterbi, classification Learning: EM algorithm Continuous-State HMMs Linear state space models: Kalman filters Nonlinear dynamical systems: Particle filters More on Graphical Models
More on Graphical Models Many applications have rich structure, but are not simple time series or sequences: Physics-based model of a complex system Multi-user communication networks Hierarchical taxonomy of documents/webpages Spatial relationships among objects Genetic regulatory networks Your own research project? Graphical models provide a framework for: Specifying statistical models for complex systems Developing efficient learning algorithms Representing and reasoning about complex joint distributions.
Types of Graphical Models Nodes Random Variables Edges Probabilistic (Markov) Relationships Directed Graphs Specify a hierarchical, causal generative process (child nodes depend on parents) Undirected Graphs Specific symmetric, non-causal dependencies (soft or probabilistic constraints)
Quick Medical Reference (QMR) model A probabilistic graphical model for diagnosis with 600 disease nodes, 4000 finding nodes Node probabilities were assessed from an expert (Shwe et al., 1991) Want to compute posteriors: Is this tractable?
Directed Graphical Models AKA Bayes Net. Any distribution can be written as Here, if the variables are topologically sorted (parents come before children) Much simpler: an arbitrary is a huge (n-1) dimensional matrix. Inference: knowing the value of some of the nodes, infer the rest. Marginals, MAP
Plates A plate is a “macro” that allows subgraphs to be replicated Graphical representation of an exchangeability assumption for
Elimination Algorithm Takes a graphical model and produces one without a particular node puts the same probability distribution on the rest of the nodes. Very easy on trees, possible (though potentially computationally expensive) on general DAGs. If we eliminate all but one node, that tells us the distribution of that node.
Elimination Algorithm (cont) The symbolic counterpart of elimination is equivalent to triangulation of the graph Triangulation: remove the nodes sequentially; when a node is removed, connect all of its remaining neighbors The computational complexity of elimination scales as exponential in the size of the largest clique in the triangulated graph
Markov Random Fields in Vision Idea: Nearby pixels are similar. fMRI Analysis (Kim et. al. 2000) Image Denoising (Felzenszwalb & Huttenlocher 2004) Segmentation & Object Recognition (Verbeek & Triggs 2007)
Dynamic Bayesian Networks Specify and exploit internal structure in the hidden states underlying a time series. Generalizes HMMs Maneuver Mode Spatial Position Noisy Observations
DBN Hand Tracking Video Isard et. al., 1998
Topic Models for Documents D. Blei, 2007
Topics Learned from Science D. Blei, 2007
Temporal Topic Evolution D. Blei, 2007
Bioinformatics Protein Folding (Yanover & Weiss 2003) Computational Genomics (Xing & Sohn 2007)
Learning in Graphical Models Tree-Structured Graphs There are direct, efficient extensions of HMM learning and inference algorithms Graphs with Cycles Junction Tree: Cluster nodes to remove cycles (exact, but computation exponential in “distance” of graph from tree) Monte Carlo Methods: Approximate learning via simulation (Gibbs sampling, importance sampling, ) Variational Methods: Approximate learning via optimization (mean field, loopy belief propagation, )