Dimensions of natural disasters

32 Slides2.41 MB
Dimensions of natural disasters
Getting started You’ll need a notepad on which to make notes as you go along, or you could make notes or paste images, etc. on your device. You can view these slides: as a slide-show for any animations and to follow links in ‘normal’ view if you want to add call-outs or extra slides to make notes, paste images or answer questions. Geographical Association, 2022
Key A level concepts Tectonic, or sometimes weather, hazards is a required or optional topic in most A level specifications. Whichever specification you are studying, you will need to gain understanding of key A level concepts. In this unit, the concepts you will cover are: causality inequality mitigation and adaptation risk resilience thresholds. To help with understanding, look out for key terms and jot down definitions as you go along in the glossary, where there is also a final check for you. Geographical Association, 2022
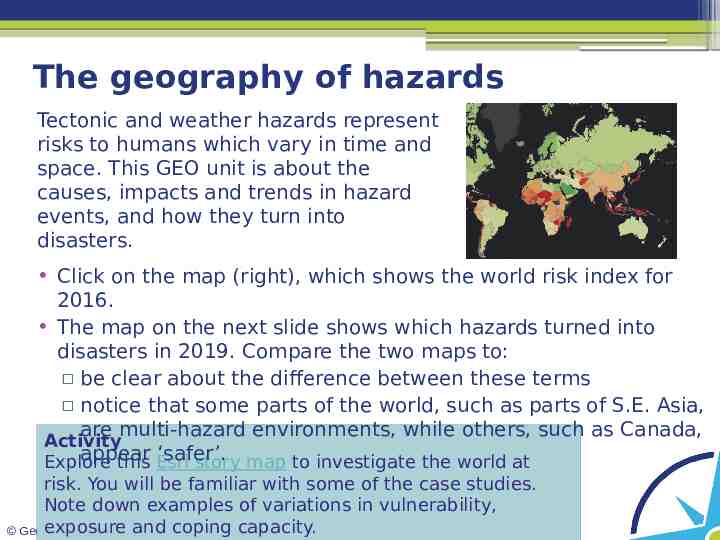
The geography of hazards Tectonic and weather hazards represent risks to humans which vary in time and space. This GEO unit is about the causes, impacts and trends in hazard events, and how they turn into disasters. Click on the map (right), which shows the world risk index for 2016. The map on the next slide shows which hazards turned into disasters in 2019. Compare the two maps to: be clear about the difference between these terms notice that some parts of the world, such as parts of S.E. Asia, are multi-hazard environments, while others, such as Canada, Activity appear ‘safer’. Explore this Esri story map to investigate the world at risk. You will be familiar with some of the case studies. Note down examples of variations in vulnerability, exposure and2022 coping capacity. Geographical Association,
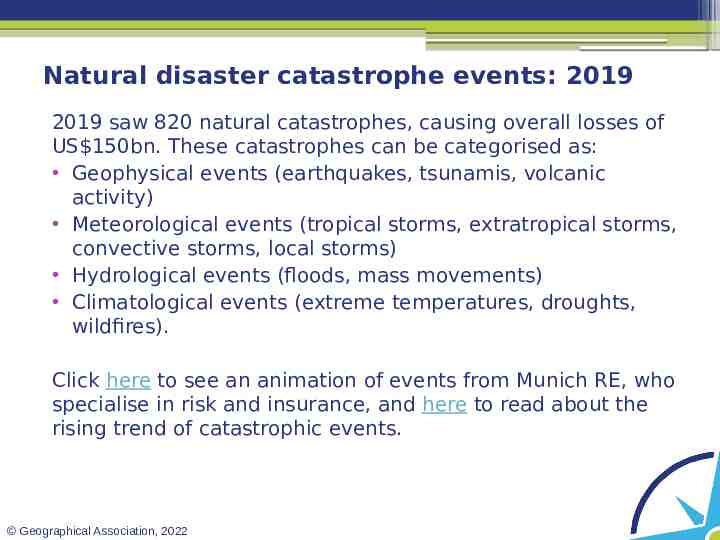
Natural disaster catastrophe events: 2019 2019 saw 820 natural catastrophes, causing overall losses of US 150bn. These catastrophes can be categorised as: Geophysical events (earthquakes, tsunamis, volcanic activity) Meteorological events (tropical storms, extratropical storms, convective storms, local storms) Hydrological events (floods, mass movements) Climatological events (extreme temperatures, droughts, wildfires). Click here to see an animation of events from Munich RE, who specialise in risk and insurance, and here to read about the rising trend of catastrophic events. Geographical Association, 2022
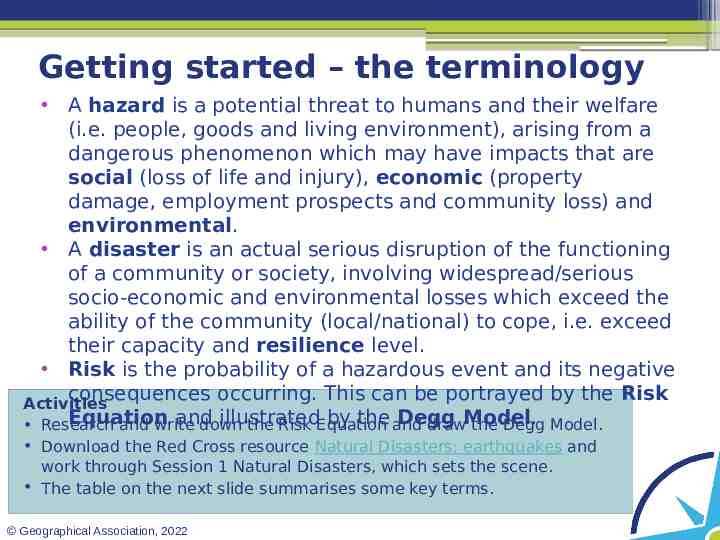
Getting started – the terminology A hazard is a potential threat to humans and their welfare (i.e. people, goods and living environment), arising from a dangerous phenomenon which may have impacts that are social (loss of life and injury), economic (property damage, employment prospects and community loss) and environmental. A disaster is an actual serious disruption of the functioning of a community or society, involving widespread/serious socio-economic and environmental losses which exceed the ability of the community (local/national) to cope, i.e. exceed their capacity and resilience level. Risk is the probability of a hazardous event and its negative consequences occurring. This can be portrayed by the Risk Activities Equation and illustrated by the and Degg Research and write down the Risk Equation drawModel. the Degg Model. Download the Red Cross resource Natural Disasters: earthquakes and work through Session 1 Natural Disasters, which sets the scene. The table on the next slide summarises some key terms. Geographical Association, 2022
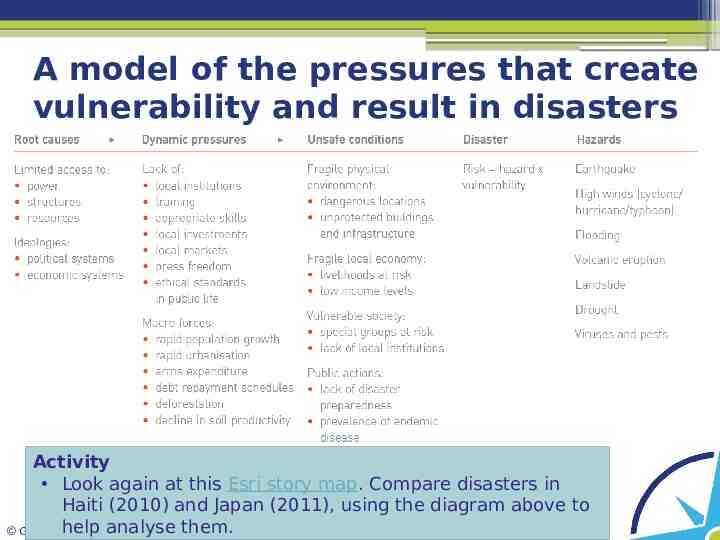
A model of the pressures that create vulnerability and result in disasters Activity Look again at this Esri story map. Compare disasters in Haiti (2010) and Japan (2011), using the diagram above to helpAssociation, analyse them. Geographical 2022
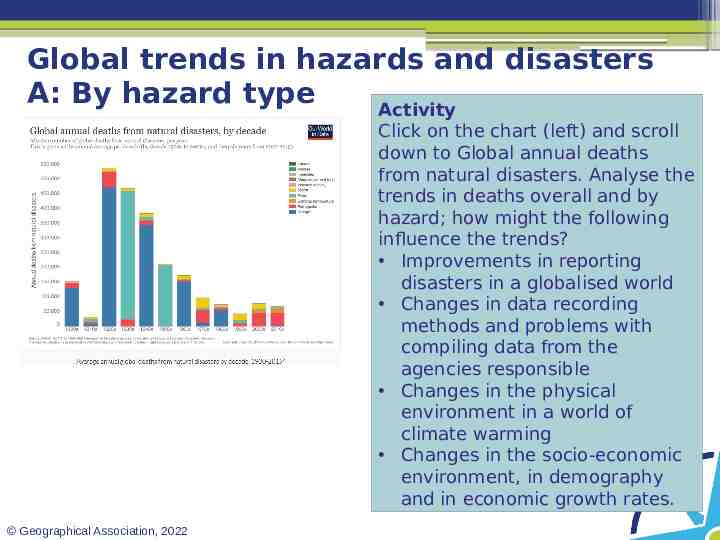
Global trends in hazards and disasters A: By hazard type Activity Click on the chart (left) and scroll down to Global annual deaths from natural disasters. Analyse the trends in deaths overall and by hazard; how might the following influence the trends? Improvements in reporting disasters in a globalised world Changes in data recording methods and problems with compiling data from the agencies responsible Changes in the physical environment in a world of climate warming Changes in the socio-economic environment, in demography and in economic growth rates. Geographical Association, 2022
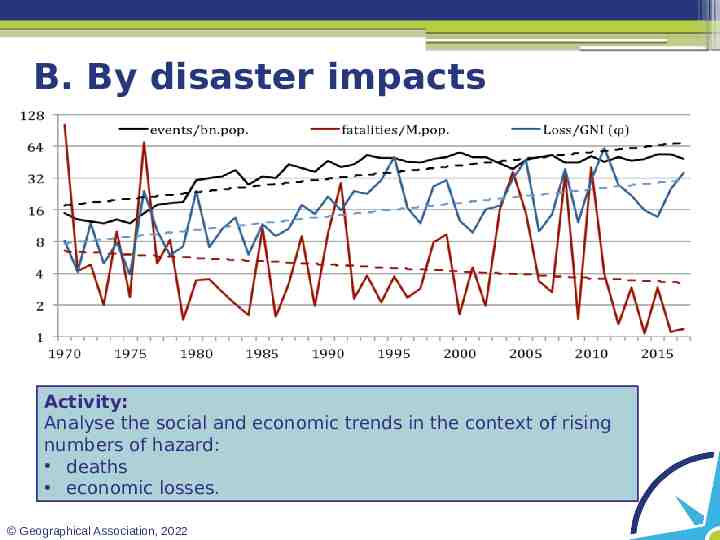
B. By disaster impacts Activity: Analyse the social and economic trends in the context of rising numbers of hazard: deaths economic losses. Geographical Association, 2022
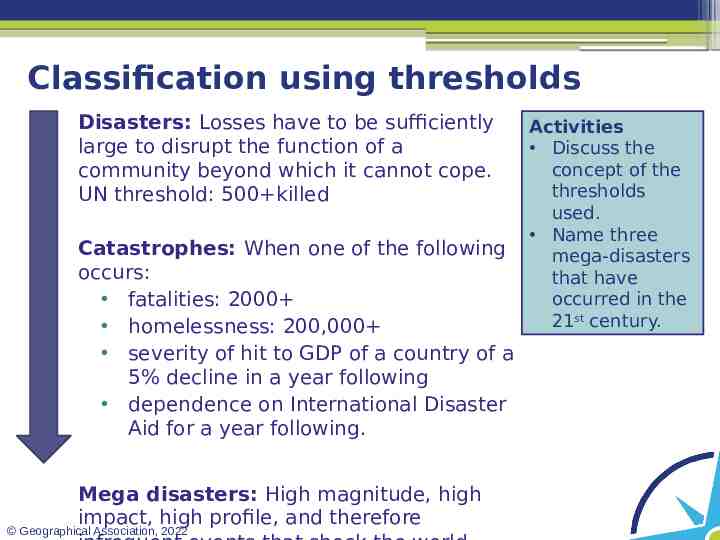
Classification using thresholds Disasters: Losses have to be sufficiently large to disrupt the function of a community beyond which it cannot cope. UN threshold: 500 killed Catastrophes: When one of the following occurs: fatalities: 2000 homelessness: 200,000 severity of hit to GDP of a country of a 5% decline in a year following dependence on International Disaster Aid for a year following. Mega disasters: High magnitude, high impact, high profile, and therefore Geographical Association, 2022 Activities Discuss the concept of the thresholds used. Name three mega-disasters that have occurred in the 21st century.
Dodgy data: where does bias creep in? Our perception of hazards can depend on how they are recorded and reported. Different types of bias can easily occur: Hazard bias: some agencies, e.g. NOAA, favour certain hazard types in their records. Dominance by mega-disaster or catastrophe; small disasters unimportant or missing. Temporal bias: problems of normalisation, for example of economic losses, or direct or indirect deaths (time delay). Problems of long duration, e.g. famine/drought. Accounting bias: e.g. are all types of loss included? Social and economic (direct/indirect; insured/uninsured?). Different thresholds for classification of disasters. Geographic bias: especially where hazard is transboundary across political or administrative boundaries or concerning many nations. Spatial bias: absolute vs relative impact, e.g. economic losses. Quality of governance and its infrastructure. Purpose of compiler, e.g. insurance company or aid agency. Problems of aggregation Geographical Association, 2022
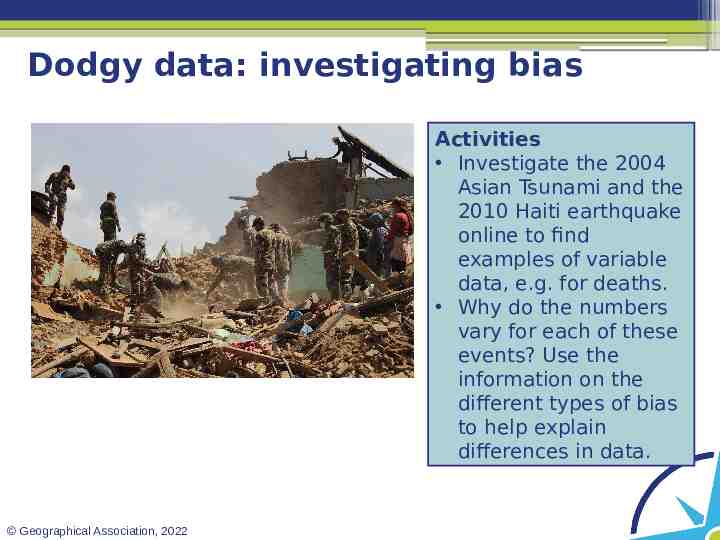
Dodgy data: investigating bias Activities Investigate the 2004 Asian Tsunami and the 2010 Haiti earthquake online to find examples of variable data, e.g. for deaths. Why do the numbers vary for each of these events? Use the information on the different types of bias to help explain differences in data. Geographical Association, 2022
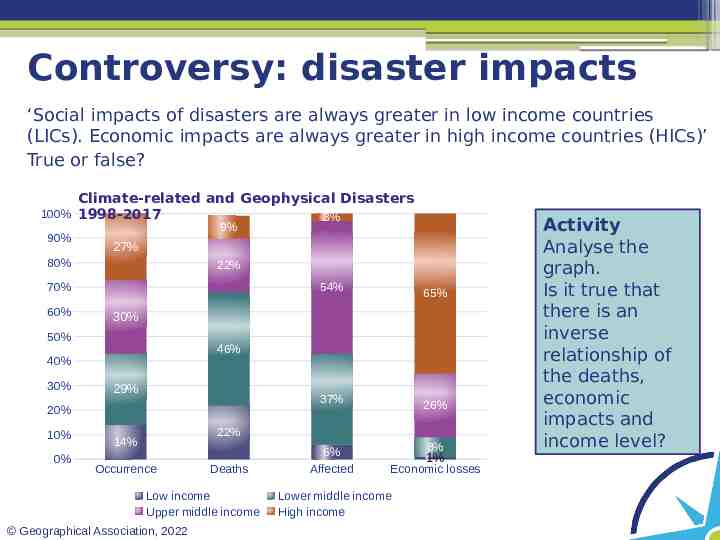
Controversy: disaster impacts ‘Social impacts of disasters are always greater in low income countries (LICs). Economic impacts are always greater in high income countries (HICs)’ True or false? Climate-related and Geophysical Disasters 100% 1998-2017 3% 90% 9% 27% 80% 22% 70% 60% 54% 30% 50% 46% 40% 30% 29% 37% 20% 10% 0% 65% 26% 22% 14% Occurrence Deaths Low income Upper middle income Geographical Association, 2022 6% Affected 8% 1% Economic losses Lower middle income High income Activity Analyse the graph. Is it true that there is an inverse relationship of the deaths, economic impacts and income level?
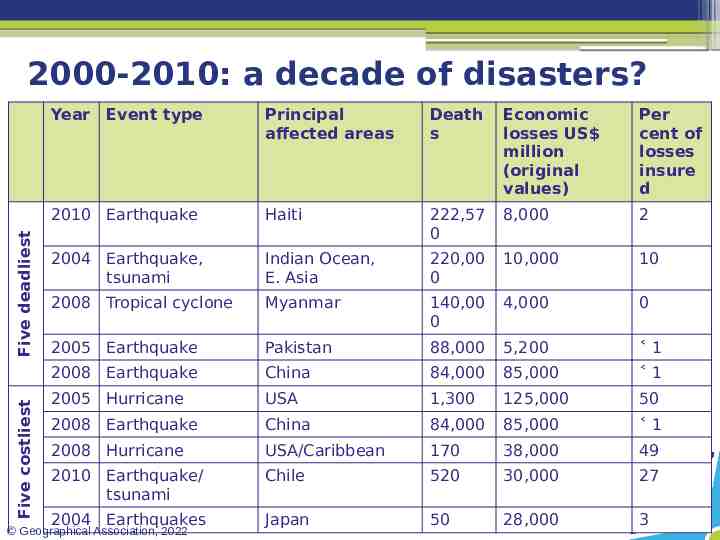
2000-2010: a decade of disasters? Five costliest Five deadliest Year Event type Principal affected areas Death s Economic losses US million (original values) Per cent of losses insure d 2010 Earthquake Haiti 222,57 0 8,000 2 2004 Earthquake, tsunami Indian Ocean, E. Asia 220,00 0 10,000 10 2008 Tropical cyclone Myanmar 140,00 0 4,000 0 2005 Earthquake Pakistan 88,000 5,200 1 2008 Earthquake China 84,000 85,000 1 2005 Hurricane USA 1,300 125,000 50 2008 Earthquake China 84,000 85,000 1 2008 Hurricane USA/Caribbean 170 38,000 49 2010 Earthquake/ tsunami Chile 520 30,000 27 2004 Earthquakes Japan 50 28,000 3 Geographical Association, 2022
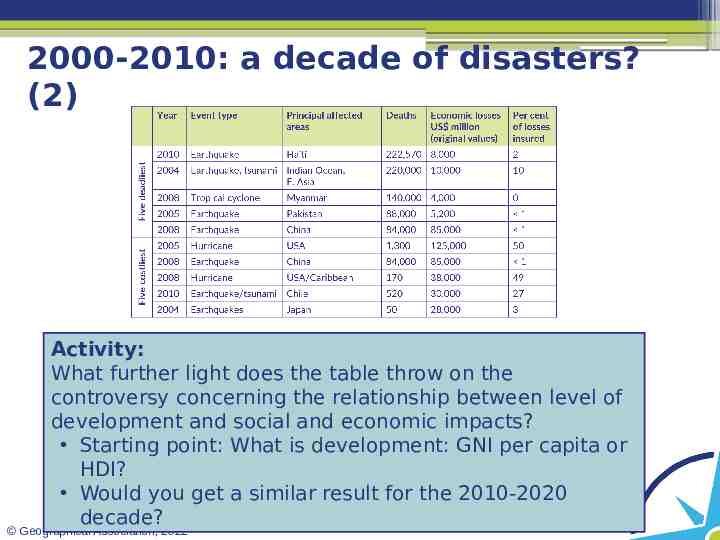
2000-2010: a decade of disasters? (2) Activity: What further light does the table throw on the controversy concerning the relationship between level of development and social and economic impacts? Starting point: What is development: GNI per capita or HDI? Would you get a similar result for the 2010-2020 decade? Geographical Association, 2022
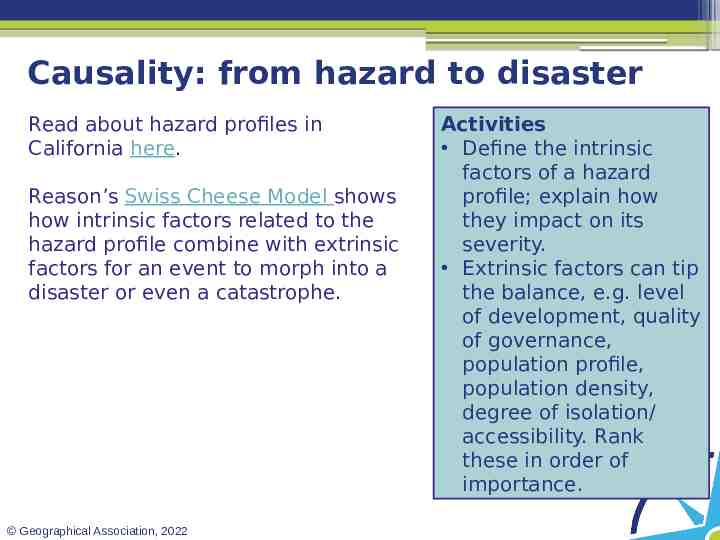
Causality: from hazard to disaster Read about hazard profiles in California here. Reason’s Swiss Cheese Model shows how intrinsic factors related to the hazard profile combine with extrinsic factors for an event to morph into a disaster or even a catastrophe. Geographical Association, 2022 Activities Define the intrinsic factors of a hazard profile; explain how they impact on its severity. Extrinsic factors can tip the balance, e.g. level of development, quality of governance, population profile, population density, degree of isolation/ accessibility. Rank these in order of importance.
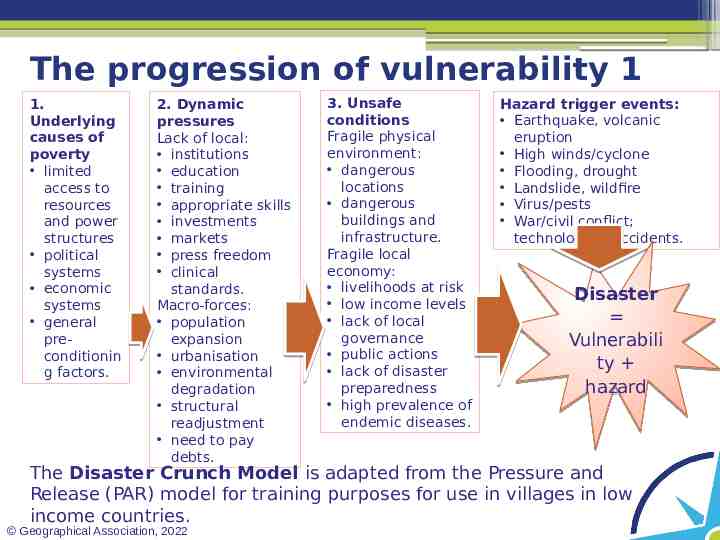
The progression of vulnerability 1 1. Underlying causes of poverty limited access to resources and power structures political systems economic systems general preconditionin g factors. 2. Dynamic pressures Lack of local: institutions education training appropriate skills investments markets press freedom clinical standards. Macro-forces: population expansion urbanisation environmental degradation structural readjustment need to pay debts. 3. Unsafe conditions Fragile physical environment: dangerous locations dangerous buildings and infrastructure. Fragile local economy: livelihoods at risk low income levels lack of local governance public actions lack of disaster preparedness high prevalence of endemic diseases. Hazard trigger events: Earthquake, volcanic eruption High winds/cyclone Flooding, drought Landslide, wildfire Virus/pests War/civil conflict; technological accidents. Disaster Vulnerabili ty hazard The Disaster Crunch Model is adapted from the Pressure and Release (PAR) model for training purposes for use in villages in low income countries. Geographical Association, 2022
The progression of vulnerability 2 Group Activity Review the Disaster Crunch Model on the previous slide. Take on the role of the village council and trainer. Select an example of either a tectonic or weather/climate event to discuss. As a trainer, check that your group understand the wording, e.g. limited access to power structures, environmental degradation, unsafe buildings, endemic diseases. Work through the concept of the progression of vulnerability to ensure that it is well understood and then prepare a ten-point plan for developing resilience. Identify people and places that exacerbate vulnerability. Use the Red Cross resource Section 2 to view earthquake case studies on Nepal (Gorkha) 2015, Geographical Association, 2022
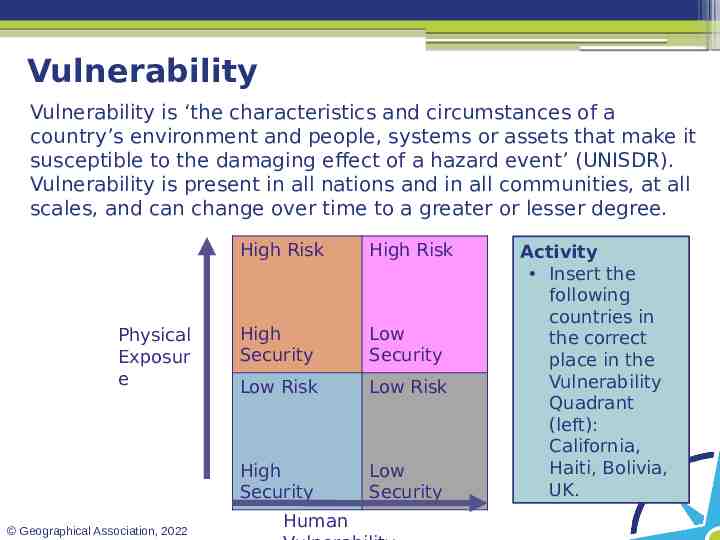
Vulnerability Vulnerability is ‘the characteristics and circumstances of a country’s environment and people, systems or assets that make it susceptible to the damaging effect of a hazard event’ (UNISDR). Vulnerability is present in all nations and in all communities, at all scales, and can change over time to a greater or lesser degree. Physical Exposur e Geographical Association, 2022 High Risk High Risk High Security Low Security Low Risk Low Risk High Security Low Security Human Activity Insert the following countries in the correct place in the Vulnerability Quadrant (left): California, Haiti, Bolivia, UK.
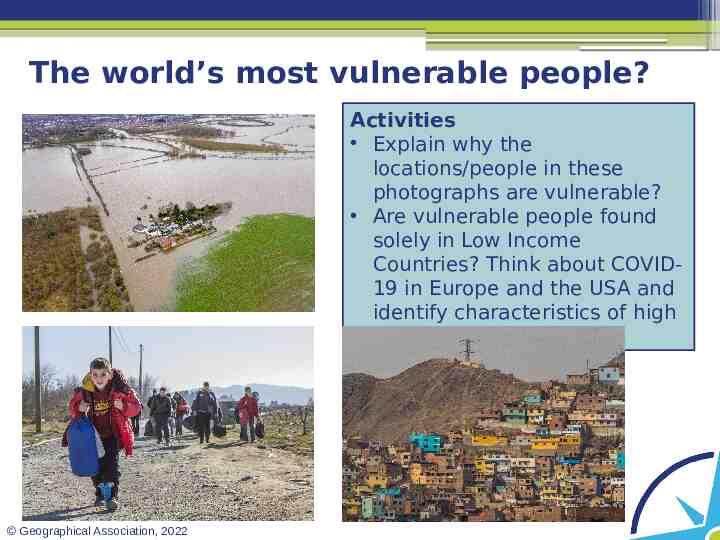
The world’s most vulnerable people? Activities Explain why the locations/people in these photographs are vulnerable? Are vulnerable people found solely in Low Income Countries? Think about COVID19 in Europe and the USA and identify characteristics of high vulnerability. Geographical Association, 2022
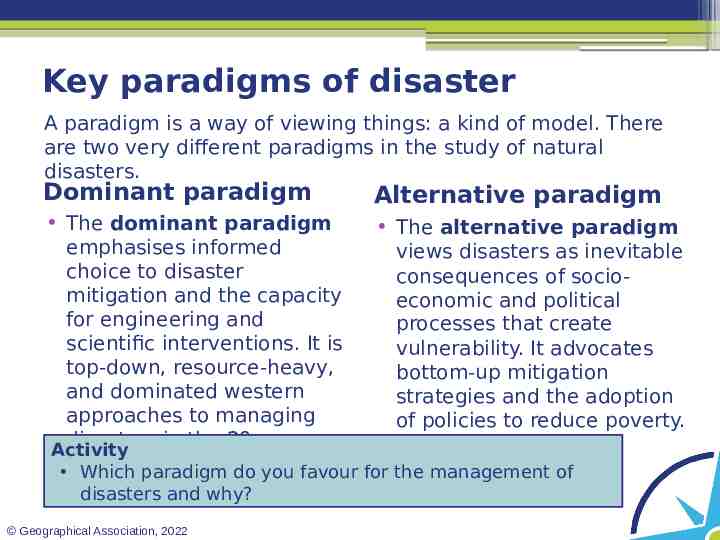
Key paradigms of disaster A paradigm is a way of viewing things: a kind of model. There are two very different paradigms in the study of natural disasters. Dominant paradigm Alternative paradigm The dominant paradigm The alternative paradigm emphasises informed views disasters as inevitable choice to disaster consequences of sociomitigation and the capacity economic and political for engineering and processes that create scientific interventions. It is vulnerability. It advocates top-down, resource-heavy, bottom-up mitigation and dominated western strategies and the adoption approaches to managing of policies to reduce poverty. disasters in the 20th Activity century. Which paradigm do you favour for the management of disasters and why? Geographical Association, 2022
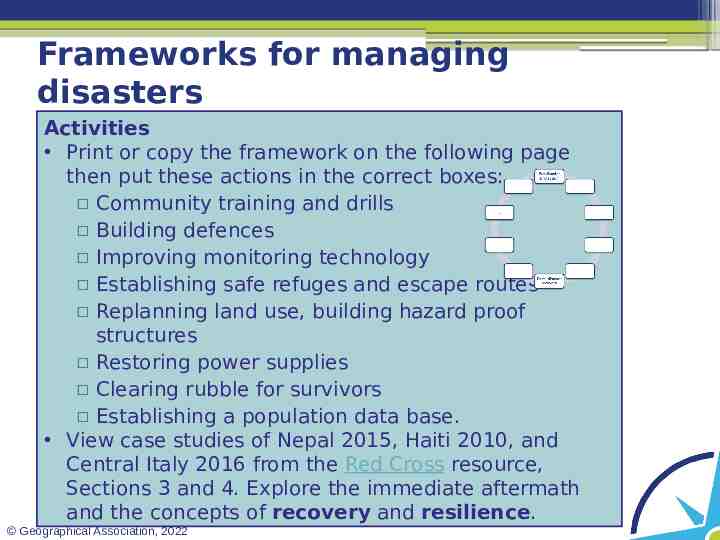
Frameworks for managing disasters Activities Print or copy the framework on the following page then put these actions in the correct boxes: Community training and drills Building defences Improving monitoring technology Establishing safe refuges and escape routes Replanning land use, building hazard proof structures Restoring power supplies Clearing rubble for survivors Establishing a population data base. View case studies of Nepal 2015, Haiti 2010, and Central Italy 2016 from the Red Cross resource, Sections 3 and 4. Explore the immediate aftermath and the concepts of recovery and resilience. Geographical Association, 2022
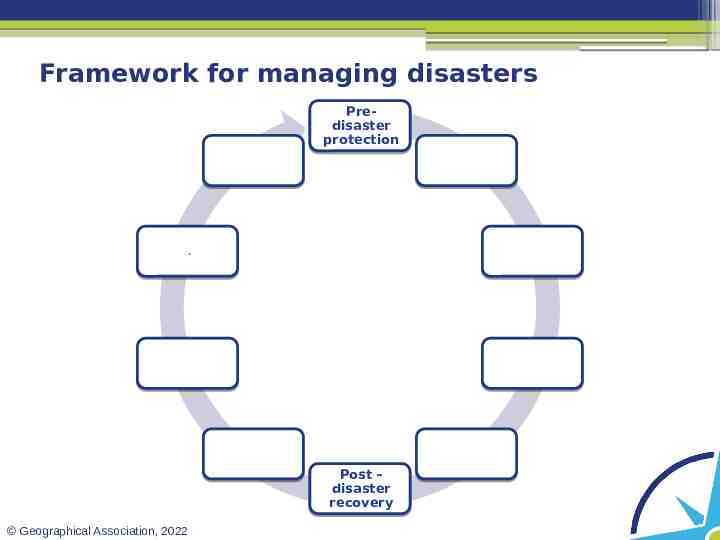
Framework for managing disasters Predisaster protection . Post – disaster recovery Geographical Association, 2022
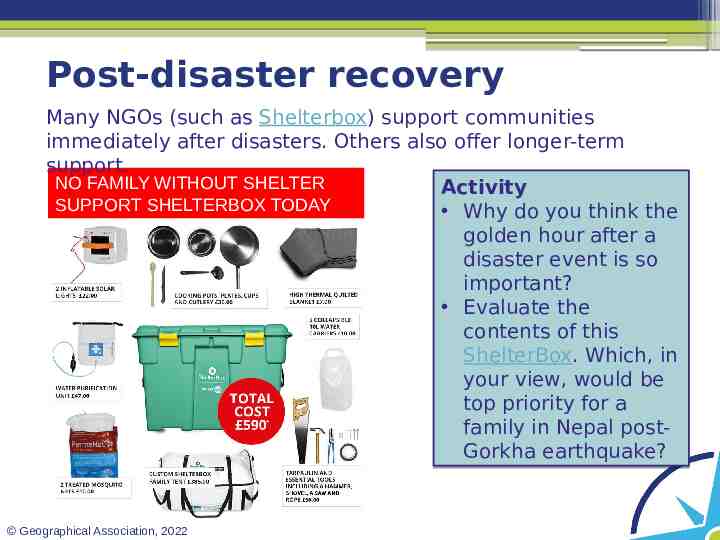
Post-disaster recovery Many NGOs (such as Shelterbox) support communities immediately after disasters. Others also offer longer-term support. NO FAMILY WITHOUT SHELTER Activity SUPPORT SHELTERBOX TODAY Why do you think the golden hour after a disaster event is so important? Evaluate the contents of this ShelterBox. Which, in your view, would be top priority for a family in Nepal postGorkha earthquake? Geographical Association, 2022
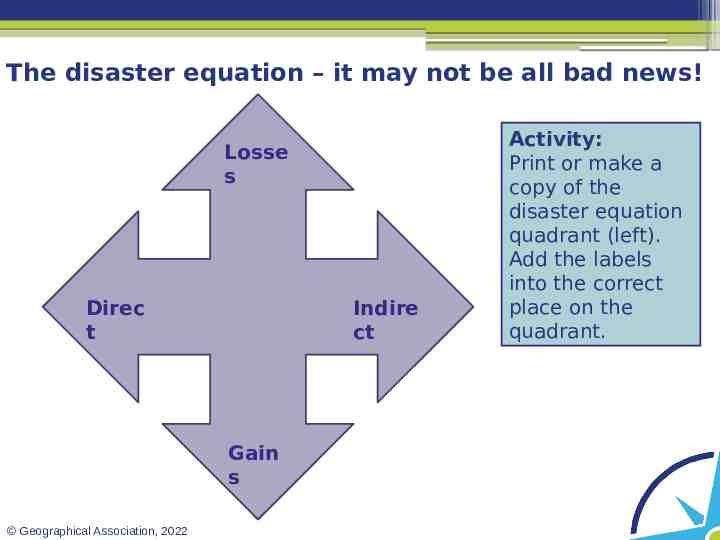
The disaster equation – it may not be all bad news! Losse s Direc t Indire ct Gain s Geographical Association, 2022 Activity: Print or make a copy of the disaster equation quadrant (left). Add the labels into the correct place on the quadrant.
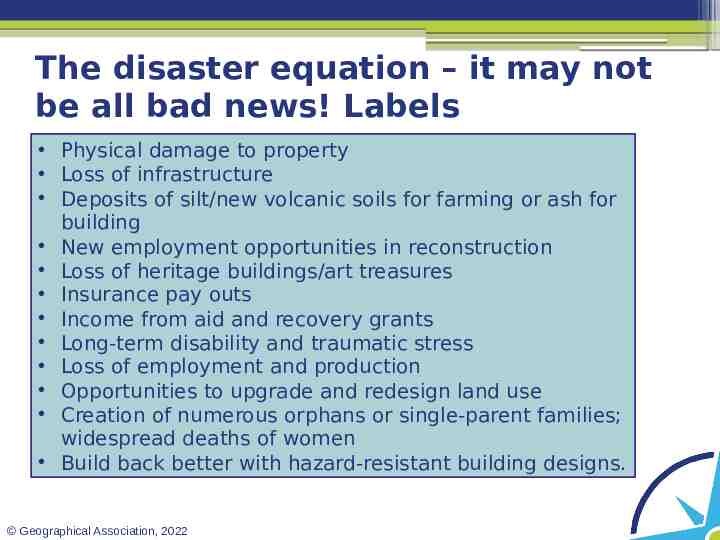
The disaster equation – it may not be all bad news! Labels Physical damage to property Loss of infrastructure Deposits of silt/new volcanic soils for farming or ash for building New employment opportunities in reconstruction Loss of heritage buildings/art treasures Insurance pay outs Income from aid and recovery grants Long-term disability and traumatic stress Loss of employment and production Opportunities to upgrade and redesign land use Creation of numerous orphans or single-parent families; widespread deaths of women Build back better with hazard-resistant building designs. Geographical Association, 2022
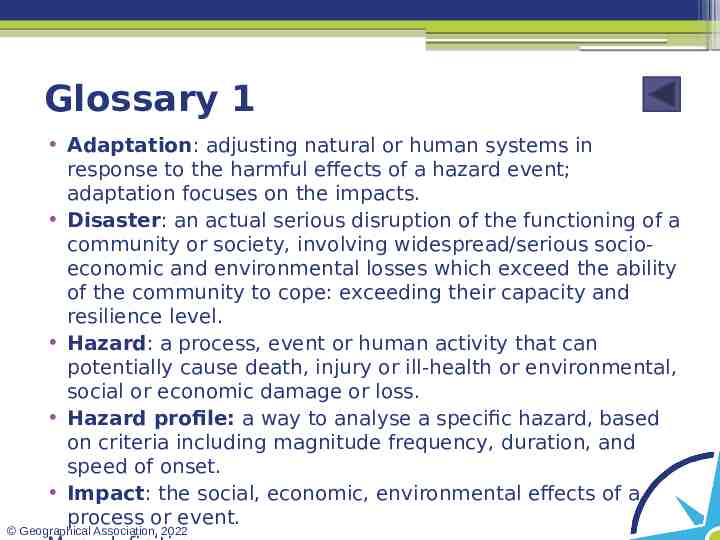
Glossary 1 Adaptation: adjusting natural or human systems in response to the harmful effects of a hazard event; adaptation focuses on the impacts. Disaster: an actual serious disruption of the functioning of a community or society, involving widespread/serious socioeconomic and environmental losses which exceed the ability of the community to cope: exceeding their capacity and resilience level. Hazard: a process, event or human activity that can potentially cause death, injury or ill-health or environmental, social or economic damage or loss. Hazard profile: a way to analyse a specific hazard, based on criteria including magnitude frequency, duration, and speed of onset. Impact: the social, economic, environmental effects of a process or event. Geographical Association, 2022
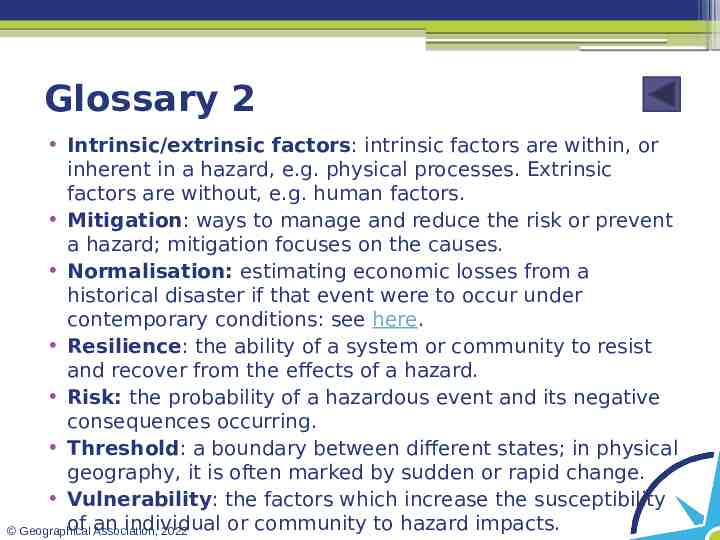
Glossary 2 Intrinsic/extrinsic factors: intrinsic factors are within, or inherent in a hazard, e.g. physical processes. Extrinsic factors are without, e.g. human factors. Mitigation: ways to manage and reduce the risk or prevent a hazard; mitigation focuses on the causes. Normalisation: estimating economic losses from a historical disaster if that event were to occur under contemporary conditions: see here. Resilience: the ability of a system or community to resist and recover from the effects of a hazard. Risk: the probability of a hazardous event and its negative consequences occurring. Threshold: a boundary between different states; in physical geography, it is often marked by sudden or rapid change. Vulnerability: the factors which increase the susceptibility of an individual or community to hazard impacts. Geographical Association, 2022
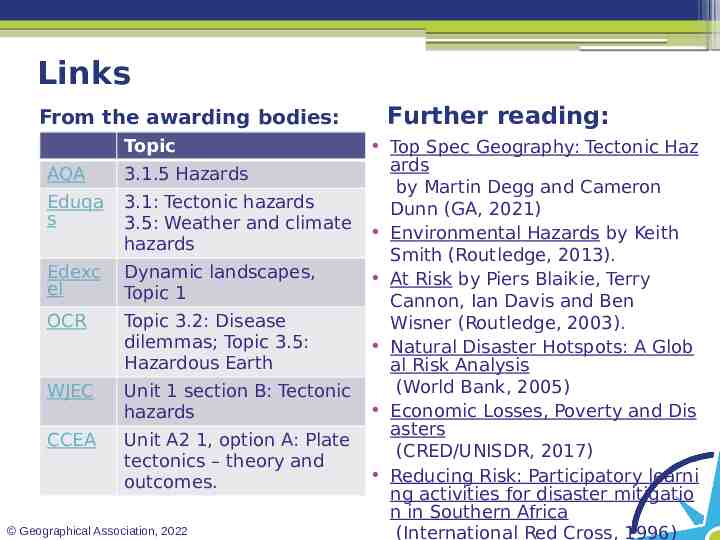
Links From the awarding bodies: Topic AQA 3.1.5 Hazards Eduqa s 3.1: Tectonic hazards 3.5: Weather and climate hazards Edexc el Dynamic landscapes, Topic 1 OCR Topic 3.2: Disease dilemmas; Topic 3.5: Hazardous Earth WJEC Unit 1 section B: Tectonic hazards CCEA Unit A2 1, option A: Plate tectonics – theory and outcomes. Geographical Association, 2022 Further reading: Top Spec Geography: Tectonic Haz ards by Martin Degg and Cameron Dunn (GA, 2021) Environmental Hazards by Keith Smith (Routledge, 2013). At Risk by Piers Blaikie, Terry Cannon, Ian Davis and Ben Wisner (Routledge, 2003). Natural Disaster Hotspots: A Glob al Risk Analysis (World Bank, 2005) Economic Losses, Poverty and Dis asters (CRED/UNISDR, 2017) Reducing Risk: Participatory learni ng activities for disaster mitigatio n in Southern Africa (International Red Cross, 1996)
Taking it further Achieving depth Depending on whether you are studying a unit on Geophysical Tectonic and/or Weather and Climate Hazards, use Google Scholar to read, research and build on frameworks for learning. There is a plethora of useful academic articles which will enable you to support your frameworks with detailed and recent examples. Futures This very useful 2019 report builds on the Sendai agreement; it explores risk informed sustainable development, looking at a whole series of future agencies including: Paris Agreement New Urban Agenda 2030 Agenda Geographical Association, 2022
Taking it further Reflection Geo: Reading around Tectonic Processes and Landforms Refer back to the specialised concepts and make sure that you really understand them in a hazard context, namely: causality, risk, vulnerability, resilience, threshold, mitigation and adaptation. Read Top Spec Geography Tectonic Hazards Chapter 6. Think about recent trends in hazards and the global challenge to reduce both the risk and impacts from disasters. 1990–2000 was the decade designated by the UN for Reducing Risk from Disasters. Interdependence and inequality make it everybody’s business to build cultures of prevention. Geographical Association, 2022
Acknowledgements This presentation has been written by Sue Warn, an experienced author and former Chief Examiner. Credits Sources of trend data: www.cred.be (EMDAT base) www.munich.re (Annual review of hazards and report on economic losses) www.researchgate (Natural disaster statistics by year). Slide 4: Esri UK Slide 7: Geographical Association Slide 8: Our World in Data Slide 9: Nicolas Boccard Slide 12: arindambanerjee/Shutterstock Slide 20: BalkansCat/Shutterstock, LDMedia/Shutterstock, Nowaczyk/Shutterstock Slide 24: Shelterbox Geographical Association, 2022