Data Visualization CSCE 447/679, VIST 476, VIZA 676 Frank
17 Slides2.45 MB
Data Visualization CSCE 447/679, VIST 476, VIZA 676 Frank Shipman https://people.engr.tamu.edu/shipman/courses/datavis/home.html
About Me Joined TAMU Computer Science in 1995 Previously worked at Xerox PARC, Siemens Research, and Baylor College of Medicine Studied at University of Colorado Boulder and Rice University Work at the intersection of human-computer interaction, artificial intelligence and content analysis One focus: Exploring how to help users interpret content and express interpretations of content Some papers from this work are included in the readings for the semester
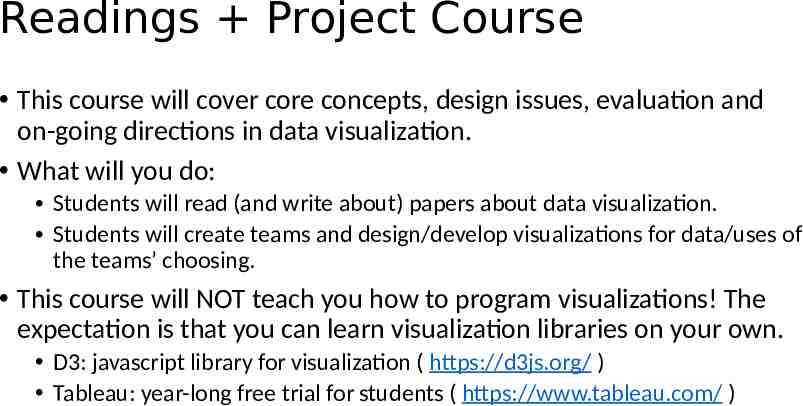
Readings Project Course This course will cover core concepts, design issues, evaluation and on-going directions in data visualization. What will you do: Students will read (and write about) papers about data visualization. Students will create teams and design/develop visualizations for data/uses of the teams’ choosing. This course will NOT teach you how to program visualizations! The expectation is that you can learn visualization libraries on your own. D3: javascript library for visualization ( https://d3js.org/ ) Tableau: year-long free trial for students ( https://www.tableau.com/ )
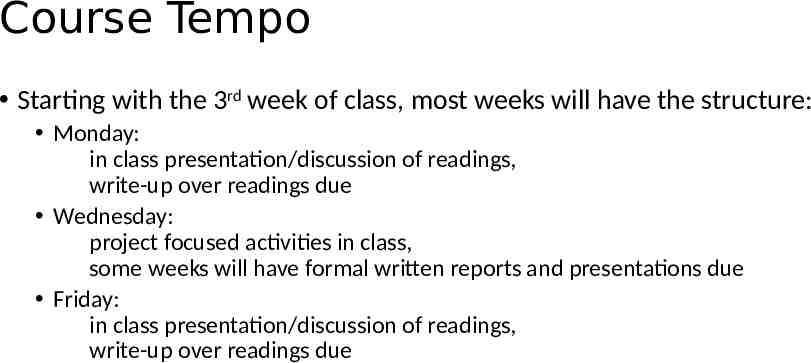
Course Tempo Starting with the 3rd week of class, most weeks will have the structure: Monday: in class presentation/discussion of readings, write-up over readings due Wednesday: project focused activities in class, some weeks will have formal written reports and presentations due Friday: in class presentation/discussion of readings, write-up over readings due
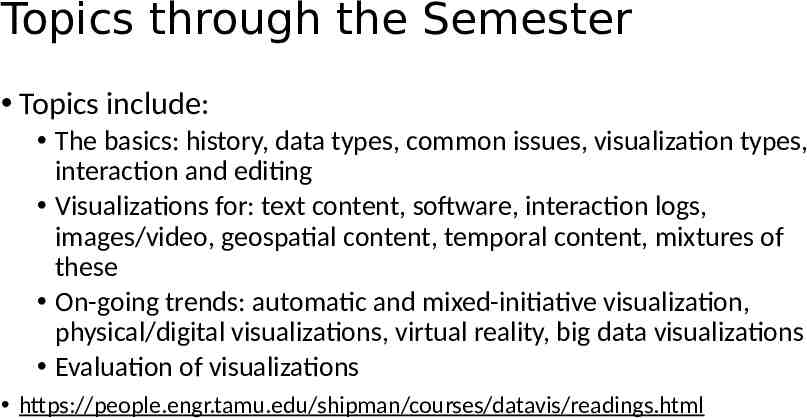
Topics through the Semester Topics include: The basics: history, data types, common issues, visualization types, interaction and editing Visualizations for: text content, software, interaction logs, images/video, geospatial content, temporal content, mixtures of these On-going trends: automatic and mixed-initiative visualization, physical/digital visualizations, virtual reality, big data visualizations Evaluation of visualizations https://people.engr.tamu.edu/shipman/courses/datavis/readings.html
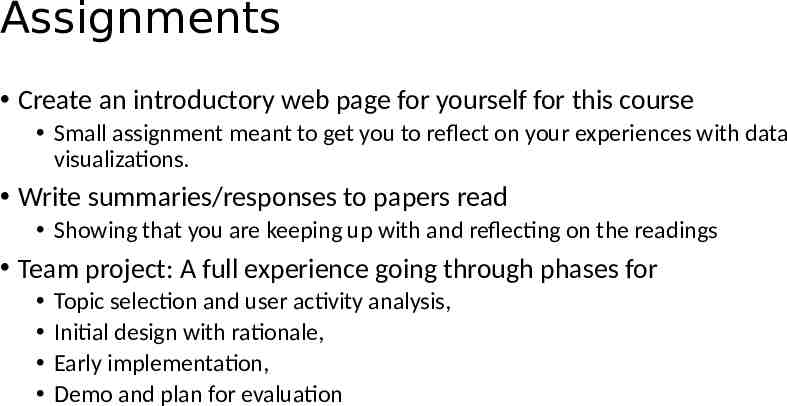
Assignments Create an introductory web page for yourself for this course Small assignment meant to get you to reflect on your experiences with data visualizations. Write summaries/responses to papers read Showing that you are keeping up with and reflecting on the readings Team project: A full experience going through phases for Topic selection and user activity analysis, Initial design with rationale, Early implementation, Demo and plan for evaluation
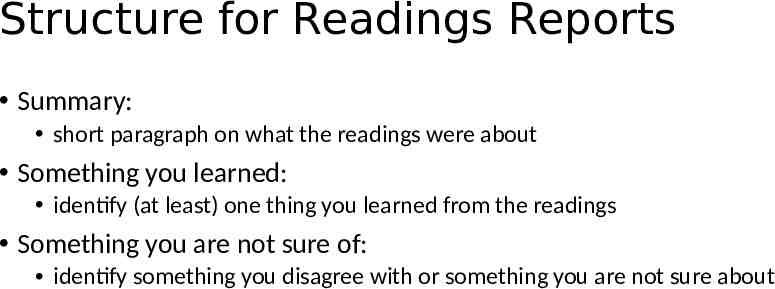
Structure for Readings Reports Summary: short paragraph on what the readings were about Something you learned: identify (at least) one thing you learned from the readings Something you are not sure of: identify something you disagree with or something you are not sure about
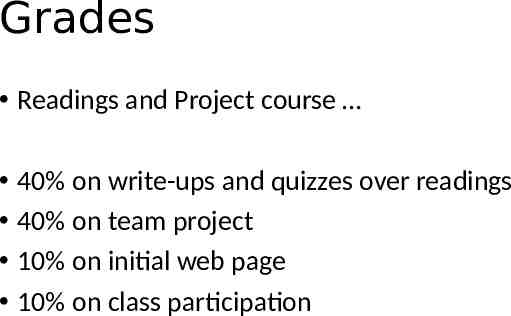
Grades Readings and Project course 40% on write-ups and quizzes over readings 40% on team project 10% on initial web page 10% on class participation
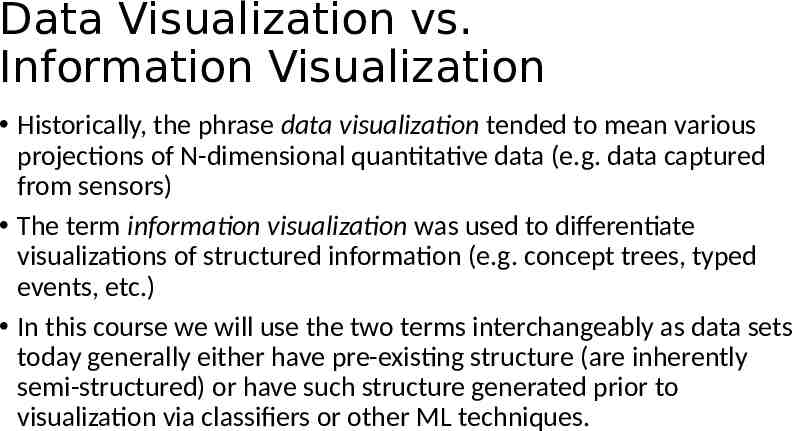
Data Visualization vs. Information Visualization Historically, the phrase data visualization tended to mean various projections of N-dimensional quantitative data (e.g. data captured from sensors) The term information visualization was used to differentiate visualizations of structured information (e.g. concept trees, typed events, etc.) In this course we will use the two terms interchangeably as data sets today generally either have pre-existing structure (are inherently semi-structured) or have such structure generated prior to visualization via classifiers or other ML techniques.
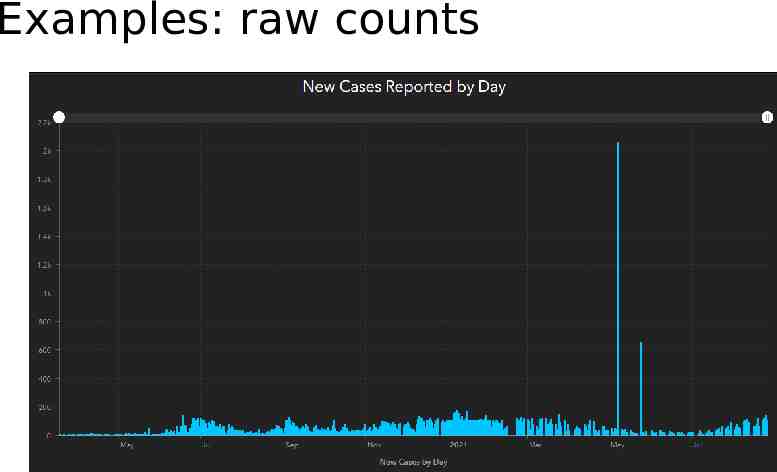
Examples: raw counts
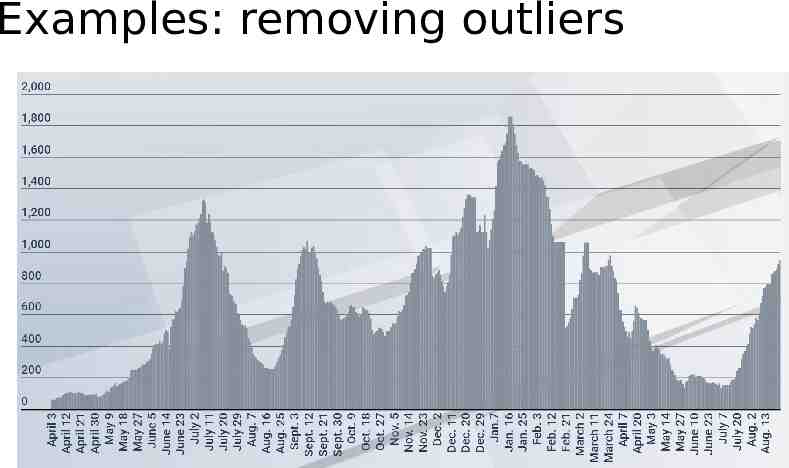
Examples: removing outliers
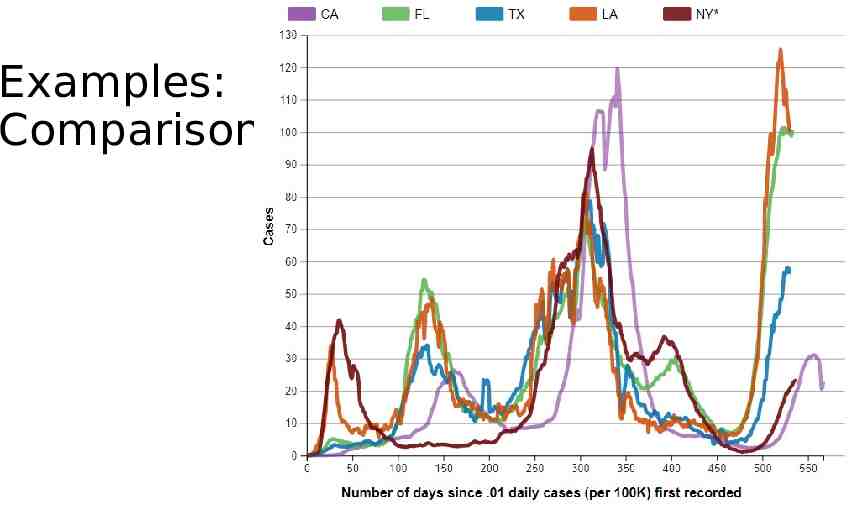
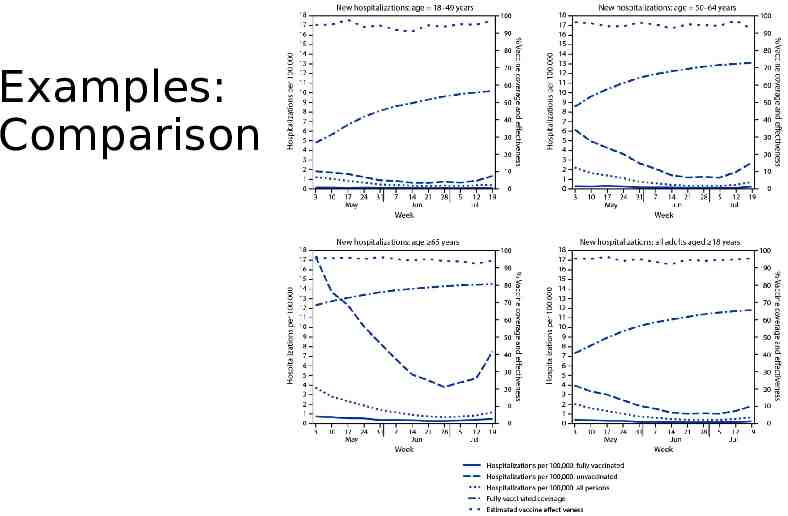
Examples: Comparison
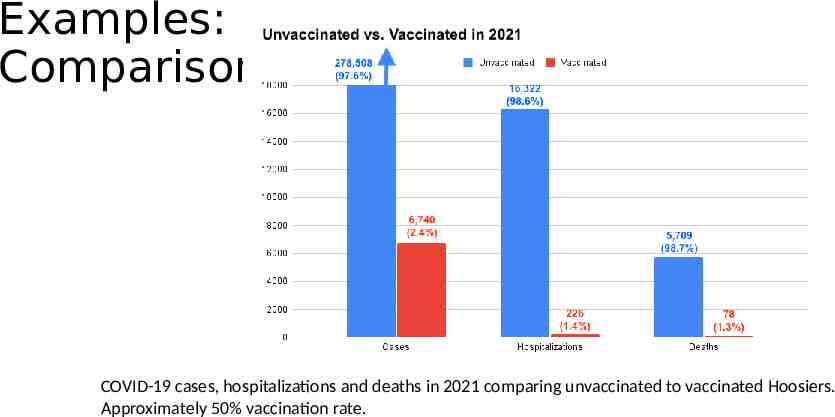
Examples: Comparison COVID-19 cases, hospitalizations and deaths in 2021 comparing unvaccinated to vaccinated Hoosiers. Approximately 50% vaccination rate.
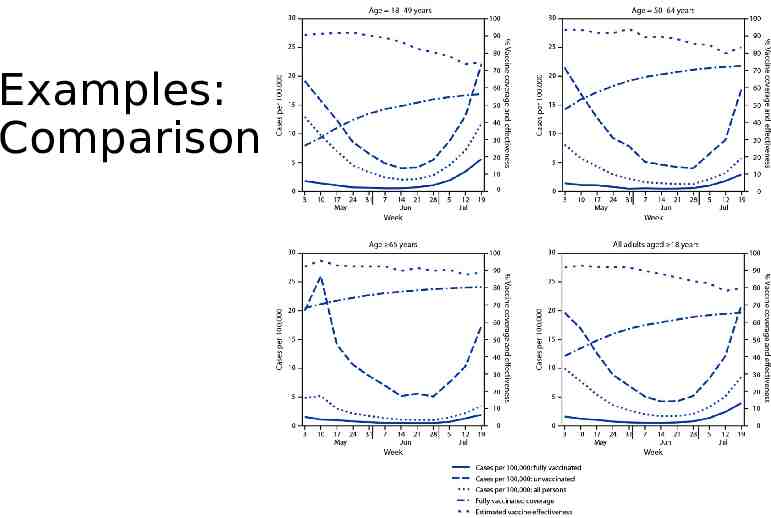
Examples: Comparison
Examples: Comparison
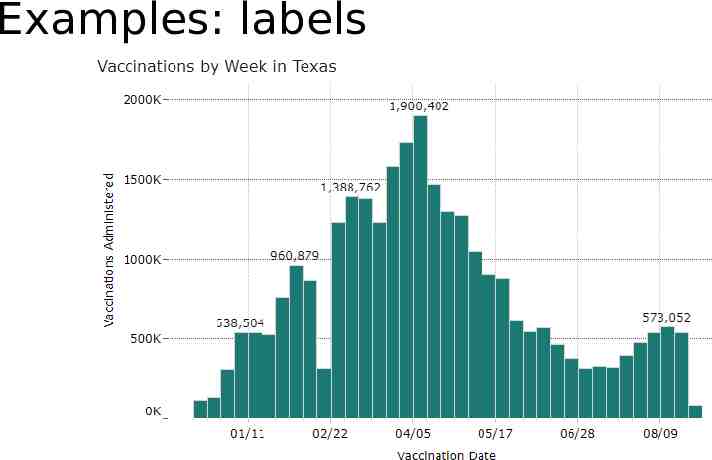
Examples: labels
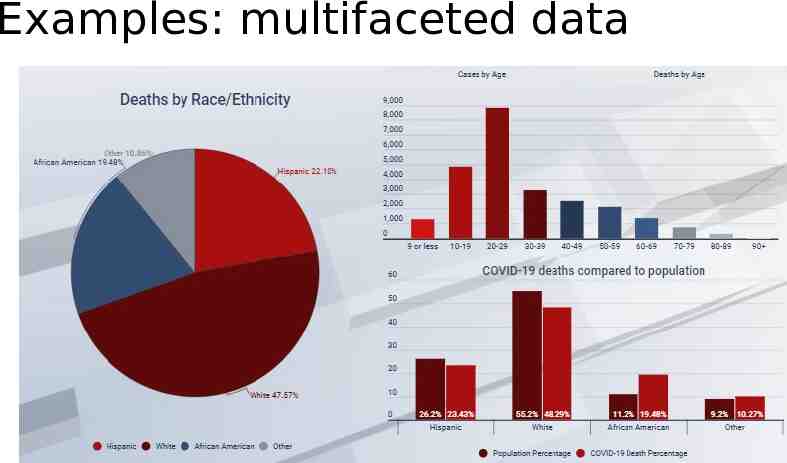
Examples: multifaceted data