CORPORATE 9M 2023 PRESENTATION


27 Slides3.81 MB
CORPORATE 9M 2023 PRESENTATION
1. AUSTRIACARD Group Overview 2. Key Investment Highlights Contents 3. Industry Overview & Market Trends 4. Appendix
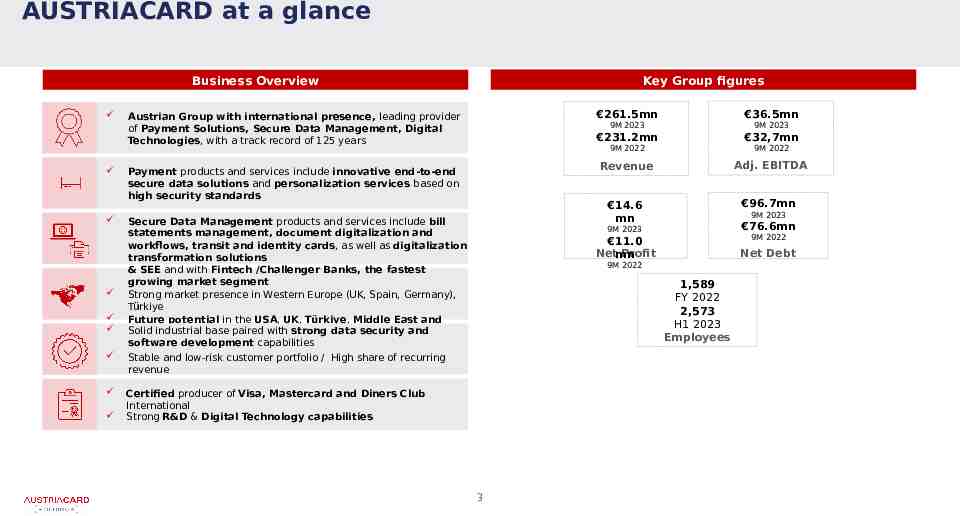
AUSTRIACARD at a glance Business Overview Key Group figures 36.5mn 261.5mn Austrian Group with international presence, leading provider of Payment Solutions, Secure Data Management, Digital Technologies, with a track record of 125 years Payment products and services include innovative end-to-end secure data solutions and personalization services based on high security standards Secure Data Management products and services include bill statements management, document digitalization and workflows, transit and identity cards, as well as digitalization transformation solutions Market leader for payment products in Nordics, Austria, CEE & SEE and with Fintech /Challenger Banks, the fastest growing market segment Strong market presence in Western Europe (UK, Spain, Germany), Türkiye Future potential in the USA, UK, Türkiye, Middle East and Solid industrial base paired with strong data security and Africa software development capabilities Stable and low-risk customer portfolio / High share of recurring revenue 9M 2023 9M 2023 231.2mn 32,7mn 9M 2022 9M 2022 Revenue Adj. EBITDA 14.6 mn 96.7mn 9M 2023 9M 2023 76.6mn 11.0 Netmn Profit Net Debt 9M 2022 9M 2022 1,589 FY 2022 2,573 H1 2023 Employees Certified producer of Visa, Mastercard and Diners Club International Strong R&D & Digital Technology capabilities 3
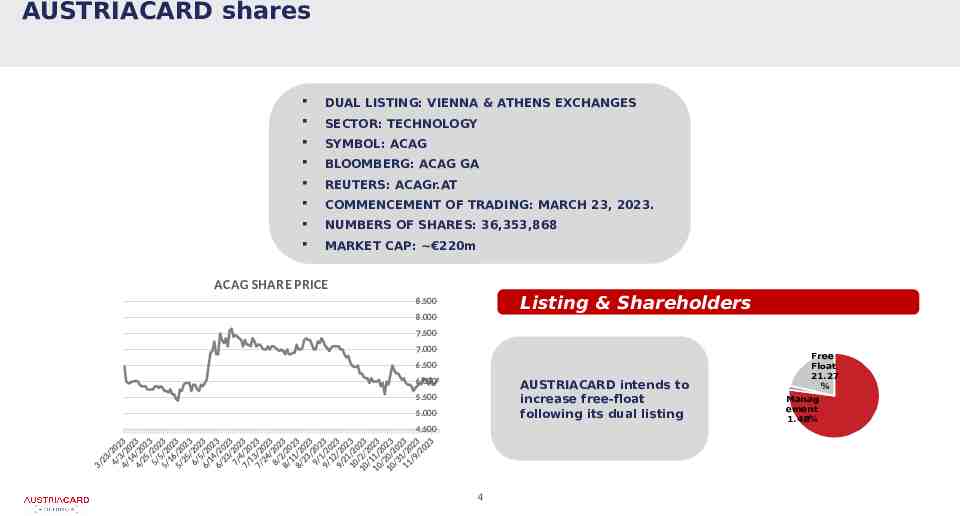
AUSTRIACARD shares DUAL LISTING: VIENNA & ATHENS EXCHANGES SECTOR: TECHNOLOGY SYMBOL: ACAG BLOOMBERG: ACAG GA REUTERS: ACAGr.AT COMMENCEMENT OF TRADING: MARCH 23, 2023. NUMBERS OF SHARES: 36,353,868 MARKET CAP: 220m ACAG SHARE PRICE Listing & Shareholders 8.500 8.000 7.500 7.000 6.500 6.000 AUSTRIACARD intends to increase free-float following its dual listing 5.500 5.000 4.500 3 3 3 3 3 3 3 3 3 3 3 3 3 3 3 3 3 3 3 3 3 3 2 2 2 2 2 2 2 2 2 2 2 2 2 2 2 2 2 2 2 2 2 2 23 23 20 /20 /20 /20 /20 /20 /20 /20 /20 /20 /20 /20 /20 /20 /20 /20 /20 /20 /20 /20 /20 /20 /20 /20 / 23 /3 14 25 /5 16 25 /5 14 23 /4 13 24 /2 11 23 /1 12 21 /2 11 20 31 /9 3/ 4 4/ 4/ 5 5/ 5/ 6 6/ 6/ 7 7/ 7/ 8 8/ 8/ 9 9/ 9/ 10 10/ 10/ 10/ 11 Free Float 21.27 % Manag ement 1.48% Mr.Nik olaos Lykos 77.25 % 4
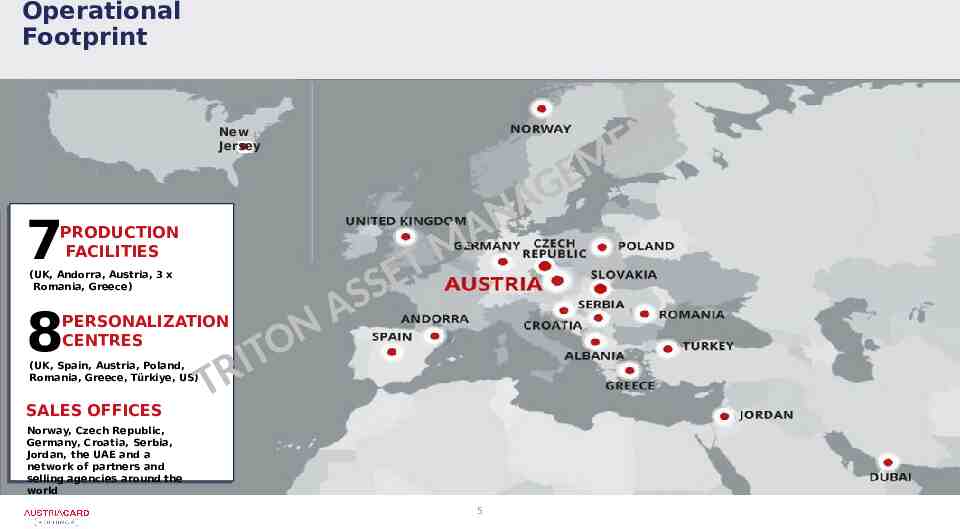
Operational Footprint New Jersey 7 PRODUCTION FACILITIES (UK, Andorra, Austria, 3 x Romania, Greece) 8 A N O T I TR PERSONALIZATION CENTRES (UK, Spain, Austria, Poland, Romania, Greece, Türkiye, US) SALES OFFICES T E SS E G A N A M Norway, Czech Republic, Germany, Croatia, Serbia, Jordan, the UAE and a network of partners and selling agencies around the world 5 E M T N
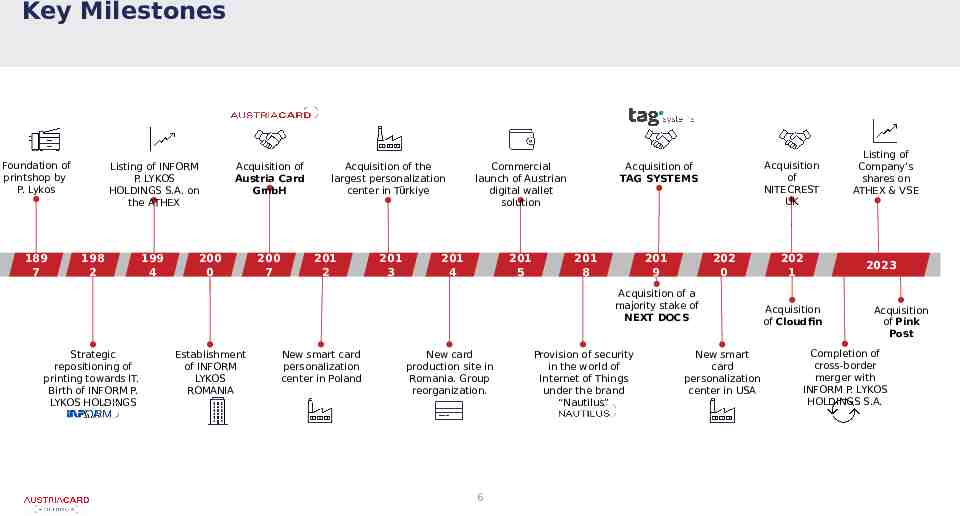
Key Milestones Foundation of printshop by P. Lykos 189 7 Listing of INFORM P. LYKOS HOLDINGS S.A. on the ATHEX Acquisition of Austria Card GmbH 199 4 200 7 198 2 200 0 Acquisition of the largest personalization center in Türkiye 201 2 201 3 Commercial launch of Austrian digital wallet solution 201 4 201 5 Acquisition of NITECREST UK Acquisition of TAG SYSTEMS 201 8 201 9 202 0 Acquisition of a majority stake of NEXT DOCS Strategic repositioning of printing towards IT. Birth of INFORM P. LYKOS HOLDINGS S.A. Establishment of INFORM LYKOS ROMANIA New smart card personalization center in Poland New card production site in Romania. Group reorganization. 6 Provision of security in the world of Internet of Things under the brand “Nautilus” New smart card personalization center in USA 202 1 Acquisition of Cloudfin Listing of Company’s shares on ATHEX & VSE 2023 Acquisition of Pink Post Completion of cross-border merger with INFORM P. LYKOS HOLDINGS S.A.
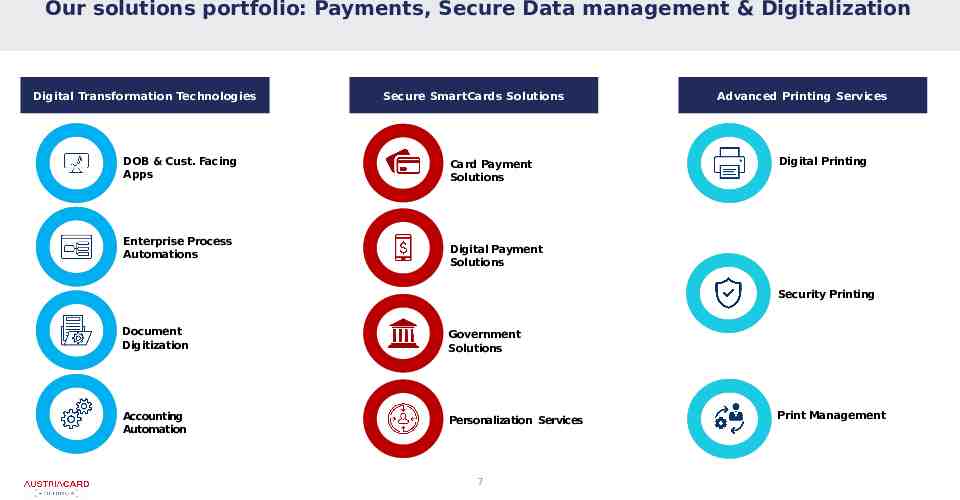
Our solutions portfolio: Payments, Secure Data management & Digitalization Digital Transformation Technologies DOB & Cust. Facing Apps Enterprise Process Automations Secure SmartCards Solutions Card Payment Solutions Advanced Printing Services Digital Printing Digital Payment Solutions Security Printing Document Digitization Government Solutions Accounting Automation Personalization Services 7 Print Management
1. AUSTRIACARD Group Overview 2. Strategy, Structure, Performance, M&A, Management Contents 3. Industry Overview & Market Trends 4. Appendix
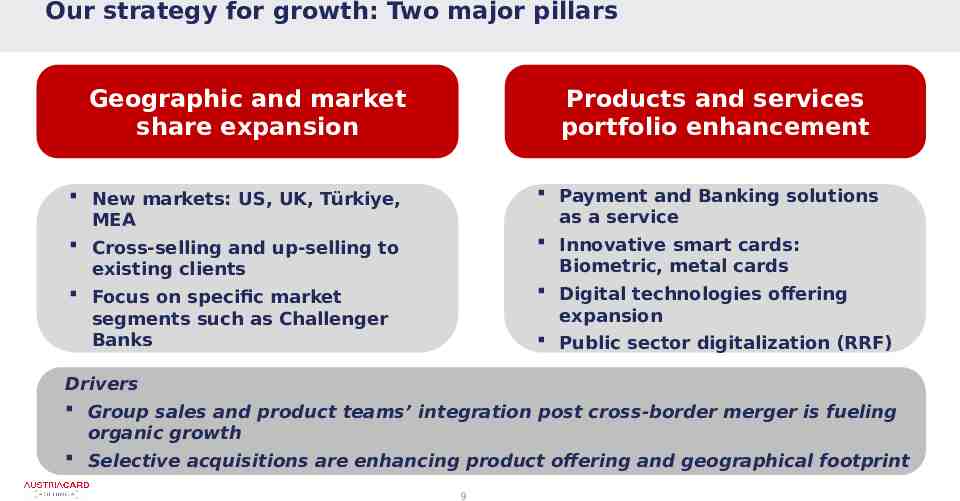
Our strategy for growth: Two major pillars Geographic and market share expansion Products and services portfolio enhancement Payment and Banking solutions as a service Innovative smart cards: Biometric, metal cards Digital technologies offering expansion Public sector digitalization (RRF) New markets: US, UK, Türkiye, MEA Cross-selling and up-selling to existing clients Focus on specific market segments such as Challenger Banks Drivers Group sales and product teams’ integration post cross-border merger is fueling organic growth Selective acquisitions are enhancing product offering and geographical footprint 9
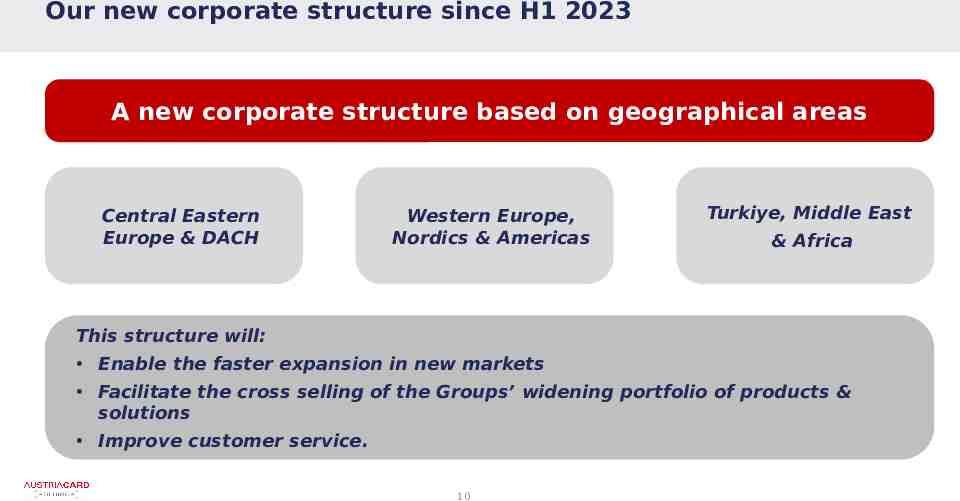
Our new corporate structure since H1 2023 A new corporate structure based on geographical areas Central Eastern Europe & DACH Western Europe, Nordics & Americas Turkiye, Middle East & Africa This structure will: Enable the faster expansion in new markets Facilitate the cross selling of the Groups’ widening portfolio of products & solutions Improve customer service. 10
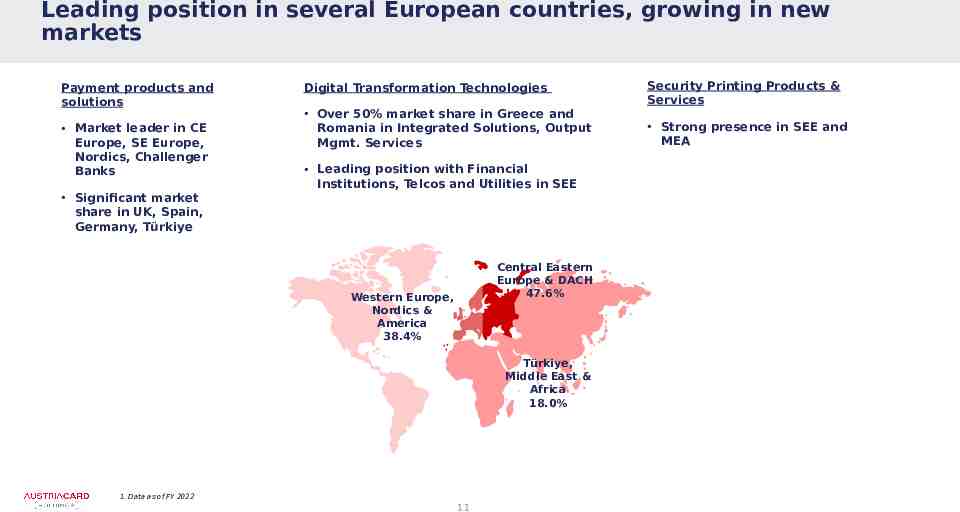
Leading position in several European countries, growing in new markets Payment products and solutions Market leader in CΕ Europe, SΕ Europe, Nordics, Challenger Banks Digital Transformation Technologies Over 50% market share in Greece and Romania in Integrated Solutions, Output Mgmt. Services Leading position with Financial Institutions, Telcos and Utilities in SEE Significant market share in UK, Spain, Germany, Türkiye Central Eastern Europe & DACH 47.6% Western Europe, Nordics & America 38.4% Türkiye, Middle East & Africa 18.0% 1. Data as of FY 2022 11 Security Printing Products & Services Strong presence in SEE and MEA
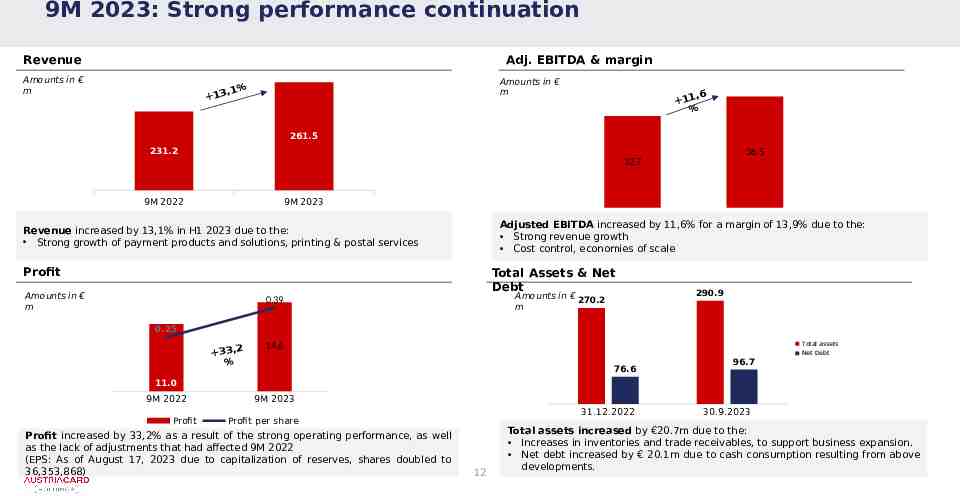
9M 2023: Strong performance continuation Revenue Adj. EBITDA & margin Amounts in m Amounts in40.0 m 35.0 ,1% 13 ,6 11 % 30.0 261.5 231.2 25.0 36.5 32.7 20.0 9M 2022 9M 2023 15.0 Adjusted EBITDA increased by 11,6% for a margin of 13,9% due to the: Strong revenue growth Cost control, economies of scale Revenue increased by 13,1% in H1 2023 due to the: Strong growth of payment products and solutions, printing & postal services Profit Amounts in 16.0 14.0 m 12.0 10.0 8.0 6.0 4.0 2.0 0.0 0.39 0.25 33,2 % 14.6 11.0 9M 2022 Profit 9M 2023 Total Assets & Net Debt 0.45 0.40 0.35 0.30 0.25 0.20 0.15 0.10 0.05 0.00 Amounts in 270.2 m Total assets 76.6 31.12.2022 Profit per share Profit increased by 33,2% as a result of the strong operating performance, as well as the lack of adjustments that had affected 9M 2022 (EPS: As of August 17, 2023 due to capitalization of reserves, shares doubled to 36,353,868) 290.9 12 96.7 Net Debt 30.9.2023 Total assets increased by 20.7m due to the: Increases in inventories and trade receivables, to support business expansion. Net debt increased by 20.1m due to cash consumption resulting from above developments.
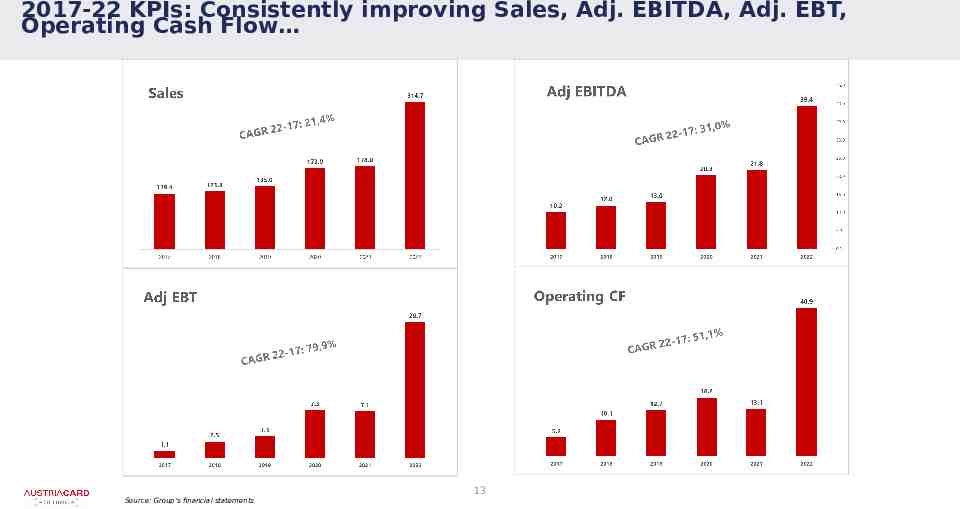
2017-22 KPIs: Consistently improving Sales, Adj. EBITDA, Adj. EBT, Operating Cash Flow 13 Source: Group’s financial statements
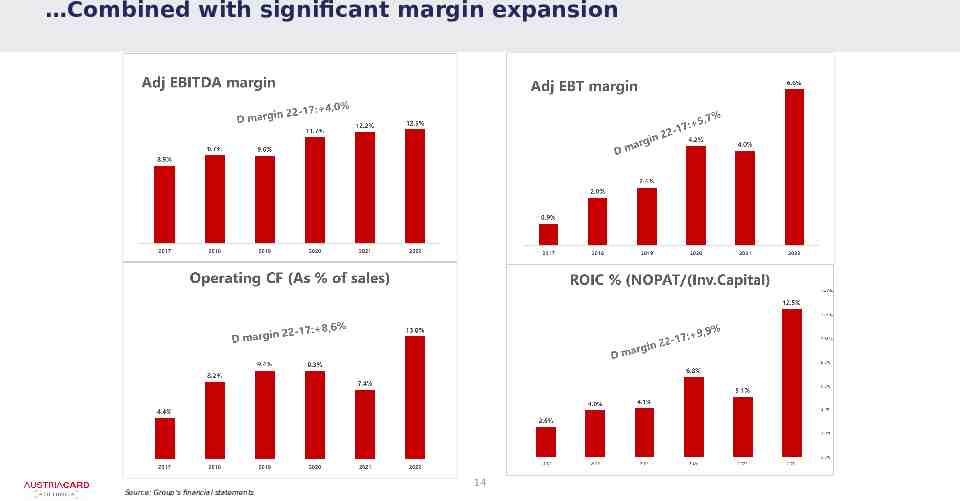
Combined with significant margin expansion 14 Source: Group’s financial statements
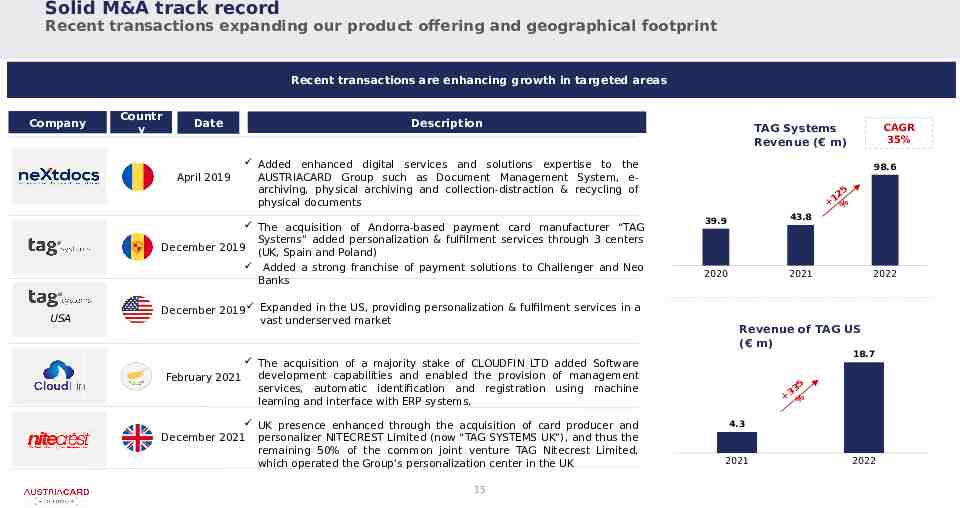
Solid M&A track record Recent transactions expanding our product offering and geographical footprint Recent transactions are enhancing growth in targeted areas Company Countr y Date April 2019 Description Added enhanced digital services and solutions expertise to the AUSTRIACARD Group such as Document Management System, earchiving, physical archiving and collection-distraction & recycling of physical documents The acquisition of Andorra-based payment card manufacturer “TAG Systems” added personalization & fulfilment services through 3 centers December 2019 (UK, Spain and Poland) Added a strong franchise of payment solutions to Challenger and Neo Banks USA December 2019 Expanded in the US, providing personalization & fulfilment services in a vast underserved market 98.6 5 12 % 39.9 43.8 2020 2021 15 2022 Revenue of TAG US ( m) 18.7 The acquisition of a majority stake of CLOUDFIN LTD added Software development capabilities and enabled the provision of management February 2021 services, automatic identification and registration using machine learning and interface with ERP systems, UK presence enhanced through the acquisition of card producer and December 2021 personalizer NITECREST Limited (now “TAG SYSTEMS UK”), and thus the remaining 50% of the common joint venture TAG Nitecrest Limited, which operated the Group’s personalization center in the UK CAGR 35% TAG Systems Revenue ( m) 5 33 % 4.3 2021 2022
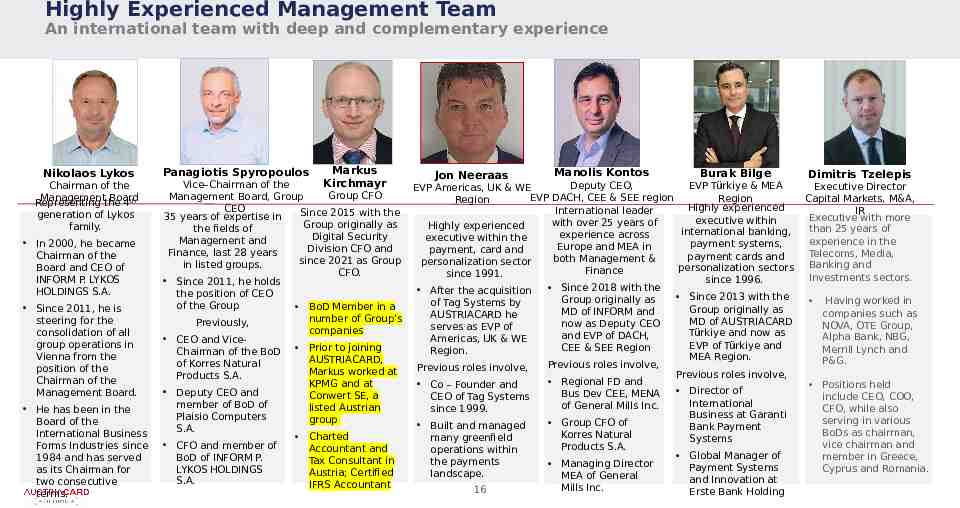
Highly Experienced Management Team An international team with deep and complementary experience Nikolaos Lykos Chairman of the Management Board Representing the 4th generation of Lykos family. In 2000, he became Chairman of the Board and CEO of INFORM P. LYKOS HOLDINGS S.A. Since 2011, he is steering for the consolidation of all group operations in Vienna from the position of the Chairman of the Management Board. He has been in the Board of the International Business Forms Industries since 1984 and has served as its Chairman for two consecutive terms. Panagiotis Spyropoulos Markus Kirchmayr Vice–Chairman of the Group CFO Management Board, Group CEO Since 2015 with the 35 years of expertise in Group originally as the fields of Digital Security Management and Division CFO and Finance, last 28 years since 2021 as Group in listed groups. CFO. Since 2011, he holds the position of CEO of the Group BoD Member in a number of Group’s Previously, companies CEO and ViceChairman of the BoD Prior to joining AUSTRIACARD, of Korres Natural Markus worked at Products S.A. KPMG and at Deputy CEO and Conwert SE, a member of BoD of listed Austrian Plaisio Computers group S.A. Charted CFO and member of Accountant and BoD of INFORM P. Tax Consultant in LYKOS HOLDINGS Austria; Certified S.A. IFRS Accountant Jon Neeraas Manolis Kontos Burak Bilge Deputy CEO, EVP Türkiye & MEA EVP Americas, UK & WE EVP DACH, CEE & SEE region Region Region Highly experienced International leader executive within with over 25 years of Highly experienced international banking, experience across executive within the payment systems, Europe and MEA in payment, card and payment cards and both Management & personalization sector personalization sectors Finance since 1991. since 1996. Since 2018 with the After the acquisition Since 2013 with the Group originally as of Tag Systems by Group originally as MD of INFORM and AUSTRIACARD he MD of AUSTRIACARD now as Deputy CEO serves as EVP of Türkiye and now as and EVP of DACH, Americas, UK & WE EVP of Türkiye and CEE & SEE Region Region. MEA Region. Previous roles involve, Previous roles involve, Previous roles involve, Regional FD and Co – Founder and Director of Bus Dev CEE, MENA CEO of Tag Systems International of General Mills Inc. since 1999. Business at Garanti Group CFO of Built and managed Bank Payment Korres Natural many greenfield Systems Products S.A. operations within Global Manager of the payments Managing Director Payment Systems landscape. MEA of General and Innovation at Mills Inc. 16 Erste Bank Holding Dimitris Tzelepis Executive Director Capital Markets, M&A, IR Executive with more than 25 years of experience in the Telecoms, Media, Banking and Investments sectors. Having worked in companies such as NOVA, OTE Group, Alpha Bank, NBG, Merrill Lynch and P&G. Positions held include CEO, COO, CFO, while also serving in various BoDs as chairman, vice chairman and member in Greece, Cyprus and Romania.
1. AUSTRIACARD Group Overview 2. Key Investment Highlights Contents 3. Industry Overview & Market Trends 4. Appendix
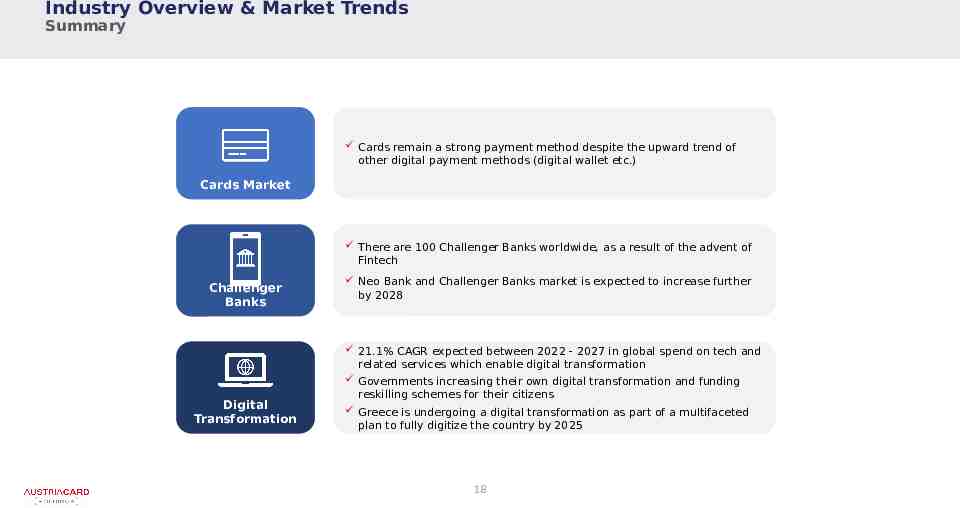
Industry Overview & Market Trends Summary Cards remain a strong payment method despite the upward trend of other digital payment methods (digital wallet etc.) Cards Market There are 100 Challenger Banks worldwide, as a result of the advent of Fintech Challenger Banks Digital Transformation Neo Bank and Challenger Banks market is expected to increase further by 2028 21.1% CAGR expected between 2022 - 2027 in global spend on tech and related services which enable digital transformation Governments increasing their own digital transformation and funding reskilling schemes for their citizens Greece is undergoing a digital transformation as part of a multifaceted plan to fully digitize the country by 2025 18
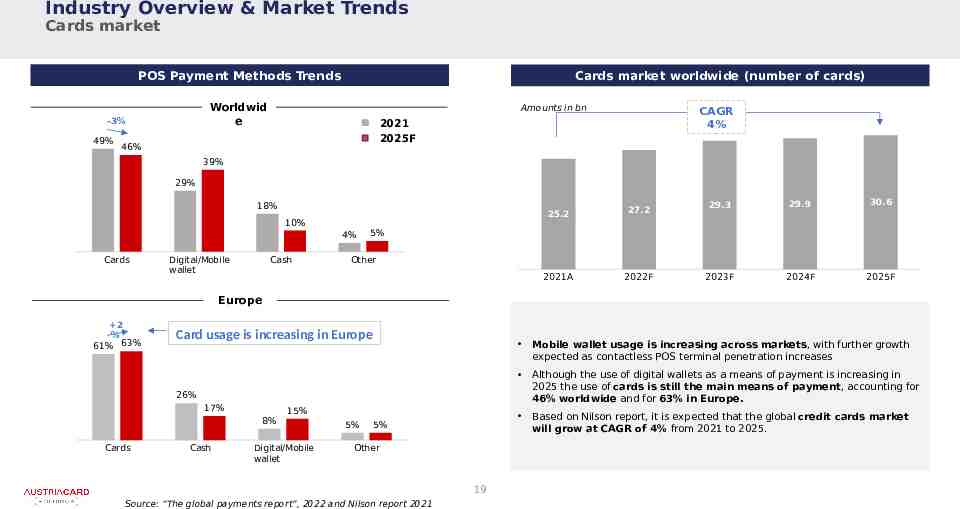
Industry Overview & Market Trends Cards market POS Payment Methods Trends Worldwid e -3% 49% Cards market worldwide (number of cards) Amounts in bn CAGR 4% 2021 2025F 46% 39% 29% 18% 10% 4% Cards Digital/Mobile wallet Cash 27.2 29.3 29.9 30.6 25.2 2021A 2022F 2023F 2024F 2025F 5% Other Europe 2 % 61% 63% Card usage is increasing in Europe Mobile wallet usage is increasing across markets, with further growth expected as contactless POS terminal penetration increases Although the use of digital wallets as a means of payment is increasing in 2025 the use of cards is still the main means of payment, accounting for 46% worldwide and for 63% in Europe. Based on Nilson report, it is expected that the global credit cards market will grow at CAGR of 4% from 2021 to 2025. 26% 17% 8% Cards Cash 15% Digital/Mobile wallet 5% 5% Other 19 Source: “The global payments report”, 2022 and Nilson report 2021
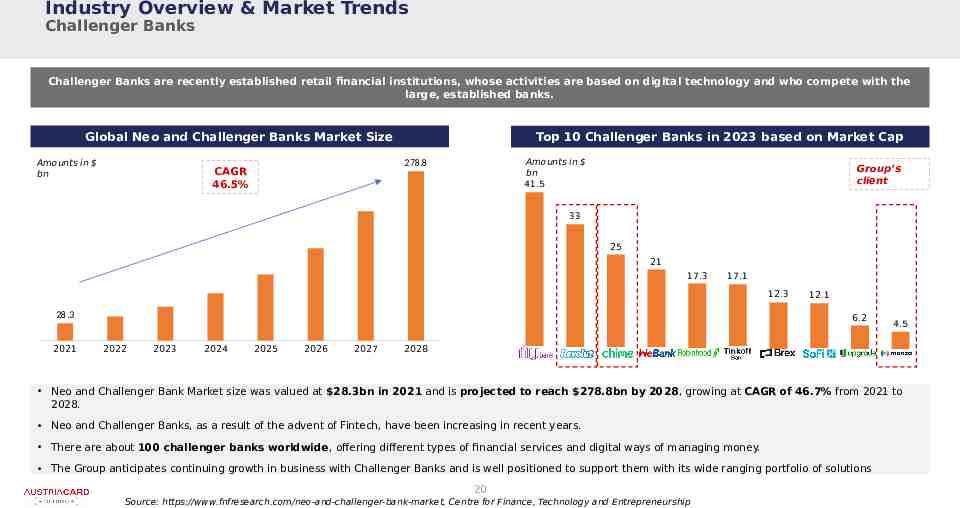
Industry Overview & Market Trends Challenger Banks Challenger Banks are recently established retail financial institutions, whose activities are based on digital technology and who compete with the large, established banks. Global Neo and Challenger Banks Market Size Amounts in bn Top 10 Challenger Banks in 2023 based on Market Cap Amounts in bn 41.5 278.8 CAGR 46.5% Group’s client 33 25 21 17.3 17.1 12.3 28.3 2021 12.1 6.2 2022 2023 2024 2025 2026 2027 4.5 2028 Neo and Challenger Bank Market size was valued at 28.3bn in 2021 and is projected to reach 278.8bn by 2028, growing at CAGR of 46.7% from 2021 to 2028. Neo and Challenger Banks, as a result of the advent of Fintech, have been increasing in recent years. There are about 100 challenger banks worldwide, offering different types of financial services and digital ways of managing money. The Group anticipates continuing growth in business with Challenger Banks and is well positioned to support them with its wide ranging portfolio of solutions 20 Source: https://www.fnfresearch.com/neo-and-challenger-bank-market, Centre for Finance, Technology and Entrepreneurship
1. AUSTRIACARD Group Overview 2. Key Investment Highlights Contents 3. Industry Overview & Market Trends 4. Appendix
Appendix I. Historical Financial Statements II. Organisational chart of the Group post the Cross-Border Merger III. Glossary
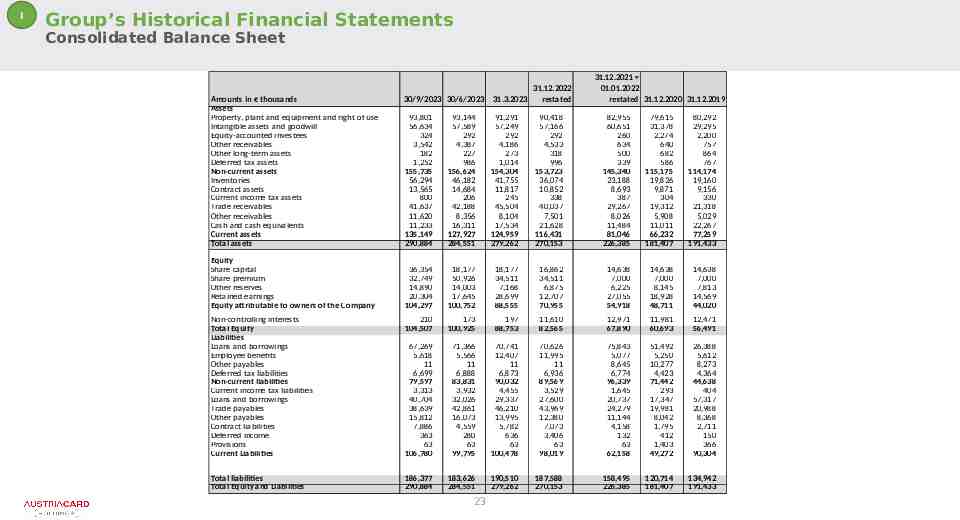
I Group’s Historical Financial Statements Consolidated Balance Sheet 31.12.2021 01.01.2022 restated 31.12.2020 31.12.2019 30/9/2023 30/6/2023 31.12.2022 31.3.2023 restated 93,801 56,634 324 3,542 182 1,252 155,735 56,294 13,565 800 41,637 11,620 11,233 135,149 290,884 93,144 57,589 292 4,387 227 986 156,624 46,182 14,684 206 42,188 8,356 16,311 127,927 284,551 91,291 57,249 292 4,186 273 1,014 154,304 41,755 11,817 245 45,504 8,104 17,534 124,959 279,262 90,418 57,166 292 4,533 318 996 153,723 36,074 10,852 338 40,037 7,501 21,628 116,431 270,153 82,955 60,651 260 634 500 339 145,340 23,188 8,693 387 29,267 8,026 11,484 81,046 226,385 79,615 31,378 2,274 640 682 586 115,175 19,826 9,871 304 19,312 5,908 11,011 66,232 181,407 80,292 29,295 2,200 757 864 767 114,174 19,160 9,156 330 21,318 5,029 22,267 77,259 191,433 36,354 32,749 14,890 20,304 104,297 18,177 50,926 14,003 17,645 100,752 18,177 34,511 7,168 28,699 88,555 16,862 34,511 6,875 12,707 70,955 14,638 7,000 6,225 27,055 54,918 14,638 7,000 8,145 18,928 48,711 14,638 7,000 7,813 14,569 44,020 Non-controlling interests Total Equity Liabilities Loans and borrowings Employee benefits Other payables Deferred tax liabilities Non-current liabilities Current income tax liabilities Loans and borrowings Trade payables Other payables Contract liabilities Deferred income Provisions Current Liabilities 210 104,507 173 100,925 197 88,753 11,610 82,565 12,971 67,890 11,981 60,693 12,471 56,491 67,269 5,618 11 6,699 79,597 3,313 40,704 38,639 15,812 7,886 363 63 106,780 71,366 5,566 11 6,888 83,831 3,932 32,026 42,861 16,073 4,559 280 63 99,795 70,741 12,407 11 6,873 90,032 4,455 29,337 46,210 13,995 5,782 636 63 100,478 70,626 11,995 11 6,936 89,569 3,529 27,600 43,969 12,380 7,073 3,406 63 98,019 75,843 5,077 8,645 6,774 96,339 1,645 20,737 24,279 11,144 4,158 132 63 62,158 51,492 5,250 10,277 4,423 71,442 293 17,347 19,981 8,042 1,795 412 1,403 49,272 26,388 5,612 8,273 4,364 44,638 404 57,317 20,988 8,368 2,711 150 366 90,304 Total liabilities Total Equity and Liabilities 186,377 290,884 183,626 284,551 190,510 279,262 187,588 270,153 158,495 226,385 120,714 181,407 134,942 191,433 Amounts in thousands Assets Property, plant and equipment and right of use Intangible assets and goodwill Equity-accounted investees Other receivables Other long-term assets Deferred tax assets Non-current assets Inventories Contract assets Current income tax assets Trade receivables Other receivables Cash and cash equivalents Current assets Total assets Equity Share capital Share premium Other reserves Retained earnings Equity attributable to owners of the Company 23
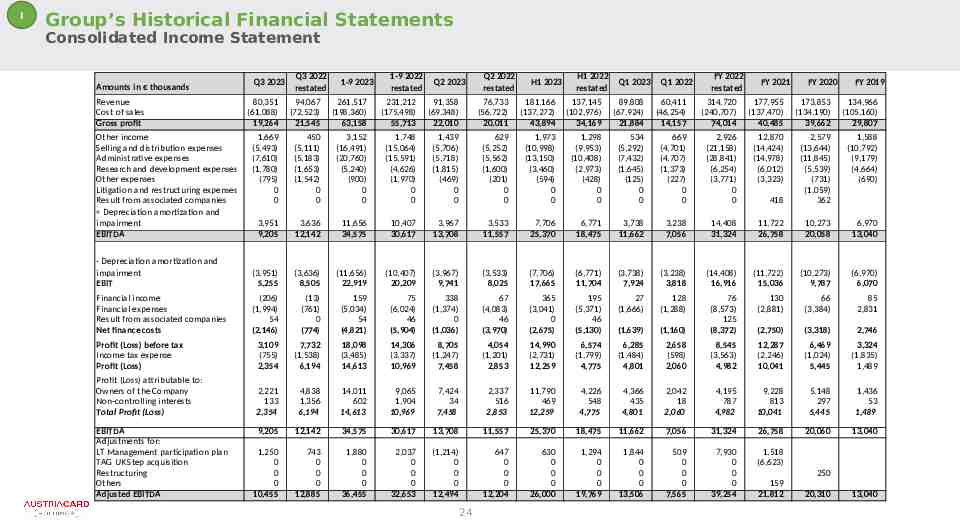
I Group’s Historical Financial Statements Consolidated Income Statement Amounts in thousands Revenue Cost of sales Gross profit Q3 2023 Q3 2022 restated 1-9 2023 1-9 2022 restated Q2 2023 Q2 2022 restated H1 2023 H1 2022 restated Q1 2023 Q1 2022 FY 2022 restated FY 2021 FY 2020 FY 2019 80,351 (61,088) 19,264 94,067 (72,523) 21,545 261,517 (198,360) 63,158 231,212 (175,498) 55,713 91,358 (69,348) 22,010 76,733 (56,722) 20,011 181,166 (137,272) 43,894 137,145 (102,976) 34,169 89,808 (67,924) 21,884 60,411 (46,254) 14,157 314,720 (240,707) 74,014 177,955 (137,470) 40,485 173,853 (134,190) 39,662 134,966 (105,160) 29,807 1,669 (5,493) (7,610) (1,780) (795) 0 0 450 (5,111) (5,183) (1,653) (1,542) 0 0 3,152 (16,491) (20,760) (5,240) (900) 0 0 1,748 (15,064) (15,591) (4,626) (1,970) 0 0 1,439 (5,706) (5,718) (1,815) (469) 0 0 629 (5,252) (5,562) (1,600) (201) 0 0 1,973 (10,998) (13,150) (3,460) (594) 0 0 1,298 (9,953) (10,408) (2,973) (428) 0 0 534 (5,292) (7,432) (1,645) (125) 0 0 669 (4,701) (4,707) (1,373) (227) 0 0 2,926 (21,158) (28,841) (6,254) (3,771) 0 0 12,870 (14,424) (14,978) (6,012) (3,323) 1,588 (10,792) (9,179) (4,664) (690) 418 2,579 (13,644) (11,845) (5,539) (731) (1,059) 362 3,951 9,205 3,636 12,142 11,656 34,575 10,407 30,617 3,967 13,708 3,533 11,557 7,706 25,370 6,771 18,475 3,738 11,662 3,238 7,056 14,408 31,324 11,722 26,758 10,273 20,058 6,970 13,040 - Depreciation amortization and impairment EBIT (3,951) 5,255 (3,636) 8,505 (11,656) 22,919 (10,407) 20,209 (3,967) 9,741 (3,533) 8,025 (7,706) 17,665 (6,771) 11,704 (3,738) 7,924 (3,238) 3,818 (14,408) 16,916 (11,722) 15,036 (10,273) 9,787 (6,970) 6,070 Financial income Financial expenses Result from associated companies Net finance costs (206) (1,994) 54 (2,146) (13) (761) 0 (774) 159 (5,034) 54 (4,821) 75 (6,024) 46 (5,904) 338 (1,374) 0 (1,036) 67 (4,083) 46 (3,970) 365 (3,041) 0 (2,675) 195 (5,371) 46 (5,130) 27 (1,666) 128 (1,288) 130 (2,881) 66 (3,384) 85 2,831 (1,639) (1,160) 76 (8,573) 125 (8,372) (2,750) (3,318) 2,746 Profit (Loss) before tax Income tax expense Profit (Loss) 3,109 (755) 2,354 7,732 (1,538) 6,194 18,098 (3,485) 14,613 14,306 (3,337) 10,969 8,705 (1,247) 7,458 4,054 (1,201) 2,853 14,990 (2,731) 12,259 6,574 (1,799) 4,775 6,285 (1,484) 4,801 2,658 (598) 2,060 8,545 (3,563) 4,982 12,287 (2,246) 10,041 6,469 (1,024) 5,445 3,324 (1,835) 1,489 Profit (Loss) attributable to: Owners of the Company Non-controlling interests Total Profit (Loss) 2,221 133 2,354 4,838 1,356 6,194 14,011 602 14,613 9,065 1,904 10,969 7,424 34 7,458 2,337 516 2,853 11,790 469 12,259 4,226 548 4,775 4,366 435 4,801 2,042 18 2,060 4,195 787 4,982 9,228 813 10,041 5,148 297 5,445 1,436 53 1,489 9,205 12,142 34,575 30,617 13,708 11,557 25,370 18,475 11,662 7,056 31,324 26,758 20,060 13,040 1,250 0 0 0 10,455 743 0 0 0 12,885 1,880 0 0 0 36,455 2,037 0 0 0 32,653 (1,214) 0 0 0 12,494 647 0 0 0 12,204 630 0 0 0 26,000 1,294 0 0 0 19,769 1,844 0 0 0 13,506 509 0 0 0 7,565 7,930 0 0 0 39,254 1,518 (6,623) Other income Selling and distribution expenses Administrative expenses Research and development expenses Other expenses Litigation and restructuring expenses Result from associated companies Depreciation amortization and impairment EBITDA EBITDA Adjustments for: LT Management participation plan TAG UK Step acquisition Restructuring Others Adjusted EBITDA 24 250 159 21,812 20,310 13,040
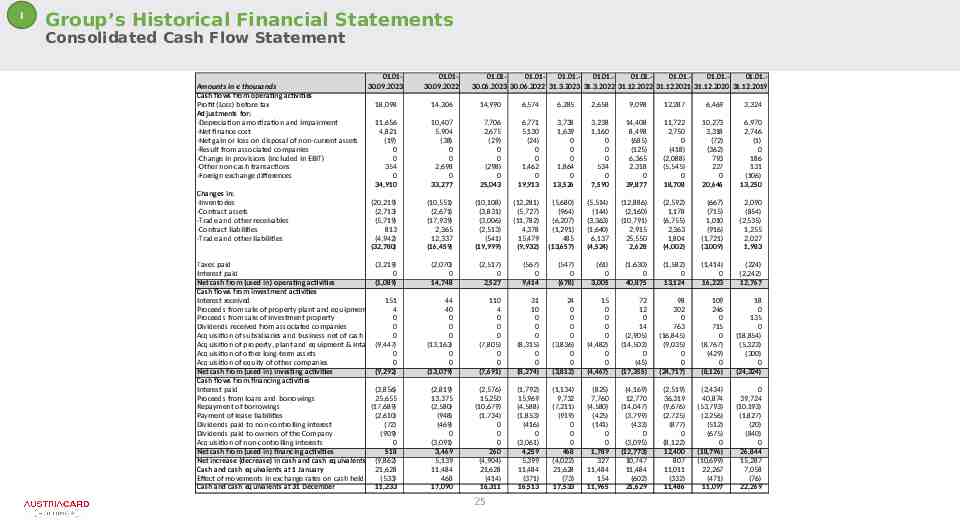
I Group’s Historical Financial Statements Consolidated Cash Flow Statement Amounts in thousands Cash flows from operating activities Profit (Loss) before tax Adjustments for: -Depreciation amortization and impairment -Net finance cost -Net gain or loss on disposal of non-current assets -Result from associated companies -Change in provisions (included in EBIT) -Other non-cash transactions -Foreign exchange differences Changes in: -Inventories -Contract assets -Trade and other receivables -Contract liabilities -Trade and other liabilities 01.0130.09.2023 01.0130.09.2022 18,098 14,306 14,990 6,574 6,285 2,658 9,098 12,287 6,469 3,324 11,656 4,821 (19) 0 0 354 0 34,910 10,407 5,904 (38) 0 0 2,698 0 33,277 7,706 2,675 (29) 0 0 (298) 0 25,043 6,771 5,130 (24) 0 0 1,462 0 19,913 3,738 1,639 0 0 0 1,864 0 13,526 3,238 1,160 0 0 0 534 0 7,590 14,408 8,498 (685) (125) 6,365 2,318 0 39,877 11,722 2,750 0 (418) (2,088) (5,545) 0 18,708 10,273 3,318 (72) (362) 793 227 0 20,646 6,970 2,746 (1) 0 186 131 (106) 13,250 (20,219) (2,713) (5,719) 813 (4,942) (32,780) (10,551) (2,671) (17,939) 2,365 12,337 (16,459) (10,108) (3,831) (3,006) (2,513) (541) (19,999) (12,281) (5,727) (11,782) 4,378 15,479 (9,932) (5,680) (964) (6,207) (1,291) 485 (13,657) (5,514) (144) (3,363) (1,640) 6,137 (4,524) (12,886) (2,160) (10,791) 2,915 25,550 2,628 (2,592) 1,178 (6,755) 2,363 1,804 (4,002) (667) (715) 1,010 (916) (1,721) (3,009) 2,090 (854) (2,535) 1,255 2,027 1,983 (2,070) 0 14,748 (2,517) 0 2,527 (567) 0 9,414 (547) 0 (678) (61) 0 3,005 (1,630) 0 40,875 (1,582) 0 13,124 (1,414) 0 16,223 (224) (2,242) 12,767 44 40 0 0 0 (13,163) 0 0 (13,079) 110 4 0 0 0 (7,805) 0 0 (7,691) 31 10 0 0 0 (8,315) 0 0 (8,274) 24 0 0 0 0 (3,836) 0 0 (3,812) 15 0 0 0 0 (4,482) 0 0 (4,467) 72 12 0 14 (2,905) (14,503) 0 (45) (17,355) 98 302 0 763 (16,845) (9,035) 0 0 (24,717) 109 246 0 715 0 (8,767) (429) 0 (8,126) 18 0 135 0 (18,854) (5,323) (300) 0 (24,324) (2,819) 13,375 (2,580) (948) (469) 0 (3,091) 3,469 5,139 11,484 468 17,090 (2,576) 15,250 (10,679) (1,734) 0 0 0 260 (4,904) 21,628 (414) 16,311 (1,792) 15,969 (4,588) (1,853) (416) 0 (3,061) 4,259 5,399 11,484 (371) 16,513 (1,134) 9,732 (7,211) (919) 0 0 0 468 (4,022) 21,628 (73) 17,533 (825) 7,760 (4,580) (425) (141) 0 0 1,789 327 11,484 154 11,965 (4,169) 12,770 (14,047) (3,799) (433) 0 (3,095) (12,773) 10,747 11,484 (602) 21,629 (2,519) 36,319 (9,676) (2,725) (877) 0 (8,122) 12,400 807 11,011 (332) 11,486 (2,434) 40,874 (53,793) (2,256) (512) (675) 0 (18,796) (10,699) 22,267 (471) 11,097 0 39,724 (10,193) (1,827) (20) (840) 0 26,844 15,287 7,058 (76) 22,269 Taxes paid (3,219) Interest paid 0 Net cash from (used in) operating activities (1,089) Cash flows from investment activities Interest received 151 Proceeds from sale of property plant and equipment 4 Proceeds from sale of investment property 0 Dividends received from associated companies 0 Acquisition of subsidiaries and business net of cash acquired0 Acquisition of property, plant and equipment & intangible (9,447) assets Acquisition of other long-term assets 0 Acquisition of equity of other companies 0 Net cash from (used in) investing activities (9,292) Cash flows from financing activities Interest paid (3,856) Proceeds from loans and borrowings 25,655 Repayment of borrowings (17,689) Payment of lease liabilities (2,610) Dividends paid to non-controlling interest (72) Dividends paid to owners of the Company (909) Acquisition of non-controlling interests 0 Net cash from (used in) financing activities 518 Net increase (decrease) in cash and cash equivalents (9,862) Cash and cash equivalents at 1 January 21,628 Effect of movements in exchange rates on cash held (533) Cash and cash equivalents at 31 December 11,233 01.0101.0101.01.01.01.01.01.01.01.01.01.01.01.30.06.2023 30.06.2022 31.3.2023 31.3.2022 31.12.2022 31.12.2021 31.12.2020 31.12.2019 25
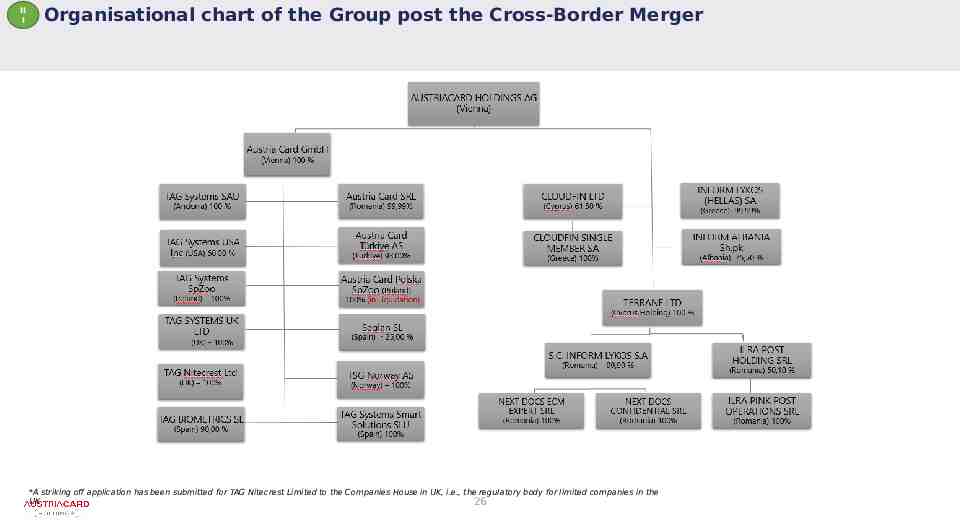
II I Organisational chart of the Group post the Cross-Border Merger *A striking off application has been submitted for TAG Nitecrest Limited to the Companies House in UK, i.e., the regulatory body for limited companies in the UK 26
Disclaimer This presentation contains forward-looking statements, which involve risks and uncertainties. These statements may be identified by words such as “expectation” or “target” or “forecast” and similar expressions, or by their context. These statements are made on the basis of current knowledge and assumptions. Various factors could cause actual future results, performance or events to differ materially from those described in these statements. No obligation is assumed to update any forward-looking statements. This presentation is made by AUSTRIACARD (the “Company”) for you as intended recipient and is strictly confidential. It is furnished to you solely for your information and may not be copied, distributed or otherwise made available to any other person by any recipient. The facts and information contained herein are based on currently available information and data, are as up to date as is reasonably possible and may be subject to revision in the future. Neither the Company nor any of its directors, officers, employees nor any other person makes any representation or warranty, express or implied, as to the accuracy or completeness of the information contained in this presentation. Whilst all reasonable care has been taken to ensure the facts stated herein are accurate and that the opinions contained herein are fair and reasonable, this document is selective in nature and is intended to provide an introduction to, and overview of, the business of the Company. Where any information and statistics are quoted from any external source, such information or statistics should not be interpreted as having been adopted or endorsed by the Company as being accurate. This presentation does not constitute a recommendation for investment to any securities or form part of and should not be construed as, an offer, or invitation, or solicitation of an offer, to subscribe for or purchase any securities of the Company in any jurisdiction or an inducement to enter into any investment activity. A public offer may only be made after publication of a prospectus prepared in accordance with the respective legal provisions of the jurisdictions concerned. This presentation is not for distribution, directly or indirectly, in or into the United States (including its territories and possessions, any State of the United States and the District of Columbia). This presentation does not constitute or form a part of any offer or solicitation to purchase or subscribe for securities in the United States of America. The presentation is not intended to be relied upon as legal, accounting, regulatory, tax or other advice, does not take into consideration the goals, or the legal, accounting, regulatory, tax or financial situation or the needs of the recipients and does not form the basis for an informed investment decision. The Company and any of its respective affiliates, advisers, officers, managers or representatives, does not accept any liability whatsoever for any loss or damage arising from any use of this presentation and explicitly disclaim any liability whatsoever arising from it. 27