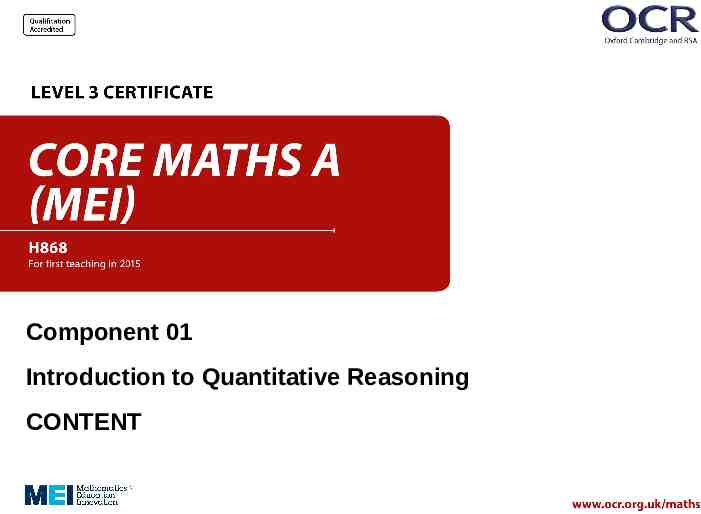
Component 01 Introduction to Quantitative Reasoning CONTENT
31 Slides2.67 MB
Component 01 Introduction to Quantitative Reasoning CONTENT
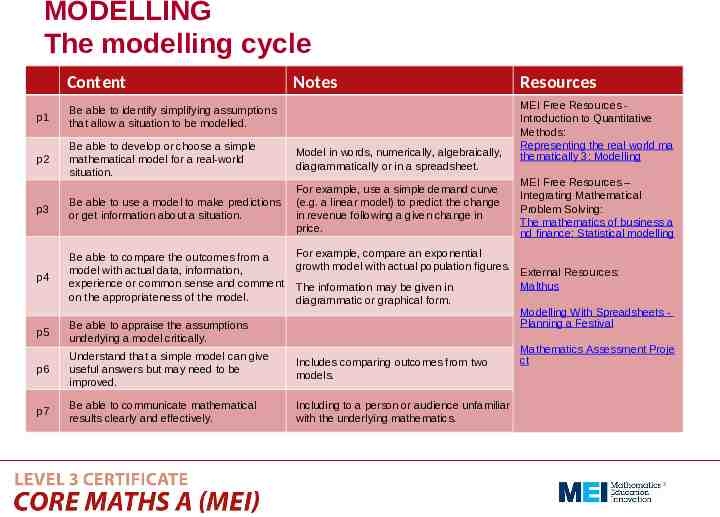
MODELLING The modelling cycle Content Notes p1 Be able to identify simplifying assumptions that allow a situation to be modelled. p2 Be able to develop or choose a simple mathematical model for a real-world situation. Model in words, numerically, algebraically, diagrammatically or in a spreadsheet. p3 Be able to use a model to make predictions or get information about a situation. For example, use a simple demand curve (e.g. a linear model) to predict the change in revenue following a given change in price. p4 Be able to compare the outcomes from a model with actual data, information, experience or common sense and comment on the appropriateness of the model. p5 Be able to appraise the assumptions underlying a model critically. p6 Understand that a simple model can give useful answers but may need to be improved. Includes comparing outcomes from two models. p7 Be able to communicate mathematical results clearly and effectively. Including to a person or audience unfamiliar with the underlying mathematics. For example, compare an exponential growth model with actual population figures. The information may be given in diagrammatic or graphical form. Resources MEI Free Resources Introduction to Quantitative Methods: Representing the real world ma thematically 3: Modelling MEI Free Resources – Integrating Mathematical Problem Solving: The mathematics of business a nd finance: Statistical modelling External Resources: Malthus Modelling With Spreadsheets Planning a Festival Mathematics Assessment Proje ct
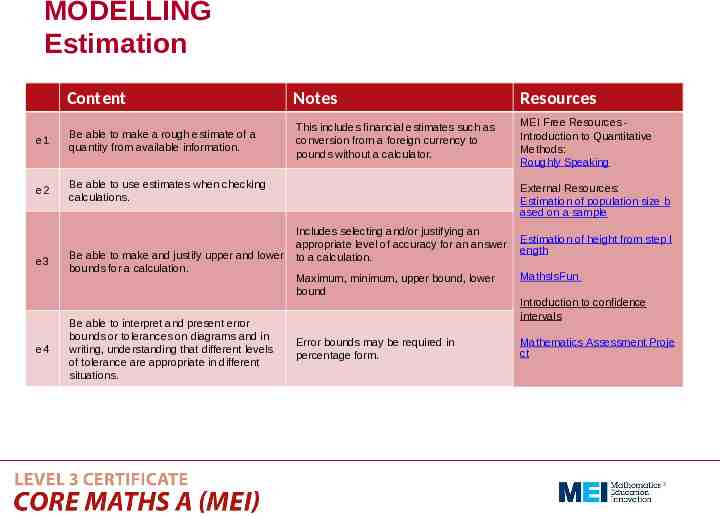
MODELLING Estimation Content Notes Resources e1 Be able to make a rough estimate of a quantity from available information. This includes financial estimates such as conversion from a foreign currency to pounds without a calculator. MEI Free Resources Introduction to Quantitative Methods: Roughly Speaking e2 Be able to use estimates when checking calculations. e3 e4 Be able to make and justify upper and lower bounds for a calculation. Be able to interpret and present error bounds or tolerances on diagrams and in writing, understanding that different levels of tolerance are appropriate in different situations. External Resources: Estimation of population size b ased on a sample Includes selecting and/or justifying an appropriate level of accuracy for an answer to a calculation. Estimation of height from step l ength Maximum, minimum, upper bound, lower bound MathsIsFun Error bounds may be required in percentage form. Mathematics Assessment Proje ct Introduction to confidence intervals
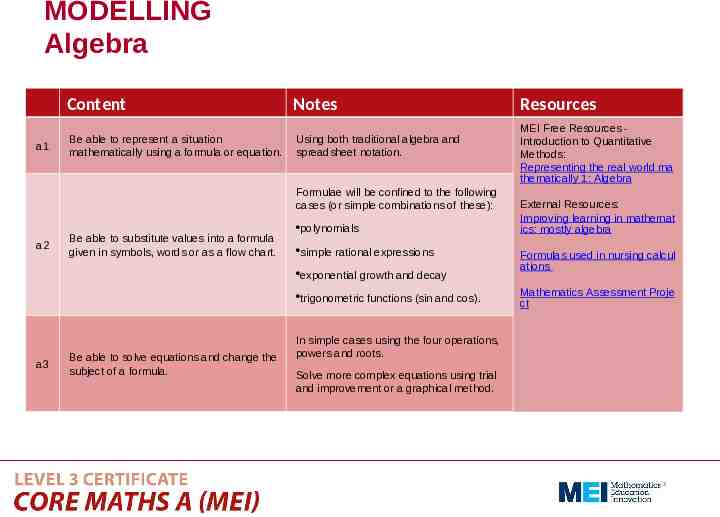
MODELLING Algebra a1 Content Notes Be able to represent a situation mathematically using a formula or equation. Using both traditional algebra and spreadsheet notation. Formulae will be confined to the following cases (or simple combinations of these): a2 Be able to substitute values into a formula given in symbols, words or as a flow chart. polynomials simple rational expressions exponential growth and decay trigonometric functions (sin and cos). a3 Be able to solve equations and change the subject of a formula. In simple cases using the four operations, powers and roots. Solve more complex equations using trial and improvement or a graphical method. Resources MEI Free Resources Introduction to Quantitative Methods: Representing the real world ma thematically 1: Algebra External Resources: Improving learning in mathemat ics: mostly algebra Formulas used in nursing calcul ations Mathematics Assessment Proje ct
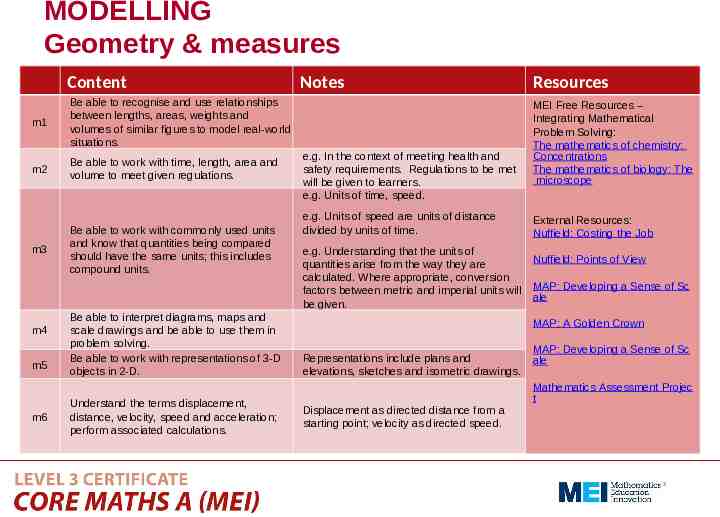
MODELLING Geometry & measures Content m1 Be able to recognise and use relationships between lengths, areas, weights and volumes of similar figures to model real-world situations. m2 Be able to work with time, length, area and volume to meet given regulations. m3 Be able to work with commonly used units and know that quantities being compared should have the same units; this includes compound units. m4 m5 m6 Be able to interpret diagrams, maps and scale drawings and be able to use them in problem solving. Be able to work with representations of 3-D objects in 2-D. Understand the terms displacement, distance, velocity, speed and acceleration; perform associated calculations. Notes e.g. In the context of meeting health and safety requirements. Regulations to be met will be given to learners. e.g. Units of time, speed. e.g. Units of speed are units of distance divided by units of time. e.g. Understanding that the units of quantities arise from the way they are calculated. Where appropriate, conversion factors between metric and imperial units will be given. Resources MEI Free Resources – Integrating Mathematical Problem Solving: The mathematics of chemistry: Concentrations The mathematics of biology: The microscope External Resources: Nuffield: Costing the Job Nuffield: Points of View MAP: Developing a Sense of Sc ale MAP: A Golden Crown Representations include plans and elevations, sketches and isometric drawings. MAP: Developing a Sense of Sc ale Mathematics Assessment Projec t Displacement as directed distance from a starting point; velocity as directed speed.
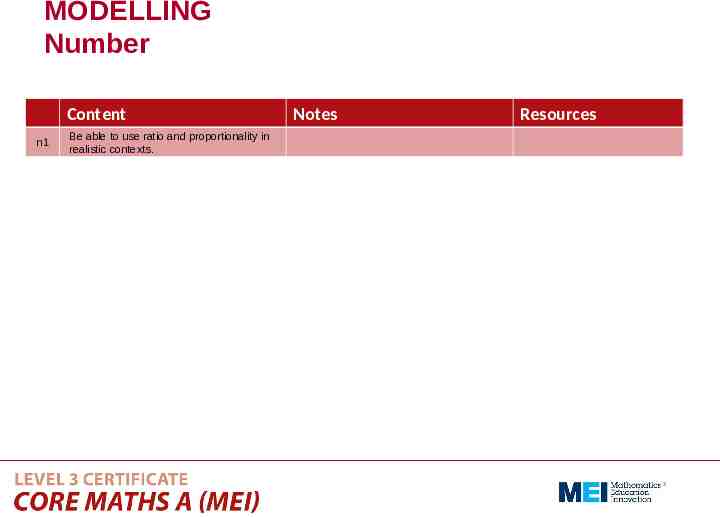
MODELLING Number Content n1 Be able to use ratio and proportionality in realistic contexts. Notes Resources
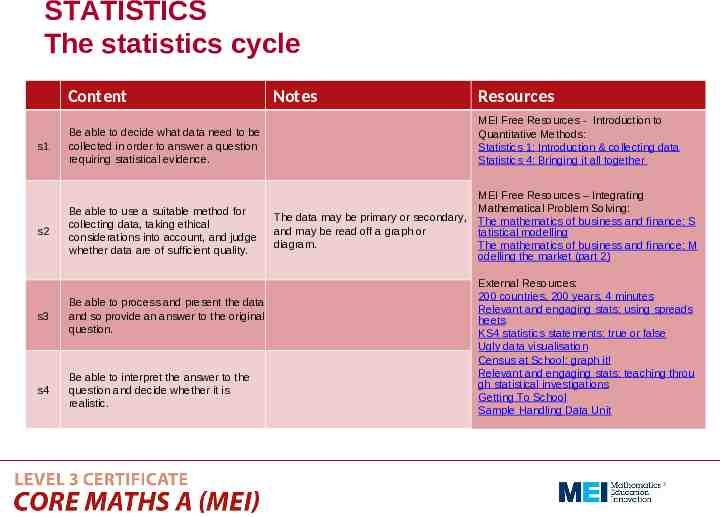
STATISTICS The statistics cycle Content s1 s2 Notes Resources Be able to decide what data need to be collected in order to answer a question requiring statistical evidence. MEI Free Resources - Introduction to Quantitative Methods: Statistics 1: Introduction & collecting data Statistics 4: Bringing it all together Be able to use a suitable method for collecting data, taking ethical considerations into account, and judge whether data are of sufficient quality. MEI Free Resources – Integrating Mathematical Problem Solving: The mathematics of business and finance: S tatistical modelling The mathematics of business and finance: M odelling the market (part 2) s3 Be able to process and present the data and so provide an answer to the original question. s4 Be able to interpret the answer to the question and decide whether it is realistic. The data may be primary or secondary, and may be read off a graph or diagram. External Resources: 200 countries, 200 years, 4 minutes Relevant and engaging stats: using spreads heets KS4 statistics statements: true or false Ugly data visualisation Census at School: graph it! Relevant and engaging stats: teaching throu gh statistical investigations Getting To School Sample Handling Data Unit
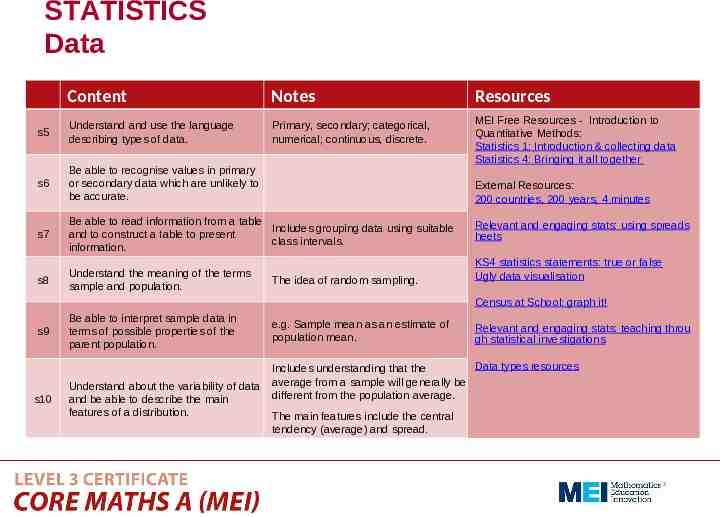
STATISTICS Data Content Notes s5 Understand and use the language describing types of data. Primary, secondary; categorical, numerical; continuous, discrete. s6 Be able to recognise values in primary or secondary data which are unlikely to be accurate. s7 Be able to read information from a table Includes grouping data using suitable and to construct a table to present class intervals. information. s8 Understand the meaning of the terms sample and population. Resources MEI Free Resources - Introduction to Quantitative Methods: Statistics 1: Introduction & collecting data Statistics 4: Bringing it all together External Resources: 200 countries, 200 years, 4 minutes The idea of random sampling. Relevant and engaging stats: using spreads heets KS4 statistics statements: true or false Ugly data visualisation Census at School: graph it! s9 s10 Be able to interpret sample data in terms of possible properties of the parent population. Understand about the variability of data and be able to describe the main features of a distribution. e.g. Sample mean as an estimate of population mean. Relevant and engaging stats: teaching throu gh statistical investigations Data types resources Includes understanding that the average from a sample will generally be different from the population average. The main features include the central tendency (average) and spread.
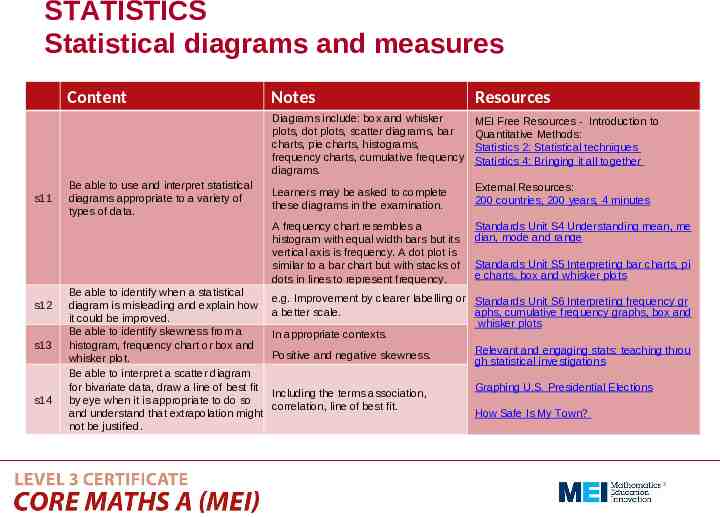
STATISTICS Statistical diagrams and measures Content s11 s12 s13 s14 Be able to use and interpret statistical diagrams appropriate to a variety of types of data. Be able to identify when a statistical diagram is misleading and explain how it could be improved. Be able to identify skewness from a histogram, frequency chart or box and whisker plot. Be able to interpret a scatter diagram for bivariate data, draw a line of best fit by eye when it is appropriate to do so and understand that extrapolation might not be justified. Notes Resources Diagrams include: box and whisker plots, dot plots, scatter diagrams, bar charts, pie charts, histograms, frequency charts, cumulative frequency diagrams. MEI Free Resources - Introduction to Quantitative Methods: Statistics 2: Statistical techniques Statistics 4: Bringing it all together Learners may be asked to complete these diagrams in the examination. External Resources: 200 countries, 200 years, 4 minutes A frequency chart resembles a histogram with equal width bars but its vertical axis is frequency. A dot plot is similar to a bar chart but with stacks of dots in lines to represent frequency. Standards Unit S4 Understanding mean, me dian, mode and range Standards Unit S5 Interpreting bar charts, pi e charts, box and whisker plots e.g. Improvement by clearer labelling or Standards Unit S6 Interpreting frequency gr a better scale. aphs, cumulative frequency graphs, box and whisker plots In appropriate contexts. Relevant and engaging stats: teaching throu Positive and negative skewness. gh statistical investigations Including the terms association, correlation, line of best fit. Graphing U.S. Presidential Elections How Safe Is My Town?
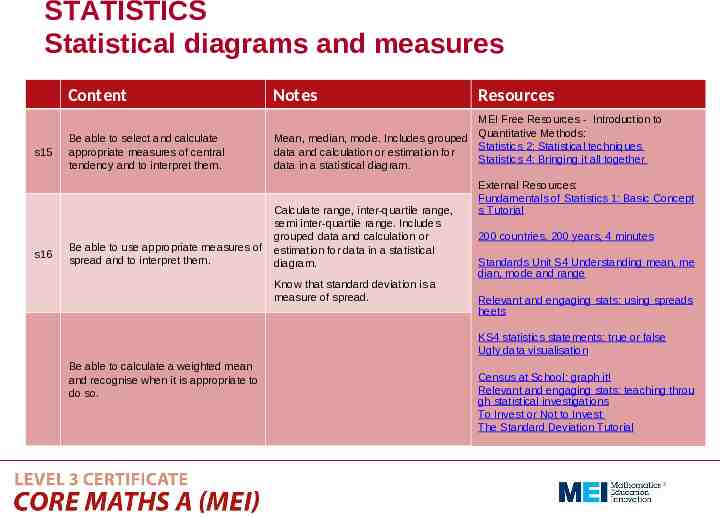
STATISTICS Statistical diagrams and measures s15 s16 Content Notes Be able to select and calculate appropriate measures of central tendency and to interpret them. MEI Free Resources - Introduction to Quantitative Methods: Mean, median, mode. Includes grouped Statistics 2: Statistical techniques data and calculation or estimation for Statistics 4: Bringing it all together data in a statistical diagram. Be able to use appropriate measures of spread and to interpret them. Calculate range, inter-quartile range, semi inter-quartile range. Includes grouped data and calculation or estimation for data in a statistical diagram. Know that standard deviation is a measure of spread. Resources External Resources: Fundamentals of Statistics 1: Basic Concept s Tutorial 200 countries, 200 years, 4 minutes Standards Unit S4 Understanding mean, me dian, mode and range Relevant and engaging stats: using spreads heets KS4 statistics statements: true or false Ugly data visualisation Be able to calculate a weighted mean and recognise when it is appropriate to do so. Census at School: graph it! Relevant and engaging stats: teaching throu gh statistical investigations To Invest or Not to Invest The Standard Deviation Tutorial
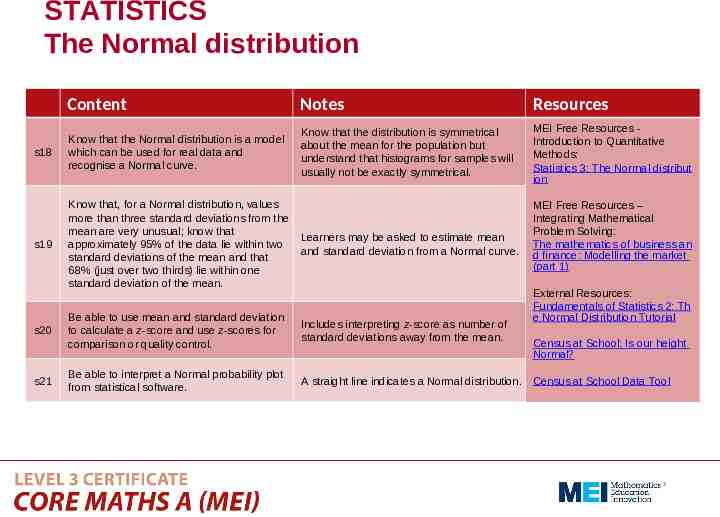
STATISTICS The Normal distribution Content Notes Resources s18 Know that the Normal distribution is a model which can be used for real data and recognise a Normal curve. Know that the distribution is symmetrical about the mean for the population but understand that histograms for samples will usually not be exactly symmetrical. MEI Free Resources Introduction to Quantitative Methods: Statistics 3: The Normal distribut ion s19 Know that, for a Normal distribution, values more than three standard deviations from the mean are very unusual; know that approximately 95% of the data lie within two standard deviations of the mean and that 68% (just over two thirds) lie within one standard deviation of the mean. Learners may be asked to estimate mean and standard deviation from a Normal curve. Be able to use mean and standard deviation to calculate a z-score and use z-scores for comparison or quality control. Includes interpreting z-score as number of standard deviations away from the mean. Be able to interpret a Normal probability plot from statistical software. A straight line indicates a Normal distribution. s20 s21 MEI Free Resources – Integrating Mathematical Problem Solving: The mathematics of business an d finance: Modelling the market (part 1) External Resources: Fundamentals of Statistics 2: Th e Normal Distribution Tutorial Census at School: Is our height Normal? Census at School Data Tool
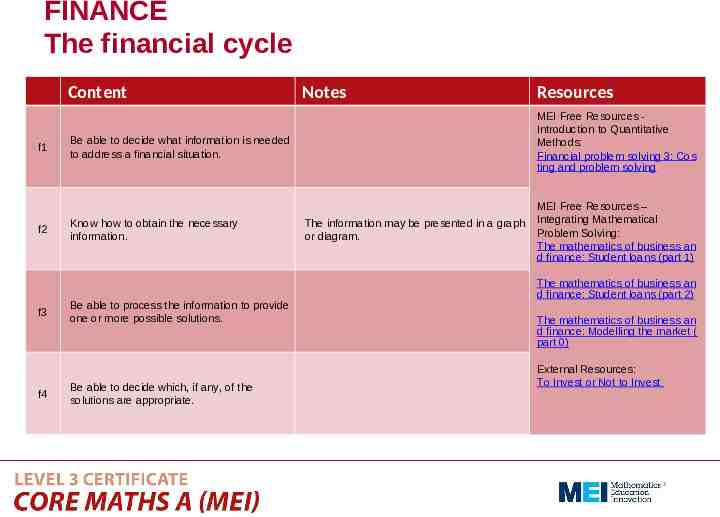
FINANCE The financial cycle Content f1 f2 f3 f4 Notes MEI Free Resources Introduction to Quantitative Methods: Financial problem solving 3: Cos ting and problem solving Be able to decide what information is needed to address a financial situation. Know how to obtain the necessary information. Be able to process the information to provide one or more possible solutions. Be able to decide which, if any, of the solutions are appropriate. Resources The information may be presented in a graph or diagram. MEI Free Resources – Integrating Mathematical Problem Solving: The mathematics of business an d finance: Student loans (part 1) The mathematics of business an d finance: Student loans (part 2) The mathematics of business an d finance: Modelling the market ( part 0) External Resources: To Invest or Not to Invest
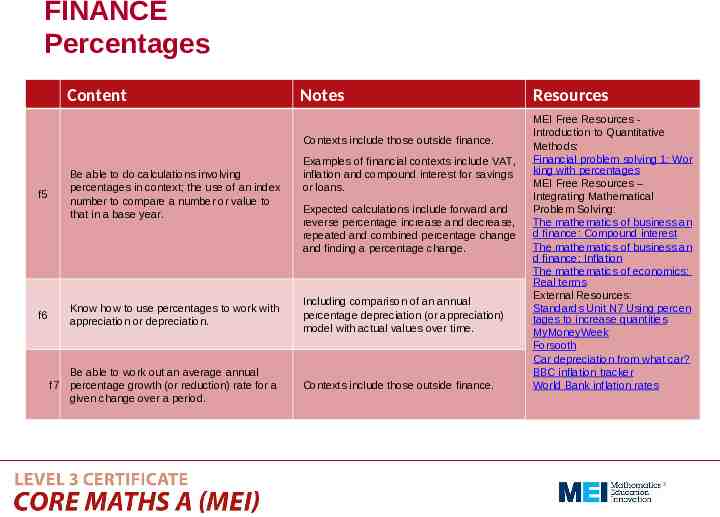
FINANCE Percentages Content Notes Contexts include those outside finance. Be able to do calculations involving percentages in context; the use of an index number to compare a number or value to that in a base year. f5 f6 f7 Examples of financial contexts include VAT, inflation and compound interest for savings or loans. Expected calculations include forward and reverse percentage increase and decrease, repeated and combined percentage change and finding a percentage change. Know how to use percentages to work with appreciation or depreciation. Including comparison of an annual percentage depreciation (or appreciation) model with actual values over time. Be able to work out an average annual percentage growth (or reduction) rate for a given change over a period. Contexts include those outside finance. Resources MEI Free Resources Introduction to Quantitative Methods: Financial problem solving 1: Wor king with percentages MEI Free Resources – Integrating Mathematical Problem Solving: The mathematics of business an d finance: Compound interest The mathematics of business an d finance: Inflation The mathematics of economics: Real terms External Resources: Standards Unit N7 Using percen tages to increase quantities MyMoneyWeek Forsooth Car depreciation from what car? BBC inflation tracker World Bank inflation rates
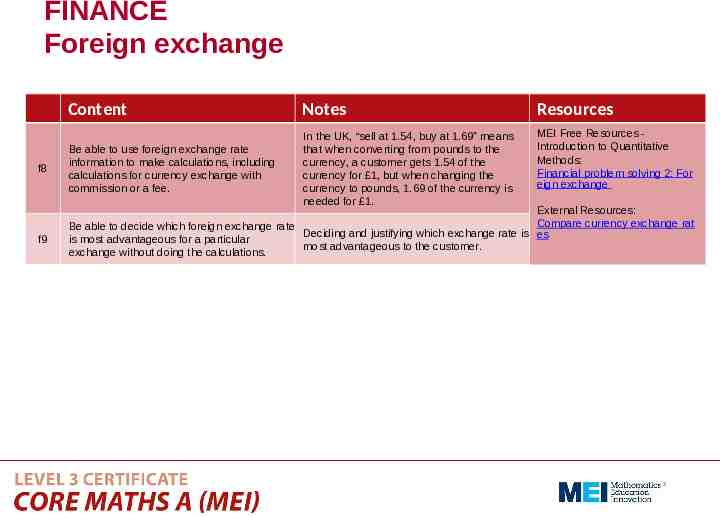
FINANCE Foreign exchange f8 f9 Content Notes Resources Be able to use foreign exchange rate information to make calculations, including calculations for currency exchange with commission or a fee. In the UK, “sell at 1.54, buy at 1.69” means that when converting from pounds to the currency, a customer gets 1.54 of the currency for 1, but when changing the currency to pounds, 1.69 of the currency is needed for 1. MEI Free Resources Introduction to Quantitative Methods: Financial problem solving 2: For eign exchange External Resources: Compare currency exchange rat Be able to decide which foreign exchange rate Deciding and justifying which exchange rate is es is most advantageous for a particular most advantageous to the customer. exchange without doing the calculations.
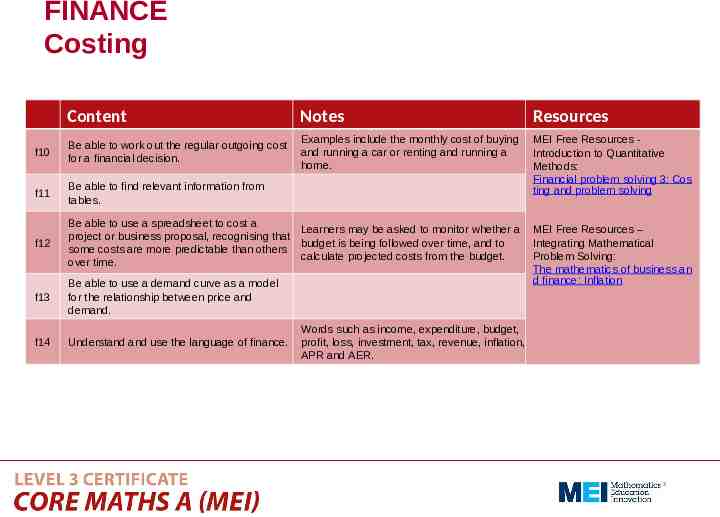
FINANCE Costing Content Notes Resources f10 Be able to work out the regular outgoing cost for a financial decision. Examples include the monthly cost of buying and running a car or renting and running a home. f11 Be able to find relevant information from tables. MEI Free Resources Introduction to Quantitative Methods: Financial problem solving 3: Cos ting and problem solving f12 Be able to use a spreadsheet to cost a Learners may be asked to monitor whether a project or business proposal, recognising that budget is being followed over time, and to some costs are more predictable than others calculate projected costs from the budget. over time. f13 Be able to use a demand curve as a model for the relationship between price and demand. f14 Understand and use the language of finance. Words such as income, expenditure, budget, profit, loss, investment, tax, revenue, inflation, APR and AER. MEI Free Resources – Integrating Mathematical Problem Solving: The mathematics of business an d finance: Inflation
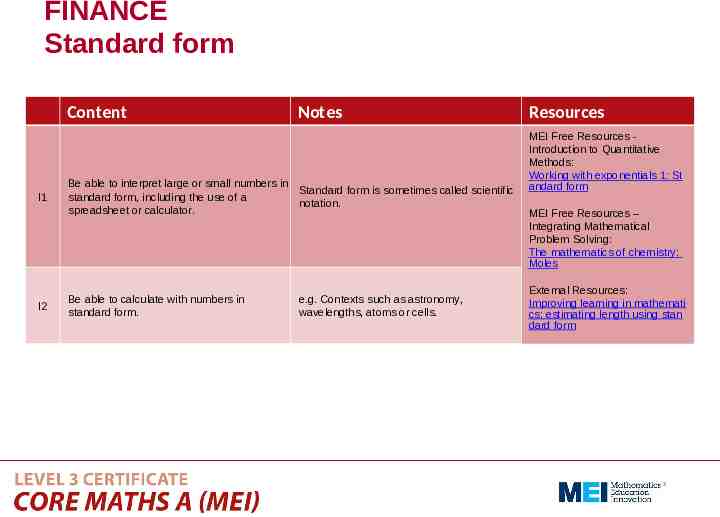
FINANCE Standard form Content l1 l2 Notes Be able to interpret large or small numbers in Standard form is sometimes called scientific standard form, including the use of a notation. spreadsheet or calculator. Be able to calculate with numbers in standard form. e.g. Contexts such as astronomy, wavelengths, atoms or cells. Resources MEI Free Resources Introduction to Quantitative Methods: Working with exponentials 1: St andard form MEI Free Resources – Integrating Mathematical Problem Solving: The mathematics of chemistry: Moles External Resources: Improving learning in mathemati cs: estimating length using stan dard form
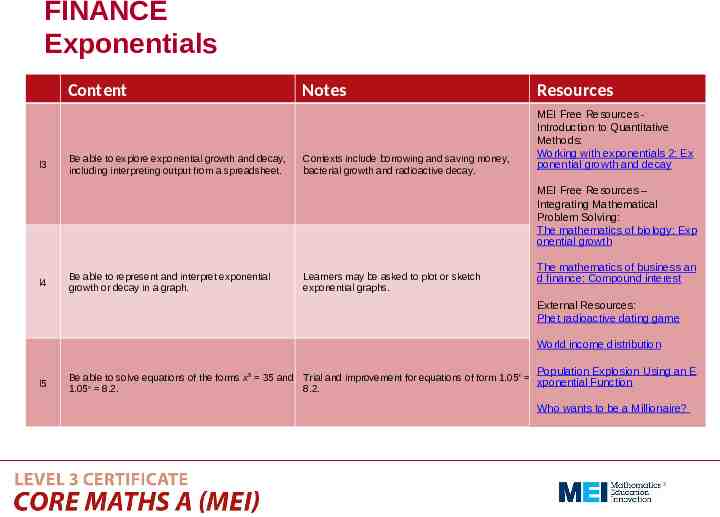
FINANCE Exponentials Content l3 Be able to explore exponential growth and decay, including interpreting output from a spreadsheet. Notes Contexts include borrowing and saving money, bacterial growth and radioactive decay. Resources MEI Free Resources Introduction to Quantitative Methods: Working with exponentials 2: Ex ponential growth and decay MEI Free Resources – Integrating Mathematical Problem Solving: The mathematics of biology: Exp onential growth l4 Be able to represent and interpret exponential growth or decay in a graph. Learners may be asked to plot or sketch exponential graphs. The mathematics of business an d finance: Compound interest External Resources: Phet radioactive dating game World income distribution l5 Be able to solve equations of the forms x5 35 and 1.05x 8.2. Population Explosion Using an E Trial and improvement for equations of form 1.05x xponential Function 8.2. Who wants to be a Millionaire?
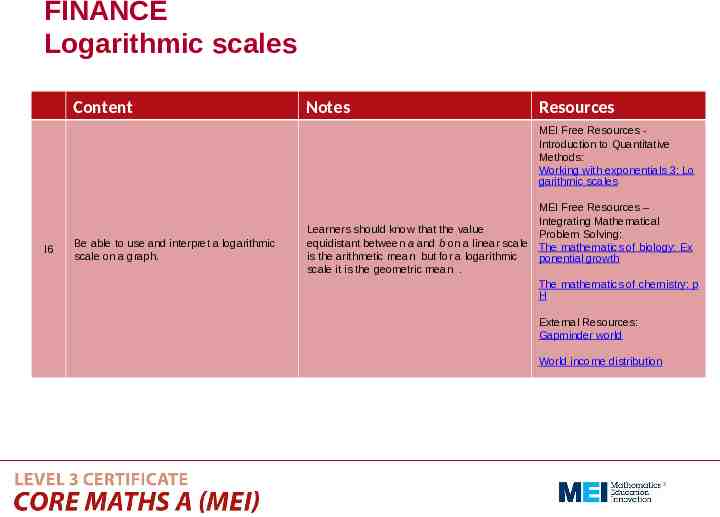
FINANCE Logarithmic scales Content Notes Resources MEI Free Resources Introduction to Quantitative Methods: Working with exponentials 3: Lo garithmic scales l6 Be able to use and interpret a logarithmic scale on a graph. MEI Free Resources – Integrating Mathematical Learners should know that the value Problem Solving: equidistant between a and b on a linear scale The mathematics of biology: Ex is the arithmetic mean but for a logarithmic ponential growth scale it is the geometric mean . The mathematics of chemistry: p H External Resources: Gapminder world World income distribution
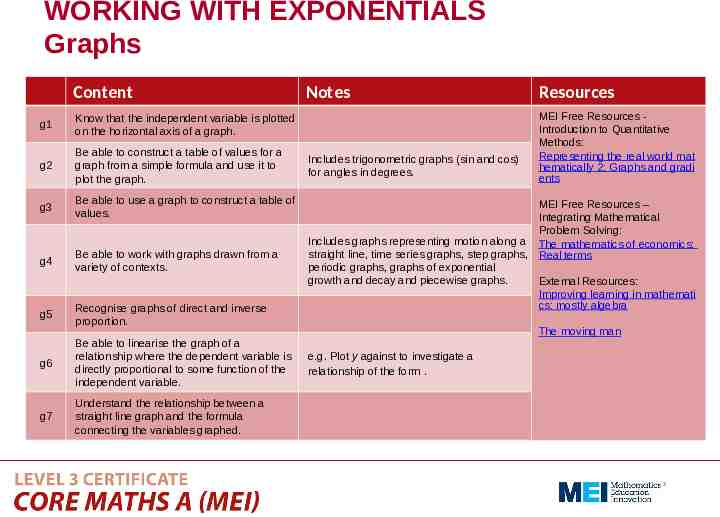
WORKING WITH EXPONENTIALS Graphs Content g1 Know that the independent variable is plotted on the horizontal axis of a graph. g2 Be able to construct a table of values for a graph from a simple formula and use it to plot the graph. g3 Be able to use a graph to construct a table of values. g4 Be able to work with graphs drawn from a variety of contexts. g5 Recognise graphs of direct and inverse proportion. g6 Be able to linearise the graph of a relationship where the dependent variable is directly proportional to some function of the independent variable. g7 Understand the relationship between a straight line graph and the formula connecting the variables graphed. Notes Resources Includes trigonometric graphs (sin and cos) for angles in degrees. MEI Free Resources Introduction to Quantitative Methods: Representing the real world mat hematically 2: Graphs and gradi ents MEI Free Resources – Integrating Mathematical Problem Solving: Includes graphs representing motion along a The mathematics of economics: straight line, time series graphs, step graphs, Real terms periodic graphs, graphs of exponential growth and decay and piecewise graphs. External Resources: Improving learning in mathemati cs: mostly algebra The moving man e.g. Plot y against to investigate a relationship of the form .
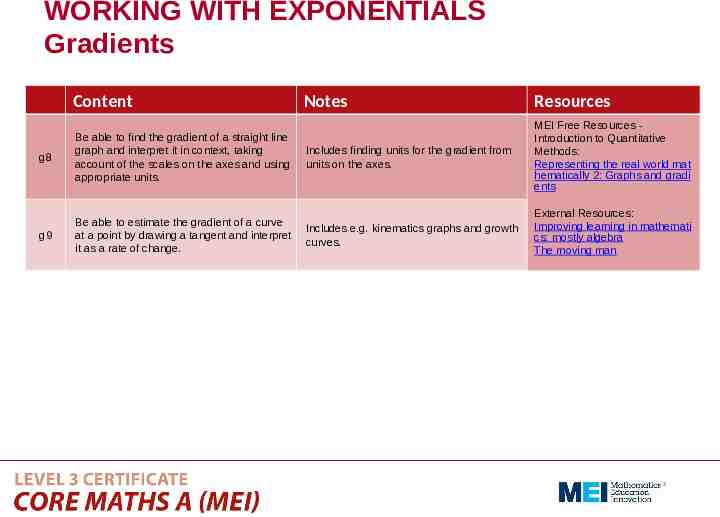
WORKING WITH EXPONENTIALS Gradients Content g8 Be able to find the gradient of a straight line graph and interpret it in context, taking account of the scales on the axes and using appropriate units. g9 Be able to estimate the gradient of a curve at a point by drawing a tangent and interpret it as a rate of change. Notes Resources Includes finding units for the gradient from units on the axes. MEI Free Resources Introduction to Quantitative Methods: Representing the real world mat hematically 2: Graphs and gradi ents Includes e.g. kinematics graphs and growth curves. External Resources: Improving learning in mathemati cs: mostly algebra The moving man
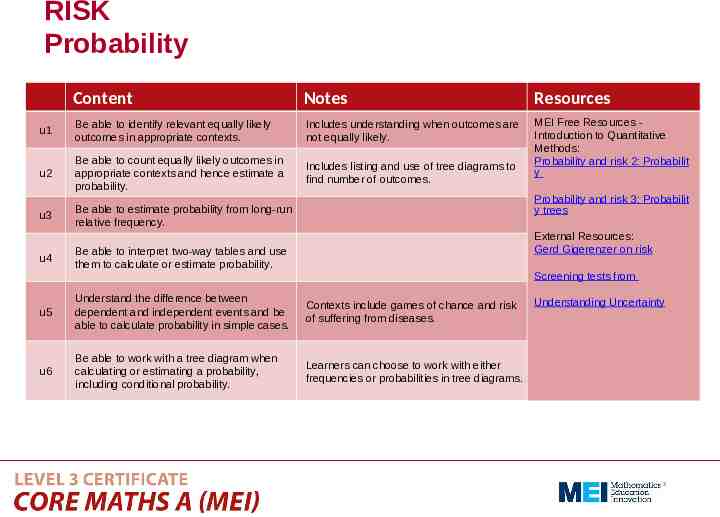
RISK Probability Content Notes Resources u1 Be able to identify relevant equally likely outcomes in appropriate contexts. Includes understanding when outcomes are not equally likely. u2 Be able to count equally likely outcomes in appropriate contexts and hence estimate a probability. Includes listing and use of tree diagrams to find number of outcomes. MEI Free Resources Introduction to Quantitative Methods: Probability and risk 2: Probabilit y u3 Be able to estimate probability from long-run relative frequency. u4 Probability and risk 3: Probabilit y trees External Resources: Gerd Gigerenzer on risk Be able to interpret two-way tables and use them to calculate or estimate probability. Screening tests from u5 Understand the difference between dependent and independent events and be able to calculate probability in simple cases. Contexts include games of chance and risk of suffering from diseases. u6 Be able to work with a tree diagram when calculating or estimating a probability, including conditional probability. Learners can choose to work with either frequencies or probabilities in tree diagrams. Understanding Uncertainty
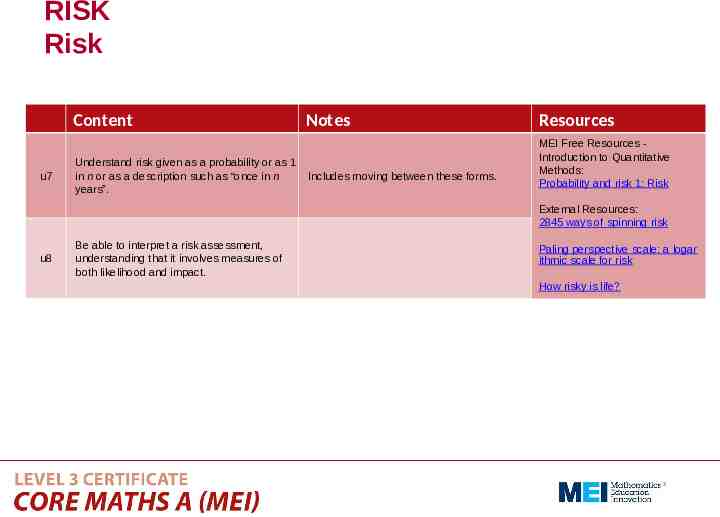
RISK Risk Content u7 Understand risk given as a probability or as 1 in n or as a description such as “once in n years”. Notes Includes moving between these forms. Resources MEI Free Resources Introduction to Quantitative Methods: Probability and risk 1: Risk External Resources: 2845 ways of spinning risk u8 Be able to interpret a risk assessment, understanding that it involves measures of both likelihood and impact. Paling perspective scale: a logar ithmic scale for risk How risky is life?
Component 02 Critical Maths CONTENT
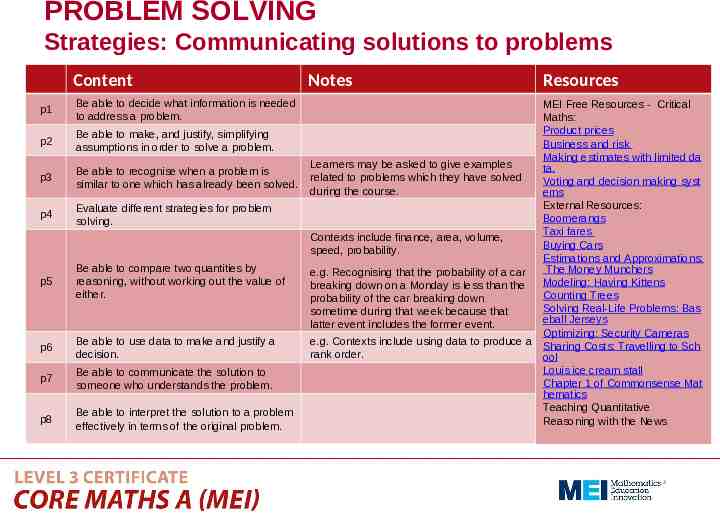
PROBLEM SOLVING Strategies: Communicating solutions to problems Content Notes Resources p1 Be able to decide what information is needed to address a problem. p2 Be able to make, and justify, simplifying assumptions in order to solve a problem. p3 Be able to recognise when a problem is similar to one which has already been solved. p4 Evaluate different strategies for problem solving. p5 Be able to compare two quantities by reasoning, without working out the value of either. p6 Be able to use data to make and justify a decision. p7 Be able to communicate the solution to someone who understands the problem. p8 Be able to interpret the solution to a problem effectively in terms of the original problem. MEI Free Resources - Critical Maths: Product prices Business and risk Making estimates with limited da Learners may be asked to give examples ta. related to problems which they have solved Voting and decision making syst during the course. ems External Resources: Boomerangs Taxi fares Contexts include finance, area, volume, Buying Cars speed, probability. Estimations and Approximations: The Money Munchers e.g. Recognising that the probability of a car Modeling: Having Kittens breaking down on a Monday is less than the Counting Trees probability of the car breaking down Solving Real-Life Problems: Bas sometime during that week because that eball Jerseys latter event includes the former event. Optimizing: Security Cameras e.g. Contexts include using data to produce a Sharing Costs: Travelling to Sch rank order. ool Louis ice cream stall Chapter 1 of Commonsense Mat hematics Teaching Quantitative Reasoning with the News
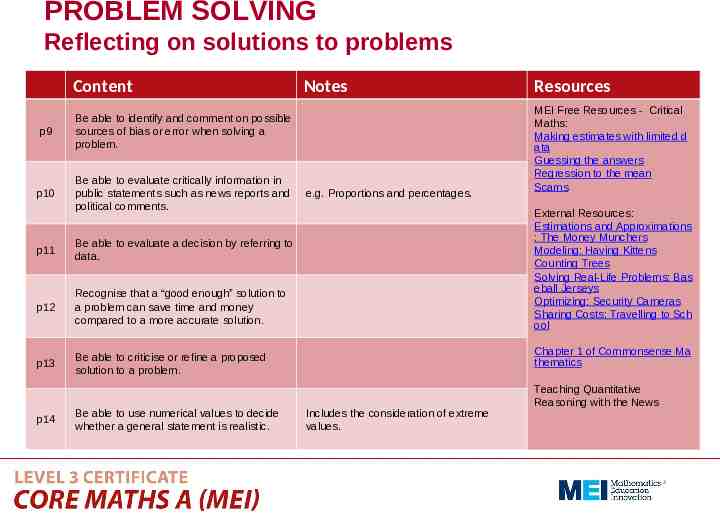
PROBLEM SOLVING Reflecting on solutions to problems Content p9 Be able to identify and comment on possible sources of bias or error when solving a problem. p10 Be able to evaluate critically information in public statements such as news reports and political comments. p11 Be able to evaluate a decision by referring to data. p12 Recognise that a “good enough” solution to a problem can save time and money compared to a more accurate solution. p13 Be able to criticise or refine a proposed solution to a problem. p14 Be able to use numerical values to decide whether a general statement is realistic. Notes e.g. Proportions and percentages. Resources MEI Free Resources - Critical Maths: Making estimates with limited d ata Guessing the answers Regression to the mean Scams External Resources: Estimations and Approximations : The Money Munchers Modeling: Having Kittens Counting Trees Solving Real-Life Problems: Bas eball Jerseys Optimizing: Security Cameras Sharing Costs: Travelling to Sch ool Chapter 1 of Commonsense Ma thematics Includes the consideration of extreme values. Teaching Quantitative Reasoning with the News
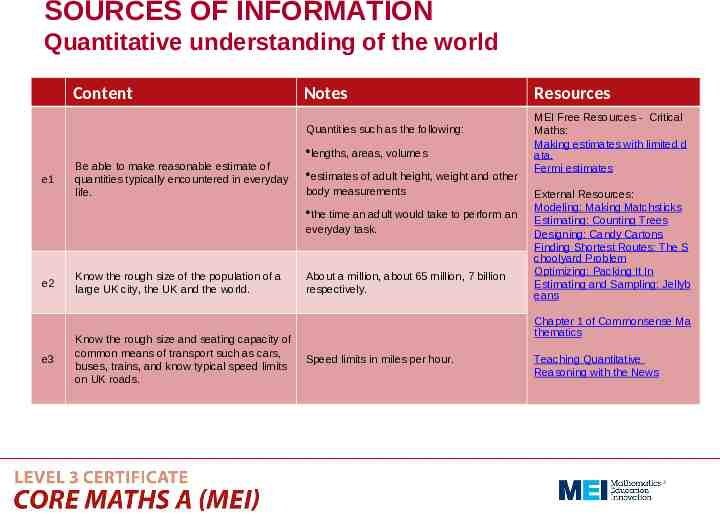
SOURCES OF INFORMATION Quantitative understanding of the world Content Notes Quantities such as the following: lengths, areas, volumes e1 Be able to make reasonable estimate of quantities typically encountered in everyday life. estimates of adult height, weight and other body measurements the time an adult would take to perform an everyday task. e2 e3 Know the rough size of the population of a large UK city, the UK and the world. Know the rough size and seating capacity of common means of transport such as cars, buses, trains, and know typical speed limits on UK roads. About a million, about 65 million, 7 billion respectively. Resources MEI Free Resources - Critical Maths: Making estimates with limited d ata. Fermi estimates External Resources: Modeling: Making Matchsticks Estimating: Counting Trees Designing: Candy Cartons Finding Shortest Routes: The S choolyard Problem Optimizing: Packing It In Estimating and Sampling: Jellyb eans Chapter 1 of Commonsense Ma thematics Speed limits in miles per hour. Teaching Quantitative Reasoning with the News
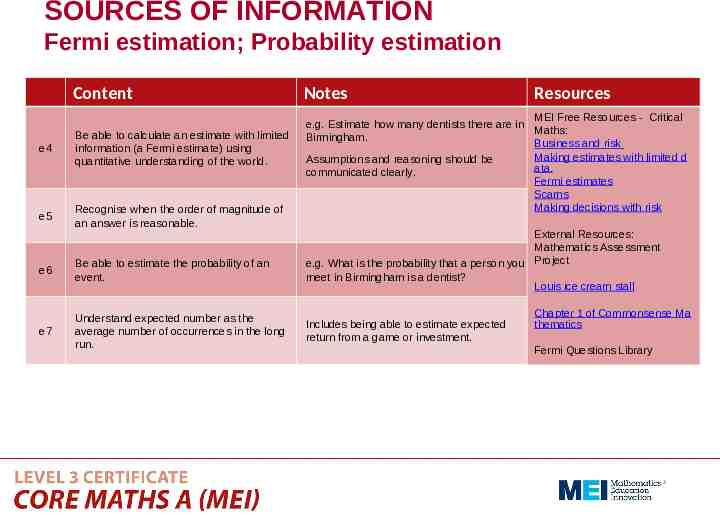
SOURCES OF INFORMATION Fermi estimation; Probability estimation Content e4 Be able to calculate an estimate with limited information (a Fermi estimate) using quantitative understanding of the world. e5 Recognise when the order of magnitude of an answer is reasonable. e6 Be able to estimate the probability of an event. e7 Understand expected number as the average number of occurrences in the long run. Notes Resources MEI Free Resources - Critical e.g. Estimate how many dentists there are in Maths: Birmingham. Business and risk Making estimates with limited d Assumptions and reasoning should be ata. communicated clearly. Fermi estimates Scams Making decisions with risk External Resources: Mathematics Assessment e.g. What is the probability that a person you Project meet in Birmingham is a dentist? Louis ice cream stall Includes being able to estimate expected return from a game or investment. Chapter 1 of Commonsense Ma thematics Fermi Questions Library
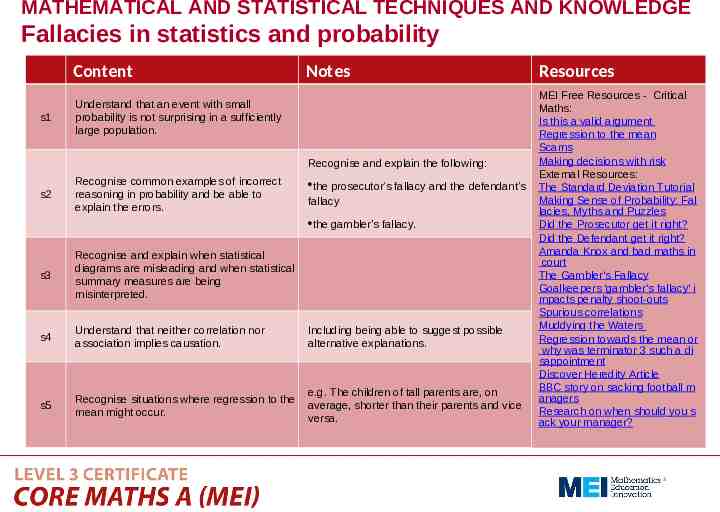
MATHEMATICAL AND STATISTICAL TECHNIQUES AND KNOWLEDGE Fallacies in statistics and probability Content s1 Notes Understand that an event with small probability is not surprising in a sufficiently large population. Recognise and explain the following: s2 Recognise common examples of incorrect reasoning in probability and be able to explain the errors. the prosecutor’s fallacy and the defendant’s fallacy the gambler’s fallacy. s3 Recognise and explain when statistical diagrams are misleading and when statistical summary measures are being misinterpreted. s4 Understand that neither correlation nor association implies causation. Including being able to suggest possible alternative explanations. s5 Recognise situations where regression to the mean might occur. e.g. The children of tall parents are, on average, shorter than their parents and vice versa. Resources MEI Free Resources - Critical Maths: Is this a valid argument Regression to the mean Scams Making decisions with risk External Resources: The Standard Deviation Tutorial Making Sense of Probability: Fal lacies, Myths and Puzzles Did the Prosecutor get it right? Did the Defendant get it right? Amanda Knox and bad maths in court The Gambler's Fallacy Goalkeepers 'gambler's fallacy' i mpacts penalty shoot-outs Spurious correlations Muddying the Waters Regression towards the mean or why was terminator 3 such a di sappointment Discover Heredity Article BBC story on sacking football m anagers Research on when should you s ack your manager?
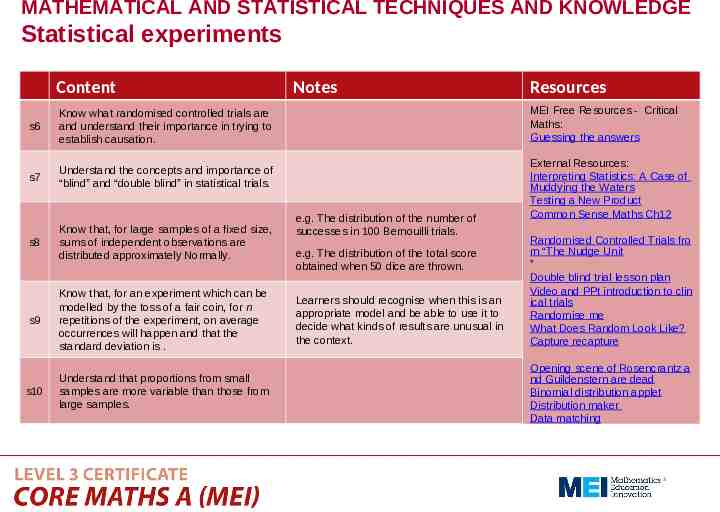
MATHEMATICAL AND STATISTICAL TECHNIQUES AND KNOWLEDGE Statistical experiments Content s6 Know what randomised controlled trials are and understand their importance in trying to establish causation. s7 Understand the concepts and importance of “blind” and “double blind” in statistical trials. s8 Know that, for large samples of a fixed size, sums of independent observations are distributed approximately Normally. s9 Know that, for an experiment which can be modelled by the toss of a fair coin, for n repetitions of the experiment, on average occurrences will happen and that the standard deviation is . s10 Understand that proportions from small samples are more variable than those from large samples. Notes Resources MEI Free Resources - Critical Maths: Guessing the answers e.g. The distribution of the number of successes in 100 Bernouilli trials. e.g. The distribution of the total score obtained when 50 dice are thrown. Learners should recognise when this is an appropriate model and be able to use it to decide what kinds of results are unusual in the context. External Resources: Interpreting Statistics: A Case of Muddying the Waters Testing a New Product Common Sense Maths Ch12 Randomised Controlled Trials fro m “The Nudge Unit ” Double blind trial lesson plan Video and PPt introduction to clin ical trials Randomise me What Does Random Look Like? Capture recapture Opening scene of Rosencrantz a nd Guildenstern are dead Binomial distribution applet Distribution maker Data matching
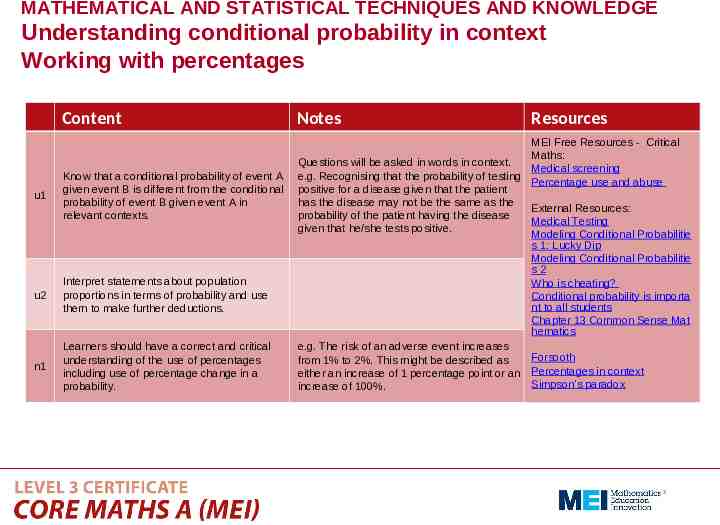
MATHEMATICAL AND STATISTICAL TECHNIQUES AND KNOWLEDGE Understanding conditional probability in context Working with percentages Content u1 Know that a conditional probability of event A given event B is different from the conditional probability of event B given event A in relevant contexts. u2 Interpret statements about population proportions in terms of probability and use them to make further deductions. n1 Learners should have a correct and critical understanding of the use of percentages including use of percentage change in a probability. Notes Resources MEI Free Resources - Critical Maths: Questions will be asked in words in context. Medical screening e.g. Recognising that the probability of testing Percentage use and abuse positive for a disease given that the patient has the disease may not be the same as the External Resources: probability of the patient having the disease Medical Testing given that he/she tests positive. Modeling Conditional Probabilitie s 1: Lucky Dip Modeling Conditional Probabilitie s2 Who is cheating? Conditional probability is importa nt to all students Chapter 13 Common Sense Mat hematics e.g. The risk of an adverse event increases Forsooth from 1% to 2%. This might be described as either an increase of 1 percentage point or an Percentages in context Simpson’s paradox increase of 100%.