Financial Crisis, Recession, Stimulus & the Future of the P/C


66 Slides3.36 MB
Financial Crisis, Recession, Stimulus & the Future of the P/C Insurance Industry Trends, Challenges & Opportunities Surety and Fidelity Association of America 101st Annual Meeting Washington, DC May 14, 2009 Download: http://www.iii.org/media/presentations/SuretyMay09/ Robert P. Hartwig, Ph.D., CPCU, President & Economist Insurance Information Institute 110 William Street New York, NY 10038 Tel: (212) 346-5520 [email protected] www.iii.org
Presentation Outline Financial Crisis & The Weakening Economy: Insurance Impacts for the P/C Insurance Industry Recession, Growth & Insurance Economic Stimulus Impacts Aftershock: The P/C Insurance Landscape After the Crisis Impacts & Implications for P/C Insurers Key Risks for P/C Insurers Financial Strength & Ratings Critical Differences Between P/C Insurers and Banks P/C Insurance Industry Overview & Outlook Profitability Premium Growth Underwriting Performance Financial Market Impacts Capital & Capacity Catastrophe Losses Q&A
THE ECONOMIC STORM What the Financial Crisis and Deep Recession Mean for the P/C Insurance Industry
Recession began in December 2007. Economic toll of credit crunch, housing slump, labor market contraction is growing but recovery is in sight -4% -6% -1.7% -0.2% -2% 0.5% 1.8% 2.8% 0.9% -0.5% 0% 2.2% 2.7% 2.8% 3.0% 4.8% 4.8% The Q4:2008 decline was the steepest since the Q1:1982 drop of 6.4% 0.1% 2% 2.5% 3.6% 3.1% 2.9% 4% 0.8% 1.6% 6% 3.7% Real GDP Growth* *Blue bars are Estimates/Forecasts from Blue Chip Economic Indicators. Source: US Department of Commerce, Blue Economic Indicators 5/09; Insurance Information Institute. 10 :4Q 10:3Q 10:2Q 10 :1Q 09 :4Q 09 :3Q 09 :2 Q 09 :1 Q 08 :4Q 08 :3Q 08 :2Q 08 :1 Q 07 :4 Q 07 :3 Q 07:2 Q 2 0 06 2 0 05 2 0 04 2 0 03 2 0 02 20 0 1 20 0 0 -8% 07:1 Q -6.3% -6.1%
10% 5% 0% -5% -10% 5.2% 78 79 -0.9% 80-7.4% 81 -6.5% 82 -1.5% 1.8% 83 4.3% 84 85 86 5.8% 87 88 0.3% -1.6% 89 -1.0% 90 91 -1.8% -1.0% 92 3.1% 93 94 1.1% 0.8% 95 0.4% 96 0.6% 97 -0.4% 98 -0.3% 99 1.6% 00 5.6% 01 02 7.7% 03 1.2% 04 -2.9% 05 -0.5% 06 -3.8% 07 -4.4% 08E 1.7% 09F Real NWP Growth 15% Real NWP Growth Real GDP 8% 6% 4% 2% 0% -2% -4% Sources: A.M. Best, US Bureau of Economic Analysis, Blue Chip Economic Indicators, 5/09; Insurance Information Real GDP Growth 20% P/C insurance industry’s growth is influenced modestly by growth in the overall economy 13.7% 25% 18.6% 20.3% Real GDP Growth vs. Real P/C Premium Growth: Modest Association
Length of U.S. Business Cycles, 1929-Present* Duration (Months) 120 110 100 90 80 Contraction Expansion Following Average Duration** Recession 10.4 Months Expansion 60.5 Months 80 106 Length of expansions greatly exceeds contractions 58 70 60 50 50 43 37 40 45 39 73 24 13 20 10 * 92 36 30 Month 0 Recession Started 120 Aug. 1929 May 1937 8 Feb. 1945 11 Nov. 1948 10 July 1953 8 Aug. 1957 10 Apr. 1960 11 Dec. 1969 16 6 Nov. 1973 12 16 Jan. 1980 As of May 2009, inclusive; **Post-WW II period through end of most recent expansion. Sources: National Bureau of Economic Research; Insurance Information Institute. Jul. 1981 18 8 Jul. 1990 8 Mar. 2001 Dec. 2007
Annual Inflation Rates (CPI-U, %), 1990-2010F 6.0 5.0 4.0 3.0 2.0 Inflation peaked at 5.6% in August 2008 on high energy and commodity crisis. The recession and the collapse of the commodity bubble have produced temporary deflation. 4.9 5.1 3.0 3.2 3.8 3.3 3.4 2.9 2.8 2.4 2.6 1.5 2.5 2.3 1.9 3.0 3.8 2.8 1.7 1.3 1.0 0.0 (1.0) (0.8) (2.0) 90 91 92 93 94 95 96 97 98 99 00 01 02 03 04 05 06 07 08 09F10F Sources: US Bureau of Labor Statistics; Blue Chip Economic Indicators, May 10, 2009 (forecasts).
Labor Market Trends Fast & Furious: Massive Job Losses Sap the Economy Workers Comp & Other Commercial Exposure
Unemployment Rate: On the Rise January 2000 through April 2009 9.0 8.0 April 2009 unemployment jumped to 8.9%, exceeding the 6.3% peak during the previous cycle, and is now at it highest level since March 1982 Previous Peak: 6.3% in June 2003 7.0 Trough: 4.4% in March 2007 6.0 5.0 Source: US Bureau of Labor Statistics; Insurance Information Institute. Apr-09 Jan-08 Jan-07 Jan-06 Jan-05 Unemployment will likely peak between 9.5% and 10 % during this cycle, impacting payroll sensitive p/c and non-life exposures Jan-04 Jan-03 Jan-02 Jan-01 3.0 Average unemployment rate 2000-07 was 5.0% Jan-00 4.0
9.5% 9.6% 9.8% 9.8% 8.1% 6.9% 6.1% 5.4% 4.9% 4.8% 4.6% 4.5% Unemployment is expected to peak near 10% in early 2010. 9.7% 9.0% Rising unemployment will erode payrolls and workers comp’s exposure base. 4.5% 11.0% 10.5% 10.0% 9.5% 9.0% 8.5% 8.0% 7.5% 7.0% 6.5% 6.0% 5.5% 5.0% 4.5% 4.0% 9.4% U.S. Unemployment Rate, (2007:Q1 to 2010:Q4F)* 07:Q1 07:Q2 07:Q3 07:Q4 08:Q1 08:Q2 08:Q3 08:Q4 09:Q1 09:Q2 09:Q3 09:Q4 10:Q1 10:Q2 10:Q3 10:Q4 * Blue bars are actual; Yellow bars are forecasts Sources: US Bureau of Labor Statistics; Blue Chip Economic Indicators (5/09); Insurance Info. Inst.
State Construction Employment, Dec. 2007 – Dec. 2008 WA NH MT ND VT MN OR ID WY NV CA AZ KS OK NM AK AK TX RI PA IA IL CO NY MI NE UT MA WI SD ME MO OH IN WV KY NC AR SC MS AL NJ DE MD TN LA VA CT GA DC Construction employment declined in 47 of 50 states in 2008 FL HI 16 Sources: 16 0% to -0.1% to -8.8% to -22% Associated America from Bureau of Labor Statistics; Insurance Information Institute. 4%General Contractors of8.5%
90 91 1.36 1.80 1.96 1.85 1.71 1.60 1.57 1.64 1.62 92 93 94 95 96 97 98 99 00 01 0.56 I.I.I. estimates that each incremental 100,000 decline in housing starts costs home insurers 87.5 million in new exposure (gross premium). The net exposure loss in 2009 vs. 2005 is estimated at about 1.3 billion. 0.78 1.47 1.48 1.35 New home starts plunged 34% from 2005-2007; Drop through 2009 is 73% (est.)—a net annual decline of 1.51 million units, lowest since record began in 1959 0.90 1.01 1.29 1.20 1.46 Impacts also for comml. insurers with construction risk exposure 1.19 2.1 2.0 1.9 1.8 1.7 1.6 1.5 1.4 1.3 1.2 1.1 1.0 0.9 0.8 0.7 0.6 0.5 Exposure growth forecast for HO insurers is dim for 2009 with some improvement in 2010. 2.07 New Private Housing Starts, 1990-2010F (Millions of Units) 02 03 04 05 06 07 08 09F 10F Source: US Department of Commerce; Blue Chip Economic Indicators (5/09); Insurance Information Inst.
Total Industrial Production, (2007:Q1 to 2010:Q4F) End of recession in late 2009, Obama stimulus program are expected to benefit impact industrial production and therefore insurance exposure both directly and indirectly 10.0% 1.5% 3.2% 3.6% 0.0% 2.7% 3.2% 3.6% 3.9% -1.2% -4.6% Sources: US Bureau of Labor Statistics; Blue Chip Economic Indicators (5/09); Insurance Info. Inst. 10:Q4 10:Q3 09:Q3 09:Q2 09:Q1 08:Q4 -20.0% 10:Q2 -12.7% 10:Q1 Figures for 2010 revised upwards to reflect expected impact of Obama stimulus program and a gradual economic recovery -7.4% -9.0% 08:Q3 08:Q1 07:Q4 07:Q1 -20.0% 07:Q3 -15.0% 07:Q2 Industrial production began to contracted sharply in late 2008 and plunged in Q1 2009 -10.0% 09:Q4 -5.0% -25.0% 1.5% 0.3% 0.2% 08:Q2 5.0%
AFTERSHOCK What Will the P/C Insurance Industry Look Like After the Crisis? 6 Key Differences
6 Key Differences: P/C Insurance in the Post-Financial Catastrophe World 1. The P/C Insurance Industry Will Be Smaller: The Industry Will Have Shrunk by About 3% in Dollar Terms and by 7% on an Inflation Adjusted Basis, 200709 Falling prices, weak exposure growth, increasing government intervention in private (re)insurance markets, large retentions and alternative forms of risk transfer have siphoned away premium 2. P/C Industry Will Emerge With Its Risk Mgmt. Model More Intact than Most Other Financial Service Segments Benefits of risk-based underwriting, pricing and low leverage clear 3. There Will Be Federal Regulation of Insurers: Now in Waning Months of Pure State-Based Regulation Federal regulation of “systemically important” firms seems certain Solvency and Rates regulation, Consumer Protection may be shared Dual regulation likely; federal/state regulatory conflictsSource: are likely Insurance Info. Inst.
6 Key Differences: P/C Insurance in the Post-Financial Catastrophe World 4. Investment Earnings Will Shrink Dramatically for an Extended Period of Time: Federal Reserve Policy, Shrinking Dividends, Aversion to Stocks Trajectory toward lower investment earnings is being locked in 5. Insurers Will Return to Their Underwriting Roots: Extended Period of Low Investment Exert Pressure to Generate Underwriting Profits Since 1960s Chastened and “derisked” but facing the same (or higher) expected losses, insurers must work harder to match risk to price 6. P/C Insurers: Profitable Before, During & After Crisis: Resiliency Once Again Proven Directly the result of industry’s risk management practices Source: Insurance Information Inst.
Key Issues & Threats Facing P/C Insurers Amid Financial Crisis Manageable Challenges
Important Issues & Threats Facing P/C Insurers in 2009 1. Reloading Capital After “Capital Event” Continued asset price erosion coupled with major “capital event” could lead to shortage of capital among some companies P/C insurers have come to assume that large amounts of capital can be raised quickly and cheaply after major events (post-9/11, Katrina). This assumption may be incorrect in the current environment. Cost of capital is much higher today, reflecting both scarcity & risk Implications: P/C insurers need to protect capital today and develop detailed contingency plans to raise fresh capital & generate internally 2. Long-Term Loss of Investment Return Low interest rates, risk aversion toward equities and many categories of fixed income securities lock in a multi-year trajectory toward ever lower investment gains Many insurers have not adjusted to this new investment paradigm Regulators will not readily accept it; Many will reject it Implication 1: Industry must be prepared to operate in environment with investment earnings accounting for a smaller fraction of profits Implication 2: Implies underwriting discipline of a magnitude not witnessed in this industry in more than 30 years Source: Insurance Information Inst. Lessons from the period 1920-1975
Important Issues & Threats Facing P/C Insurers in 2009 (cont’d) 3. Regulatory Overreach P/C insurers get swept into vast federal regulatory overhaul and subjected to inappropriate , duplicative and costly regulation 4. Tort Threat No tort reform (or protection of recent reforms) is forthcoming from the current Congress or Administration Erosion of recent reforms is a certainty (already happening) Innumerable legislative initiatives will create opportunities to undermine existing reforms and develop new theories and channels of liability Historically extremely costly to p/c insurance industry Source: Insurance Information Inst.
GREEN SHOOTS Is the Recession Nearing an End?
Hopeful Signs That the Economy Will Begin to Recover Soon Recession Appears to be Bottoming Out, Freefall Has Ended Pace of GDP shrinkage is beginning to diminish Pace of job losses is leveling off Major stock market indices well off record lows, anticipating recovery Some signs of retail sales stabilization are evident Financial Sector is Stabilizing Banks are reporting quarterly profits Many banks expanding lending to credit worthy people & businesses Housing Sector Likely to Find Bottom Soon—Still a Bumpy Ride Home are much more affordable (attracting buyers) Mortgage rates are at multi-decade lows (attracting buyers) Freefall in housing starts and existing home sales is ending Inflation & Energy Prices Are Under Control Consumer & Business Debt Loads Are Shrinking Source: Ins. Info. Inst.
THE 787 BILLION ECONOMIC STIMULUS Sectoral Impacts & Implications for P/C Insurance
Economic Stimulus Package: 143.4 in Construction Spending Billions Energy & Technology, 29.8, 20% Workforce Development & Safety, 4.3, 3% School Building, 9.2, 6% Other, 8.0, 5% Other, 0.2, 0% There is Building Infrastructure, approximately 140B 29.6, 20% in new construction spending in the stimulus package, about 1/3 of it for transportation. Transportation Infrastructure, 49.3, 32% Water & Environmental Infrastructure, 21.4, 14% Source: Associated General Contractors at http://www.agc.org/cs/rebuild americas future (2/18/09); Insurance Info. Inst.
Infrastructure Stimulus Spending By State: Top 25 States ( Millions) 0 538.6 538.7 544.3 500 603.9 648.9 668.2 701.5 704.9 716.5 739.3 830.6 836.5 890.3 890.6 1,141.3 909.4 1,000 1,335.6 1,150.3 1,500 1,525.0 1,335.8 2,000 1,580.0 2,500 1,794.9 3,000 2,774.5 Stimulus Dollars ( Mill) 3,500 2,803.2 4,000 3,917.7 4,500 Infrastructure spending is in the stimulus package total 38.1B, allocated largely by population size. CA will get 3.9B—the highest amount of any state CA TX NY FL IL PA NJ OH MI GA NC VA MA IN MO WA WI MD TN MN AZ AL SC CO LA Sources: USA Today 2/19/09; House Transportation and Infrastructure Committee; the Associated Press.
Expected Number of Jobs Gained or Preserved by Stimulus Spending Larger States More Jobs Workers Comp Benefits
0 50 50 52 60 66 66 69 70 70 71 75 75 79 93 105 100 143 133 (Thousands) The economic stimulus plan calls for the creation or preservation of 3.5 million jobs, allocated roughly in proportion to the size of the state’s labor force. CA is expected to see 396,000 jobs created or preserved. 109 107 100 148 200 207 215 300 269 No. of Jobs Created/Saved by Stimulus 400 396 Estimated Job Effect of Stimulus Spending By State: Top 25 States CA TX NY FL IL PA OH MI GA NC NJ VA MA IN WA TN AZ WI MO MD MN CO AL LA SC Sources: http://www.recovery.gov/; Council of Economic Advisers Insurance Information Institute.
FINANCIAL STRENGTH & RATINGS Industry Has Weathered the Storms Well
P/C Insurer Impairments, 1969-2008 The number of impairments varies significantly over the p/c insurance cycle, with peaks occurring well into hard markets 60 58 70 49 50 47 35 5 7 18 14 15 18 19 31 29 16 12 16 14 13 9 19 13 12 9 11 9 7 10 8 20 15 12 30 31 34 34 40 36 41 50 50 48 49 55 60 69 70 71 72 73 74 75 76 77 78 79 80 81 82 83 84 85 86 87 88 89 90 91 92 93 94 95 96 97 98 99 00 01 02 03 04 05 06 07 08 0
P/C Insurer Impairment Frequency vs. Combined Ratio, 1969-2008 2.0 1.8 1.6 110 1.4 105 1.0 0.8 1.2 100 95 90 0.6 0.4 2008 impairment rate was a record low 0.23%, second only to the 0.17% record low in 2007 and barely one-fourth the 0.82% average since 1969 69 70 71 72 73 74 75 76 77 78 79 80 81 82 83 84 85 86 87 88 89 90 91 92 93 94 95 96 97 98 99 00 01 02 03 04 05 06 07 Combined Ratio 115 Combined Ratio after Div P/C Impairment Frequency 0.2 0.0 Impairment Rate 120 Impairment rates are highly correlated with underwriting performance and reached record lows in 2007/08
Summary of A.M. Best’s P/C Insurer Ratings Actions in 2008* P/C insurance is by design a resilient in business. The dual threat of financial disasters and catastrophic losses are anticipated in the industry’s risk management strategy. Upgraded, 59 , 4.0% Downgraded, 55 , 3.8% Initial, 41 , 2.8% Under Review, 63 , 4.3% Other, 59 , 4.0% Despite financial market turmoil, high cat losses and a soft market in 2008, 81% of ratings actions by A.M. Best were affirmations; just 3.8% were downgrades and 4.0% upgrades *Through December 19. Source: A.M. Best. Affirm, 1,183 , 81.0% 58
Reasons for US P/C Insurer Impairments, 1969-2008 Sig. Change in Business Misc. 4.2% Reinsurance Failure 3.7% 9.1% Deficient Loss Reserves/Inadequate Pricing 38.1% Investment Problems 7.0% Affiliate Impairment 7.9% Catastrophe Losses Alleged Fraud 7.6% 8.1% Rapid Growth 14.3% Source: A.M. Best: 1969-2008 Impairment Review, Special Report, Apr. 6, 2008 Deficient loss reserves and inadequate pricing are the leading cause of insurer impairments, underscoring the importance of discipline. Investment catastrophe losses play a much smaller role.
Critical Differences Between P/C Insurers and Banks Superior Risk Management Model & Low Leverage Make a Big Difference
How Insurance Industry Stability Has Benefitted Consumers BOTTOM LINE: Insurance Markets—Unlike Banking—Are Operating Normally The Basic Function of Insurance—the Orderly Transfer of Risk from Client to Insurer—Continues Uninterrupted This Means that Insurers Continue to: Pay claims (whereas 57 banks have gone under as of 5/1) The Promise is Being Fulfilled Renew existing policies (banks are reducing and eliminating lines of credit) Write new policies (banks are turning away people who want or need to borrow) Develop new products (banks are scaling back the products they offer) Source: Insurance Information Institute 62
Reasons Why P/C Insurers Have Fewer Problems Than Banks: A Superior Risk Management Model Emphasis on Underwriting Matching of risk to price (via experience and modeling) Limiting of potential loss exposure Some banks sought to maximize volume and fees and disregarded risk Strong Relationship Between Underwriting and Risk Bearing Insurers always maintain a stake in the business they underwrite, keeping “skin in the game” at all times Banks and investment banks package up and securitize, severing the link between risk underwriting and risk bearing, with (predictably) disastrous consequences—straightforward moral hazard problem from Econ 101 Low Leverage Insurers do not rely on borrowed money to underwrite insurance or pay claims There is no credit or liquidity crisis in the insurance industry Conservative Investment Philosophy High quality portfolio that is relatively less volatile and more liquid Comprehensive Regulation of Insurance Operations The business of insurance remained comprehensively regulated whereas a separate banking system had evolved largely outside the auspices and understanding of regulators (e.g., hedge funds, private equity, complex securitized instruments, credit derivatives—CDS’s) Greater Transparency Insurance companies are an open book to regulators and the public 63
P/C INSURANCE FINANCIAL PERFORMANCE A Resilient Industry in Challenging Times
Profitability Historically Volatile
65,777 62,496 06 07 44,155 38,501 30,029 21,865 30,773 24,404 2,496 3,046 10,000 Insurer profits peaked in 2006 and 2007, but fell 96.2% during the economic crisis in 2008 20,559 20,000 20,598 30,000 10,870 40,000 19,316 50,000 5,840 60,000 14,178 70,000 2001 ROE -1.2% 2002 ROE 2.2% 2003 ROE 8.9% 2004 ROE 9.4% 2005 ROE 9.4% 2006 ROE 12.2% 2007 ROAS1 12.4% 2008 ROAS 0.5%* 36,819 P/C Net Income After Taxes 1991-2008F ( Millions)* 08F 05 04 02 01 - 6,970 00 99 98 97 96 95 94 93 92 91 - 10,000 03 0 *ROE figures are GAAP; 1Return on avg. Surplus. Excluding Mortgage & Financial Guarantee insurers yields an 4.2% ROAS for 2008. 68 Sources: A.M. Best, ISO, Insurance Information Inst.
P/C Insurance Industry ROEs, 1975 – 2009F* 25% 20% 1977:19.0% 1987:17.3% 10 Years 2006:12.2% 1997:11.6% 10 Y ea r s 15% 9 Years 10% 2009F: 7.4% 5% 2008: 0.5% 0% 1975: 2.4% 1984: 1.8% 1992: 4.5% 2001: -1.2% 75 76 77 78 79 80 81 82 83 84 85 86 87 88 89 90 91 92 93 94 95 96 97 98 99 00 01 02 03 04 05 06 06 08F 09F -5% Note: 2008 result excluding Mortgage & Financial Guarantee insurers is 4.2%. Sources: ISO; A.M. Best (2009F); Insurance Information Institute. 69
A 100 Combined Ratio Isn’t What it Used to Be: 95 is Where It’s At 110 14.3% 15.9% Combined Ratio 100.6 100 95 90 85 ROE* 16% 100.1 100.7 97.5 101.0 12.7% Combined ratios must me must lower in today’s depressed investment environment to generate risk appropriate ROEs 18% 9.6% 14% 12% 92.6 10% 8% 8.9% 4.2% 80 6% 4% 1978 1979 2003 2005 2006 2008* * 2008 figure is return on average statutory surplus. Excludes mortgage and financial guarantee insurers. Source: Insurance Information Institute from A.M. Best and ISO data. Retrun on Equity* 105 Combined Ratio
P/C Premium Growth Primarily Driven by the Industry’s Underwriting Cycle, Not the Economy
Strength of Recent Hard Markets by NWP Growth 24% 22% 20% 18% 16% 14% 12% 10% 8% 1975-78 1984-87 Shaded areas denote “hard market” periods 2000-03 Net written premiums fell 1.0% in 2007 (first decline since 1943) and by 1.4% in 2008, the first backto-back decline since 1930-33 6% 4% 2% 0% 1971 1972 1973 1974 1975 1976 1977 1978 1979 1980 1981 1982 1983 1984 1985 1986 1987 1988 1989 1990 1991 1992 1993 1994 1995 1996 1997 1998 1999 2000 2001 2002 2003 2004 2005 2006 2007 2008 2009F -2% 75 Sources: A.M. Best (historical and forecast), ISO, Insurance Information Institute
Personal/Commercial Lines & Reinsurance NPW Growth, 2006-2009F Personal 2009F Commercial Sources: A.M. Best Review & Preview, Feb. 2009 5.0% 3.5% 7.6% 28.1% -1.4% 2008E -3.8% 2007 -0.3% 2006 1.0% 2.5% 0.0% 2.0% 35% 30% 25% 20% 15% 10% 5% 0% -5% -10% -15% Declines in premium growth began to stabilize in later 2008 and are firming to some extent in 2009, but are partly offset by flat/declining exposures due to the recession -11.9% Reinsurance
Source: Council of Insurance Agents & Brokers; Insurance Information Institute -6.0% 1Q09 4Q08 -11.0% 3Q08 2Q08 -12.9% 1Q08 -13.5% -12.0% 4Q07 3Q07 -13.3% -11.8% 2Q07 4Q06 3Q06 2Q06 -11.3% -5.3% -3.0% -2.7% 1Q06 4Q05 3Q05 1Q05 4Q04 3Q04 2Q04 1Q04 -16% 2Q05 KRW Effect 1Q07 -14% Magnitude of price declines is now shrinking. Reflects shrinking capital, reduced investment gains, deteriorating underwriting performance and costlier reinsurance -9.6% -12% -8.2% -10% -9.7% -8% -9.4% -5.9% -6% -4.6% -3.2% -4% -7.0% -2% -0.1% 0% -5.0% Average Commercial Rate Change, All Lines, (1Q:2004 – 1Q:2009)
Merger & Acquisition Barriers to Consolidation Will Diminish in 2009/10
P/C Insurance-Related M&A Activity, 1988-2008* . 88 89 90 91 92 93 94 95 96 97 98 99 00 Source: Conning Research & Consulting. *2007/08 figures approximate. 120 16,300 13,583 80 01 02 03 04 05 06 07 08 60 40 20 0 Number of Transactions 35,221 140 100 425 486 9,264 19,118 8,059 5,137 2,435 2,780 1,882 5,100 0 3,450 10,000 5,638 20,000 11,534 30,000 M&As have mixed history of success 1,249 40,000 30,873 50,000 Transaction Value ( Mill) 55,825 2009 off to a stronger start with AIG unit sales and Bermuda consolidation 40,032 60,000 Number of Transactions 20,353 Transaction Values
Capital/ Policyholder Surplus Shrinkage, but Capital is Within Historic Norms
U.S. Policyholder Surplus: 1975-2008* 550 500 450 Actual capacity as of 12/31/08 was 455.6, down 12.0% from 12/31/07 at 517.9B, but still 60% above its 2002 trough. Recent peak was 521.8 as of 9/30/07. Surplus as of 12/31/08 is 12.7% below 2007 peak. 400 Billions 350 300 250 200 150 The premium-to-surplus ratio stood at 0.95: 1 at year end 2008, up from near record low of 0.85: 1 at year-end 2007 100 50 “Surplus” is a measure of underwriting capacity. It is analogous to “Owners Equity” or “Net Worth” in non-insurance organizations 0 75 76 77 78 79 80 81 82 83 84 85 86 87 88 89 90 91 92 93 94 95 96 97 98 99 00 01 02 03 04 05 06 07 08 Source: A.M. Best, ISO, Insurance Information Institute. *As of 12/31/08 84
Policyholder Surplus, 2006:Q4 – 2008:Q4 Capacity peaked at 521.8 as of 9/30/07 Billions 540 512.8 520 500 487.1 480 521.8 517.9 515.6 496.6 505.0 Declines Since 2007:Q3 Peak 460 Q2: - 16.6B (-3.2%) Q3: - 43.3B (-8.3%) Q4: - 66.2 (-12.9%) 440 478.5 455.6 420 06:Q4 07:Q1 07:Q2 07:Q3 07:Q4 08:Q1 08:Q2 08:Q3 08:Q4 Source: ISO. 85
Premium-to-Surplus Ratios Before Major Capital Events* 1.9 1.7 P/C insurance industry was better capitalized going into the financial crisis than before any “capital event” in recent history 1.65 1.42 1.5 1.40 1.15 1.3 1.03 1.1 1.05 0.88 0.9 0.95 As of 12/31/08** 6/30/05 Hurricane Katrina 6/30/04 Florida Hurricanes 6/30/01 Sept. 11 Attacks 12/31/93 Northridge Earthquake 6/30/1992 Hurricane Andrew 6/30/1989 Hurricane Hugo 0.5 6/30/07 Financial Crisis 0.7 *Ratio is for end of quarter immediately prior to event. Date shown is end of quarter prior to event. **Latest available Source: PCS; Insurance Information Institute.
Ratio of Insured Loss to Surplus for Largest Capital Events Since 1989* 16% 14% The financial crisis now ranks as the 2nd largest “capital event” over the past 20 years 12% 9.6% 10% 8% 6% 4% 13.8% 12.9% 10.9% 6.9% 6.2% 3.3% 2% Financial Crisis as of 12/31/08** 6/30/05 Hurricane Katrina 6/30/04 Florida Hurricanes 6/30/01 Sept. 11 Attacks 12/31/93 Northridge Earthquake 6/30/1992 Hurricane Andrew 6/30/1989 Hurricane Hugo 0% *Ratio is for end-of-quarter surplus immediately prior to event. Date shown is end of quarter prior to event. **Latest available Source: PCS; Insurance Information Institute.
Historically, Hard Markets Follow When Surplus “Growth” is Negative 30% NWP % change Surplus % change 25% Sharp decline in capacity is a necessary but not sufficient condition for a true hard market 20% 15% 10% 5% 0% -5% -15% 1978 1979 1980 1981 1982 1983 1984 1985 1986 1987 1988 1989 1990 1991 1992 1993 1994 1995 1996 1997 1998 1999 2000 2001 2002 2003 2004 2005 2006 2007 2008 -10% Sources: A.M. Best, ISO, Insurance Information Institute
Investment Performance Investments are the Principle Source of Declining Profitability
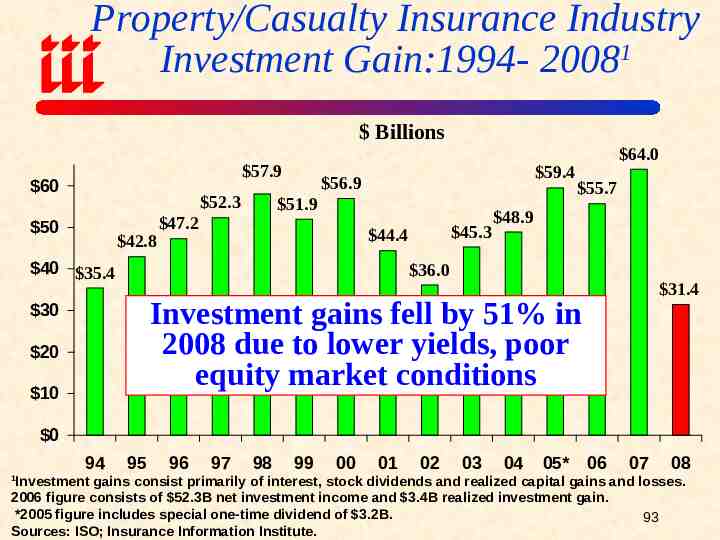
Property/Casualty Insurance Industry Investment Gain:1994- 20081 Billions 57.9 60 52.3 50 42.8 59.4 56.9 51.9 47.2 45.3 44.4 40 35.4 64.0 55.7 48.9 36.0 31.4 Investment gains fell by 51% in 2008 due to lower yields, poor equity market conditions 30 20 10 0 94 95 96 97 98 99 00 01 02 03 04 05* 06 07 08 Investment gains consist primarily of interest, stock dividends and realized capital gains and losses. 2006 figure consists of 52.3B net investment income and 3.4B realized investment gain. *2005 figure includes special one-time dividend of 3.2B. 93 Sources: ISO; Insurance Information Institute. 1
P/C Insurer Net Realized Capital Gains, 1990-2008 Sources: A.M. Best, ISO, Insurance Information Institute. 95 08 07 06 05 04 03 02 01 00 99 98 97 96 95 94 93 92 91 90 20 Billions 18.02 18 16.21 16 13.02 14 10.81 12 9.89 9.82 9.24 8.92 9.13 9.70 10 6.63 6.61 8 6.00 4.81 6 3.52 4 2.88 1.66 2 0 - 2 - 1.21 - 4 - 6 Realized capital losses hit a record - 8 19.8 billion in 2008 due to financial - 10 market turmoil, a 27.7 billion swing - 12 - 14 from 2007. This is the primary cause of - 16 2008’s large drop in profits and ROE. - 18 - 19.80 - 20
Treasury Yield Curves: Pre-Crisis vs. Current* 6% 5% 4% 3% 5.19% 5.04% 4.96% 5.00% 5.00% 4.96% 4.93% 4.82% 4.82% 4.82% 4.88% Treasury Yield Curve is at its most depressed level in at least 45 years. Investment income will fall significantly as a result. 3.78% 3.64% 2.82% 2.42% 1.82% 2% Stock dividend cuts will further pressure investment income 1.31% 1% 0.10% 0.22% 0.43% 0.64% 0.93% Current Yield Curve* Pre-Crisis (July 2007) 0% 1M 3M 6M 1Y 2Y 3Y *March 2009. Sources: Federal Reserve; Insurance Information Institute. 5Y 7Y 10Y 20Y 30Y 98
Underwriting Trends Financial Crisis Does Not Directly Impact Underwriting Performance: Cycle, Catastrophes Were 2008’s Drivers
P/C Insurance Industry Combined Ratio, 2001-2009E 120 115.8 As recently as 2001, insurers paid out nearly 1.16 for every 1 in earned premiums Relatively low CAT losses, reserve releases 2005 ratio benefited from heavy use of reinsurance which lowered net losses 110 107.5 Best combined ratio since 1949 (87.6) 100.1 100 Including Mortgage & Fin. Guarantee insurers Cyclical Deterioration 105.1 101.0 100.8 101 98.4 95.7 92.6 90 2001 2002 2003 2004 *Includes Mortgage & Financial Guarantee insurers. 2005 2006 2007 2008 Sources: A.M. Best. 2008* 2009F 101
35 30 25 20 15 10 5 0 -5 -10 -15 -20 -25 -30 -35 -40 -45 -50 -55 Insurers earned a record underwriting profit of 31.7B in 2006 and 19.3B in 2007, the largest ever but only the 2nd and 3rd since 1978. Cumulative underwriting deficit from 1975 through 2008 is 442B. 19.799 Bill underwriting loss in 2008 incl. mort. & FG insurers 75 76 77 78 79 80 81 82 83 84 85 86 87 88 89 90 91 92 93 94 95 96 97 98 99 00 01 02 03 04 05 06 07 08 Billions Underwriting Gain (Loss) 1975-2008* Source: A.M. Best, ISO; Insurance Information Institute 102 insurers * Includes mortgage & finl. guarantee
Number of Years With Underwriting Profits by Decade, 1920s –2000s Number of Years with Underwriting Profits 10 10 8 8 6 7 6 Underwriting profits were common before the 1980s (40 of the 60 years before 1980 had combined ratios below 100)—but then they vanished. Not a single underwriting profit was recorded in the 25 years from 1979 through 2003. 5 4 4 3 2 0 1920s 1930s 1940s 1950s 1960s Note: Data for 1920 – 1934 based on stock companies only. Sources: Insurance Information Institute research from A.M. Best Data. 1970s 0 0 1980s 1990s 2000s* 103 *2000 through 2008.
Commercial Lines
Commercial Lines Combined Ratio, 1993-2009F Mortgage and financial guarantee may account for up to 4 points on the commercial combined ratio in 2008 122.3 125 Commercial coverages have exhibited significant variability over time. 90 85 105.1 106.5 102.5 102.0 110.2 111.1 112.3 109.7 107.6 105.4 95.1 95 2006/07 benefited from favorable loss cost trends, improved tort environment, low CAT losses, WC reforms and reserve releases. Most of these trends reversed in 2008 and mortgage and financial guarantee segments have big influence. 2009 is transition year. 91.1 100 103.9 105 110.2 110 112.5 115 110.3 120 93 94 95 96 97 98 99 00 01 02 03 04 05 06 07 08E 09F Sources: A.M. Best (historical and forecasts)
Catastrophe Losses Impacting Underwriting Results and the Bottom Line
100 80 2008 CAT losses exceeded 2006/07 combined. 2005 was by far the worst year ever for insured catastrophe losses in the US, but the worst has yet to come. 100 Billion CAT year is coming soon 61.9 120 Billions 100.0 U.S. Insured Catastrophe Losses* 0 26.0 9.2 6.7 20 89 90 91 92 93 94 95 96 97 98 99 00 01 02 03 04 05 06 07 08** 20? 40 7.5 2.7 4.7 22.9 5.5 16.9 8.3 7.4 2.6 10.1 8.3 4.6 26.5 5.9 12.9 27.5 60 *Excludes 4B- 6b offshore energy losses from Hurricanes Katrina & Rita. **Based on PCS data through Dec. 31. PCS 2.1B loss of for Gustav. 10.655B for Ike of 12/05/08. Note: 2001 figure includes 20.3B for 9/11 losses reported through 12/31/01. Includes only business and personal property claims, business interruption and auto claims. Non-prop/BI losses 12.2B.120 Source: Property Claims Service/ISO; Insurance Information Institute
Inflation-Adjusted U.S. Insured Catastrophe Losses By Cause of Loss, 1988-2007¹ Fire, 8.1 , 2.6% Wind/Hail/Flood, 9.9 , 3.2% Earthquakes, 19.5 , 6.3% Winter Storms, 24.4 , 7.9% Civil Disorders, 1.1 , 0.4% Water Damage, 0.4 , 0.1% Utility Disruption, 0.2 , 0.1% Tornadoes, 82.4 , 26.5% Insured disaster losses totaled 310.5 billion from 1988-2007 (in 2007 dollars) Terrorism, 22.9 , 7.4% All Tropical Cyclones, 141.6 , 45.6% 1 Catastrophes are all events causing direct insured losses to property of 25 million or more in 2007 dollars. Catastrophe threshold changed from 5 million to 25 million beginning in 1997. Adjusted for inflation by the III. 2 Excludes snow. 3 Includes hurricanes and tropical storms. 4 Includes other geologic events such as volcanic eruptions and other earth movement. 5 Does not include flood damage covered by the federally administered National Flood Insurance Program. 6 Includes wildland fires. Source: Insurance Services Office (ISO).
Total Value of Insured Coastal Exposure (2007, Billions) Florida New York Texas Massachusetts New Jersey Connecticut Louisiana S. Carolina Virginia Maine North Carolina Alabama Georgia Delaware New Hampshire Mississippi Rhode Island Maryland 2,458.6 2,378.9 895.1 772.8 635.5 479.9 224.4 191.9 158.8 146.9 132.8 92.5 85.6 60.6 55.7 51.8 54.1 14.9 522B increase since 2004, up 27% In 2007, Florida still ranked as the #1 most exposed state to hurricane loss, with 2.459 trillion exposure, an increase of 522B or 27% from 1.937 trillion in 2004. The insured value of all coastal property was 8.9 trillion in 2007, up 24% from 7.2 trillion in 2004. 0 Source: AIR Worldwide 500 1,000 1,500 2,000 2,500 3,000 131
Insurance Information Institute On-Line THANK YOU FOR YOUR TIME AND YOUR ATTENTION! Download: http://www.iii.org/media/presentations/SuretyMay09/ 132