Call Center Scheduling Problem Sida Cai, Zhe Hu, Junqing Zhu 1


16 Slides2.54 MB
Call Center Scheduling Problem Sida Cai, Zhe Hu, Junqing Zhu 1
Executive Summary An overview of the call center industry Introduction to the call center scheduling problem Objectives Assumptions Call Center Data Erlang Model Assumptions Service time and impatience time Results Monte Carlo Simulation Assumptions and methods Results 2
Call center and Customer Service 75% of customers believe it takes too long to reach a live agent 53% of customers are angry if they don’t speak to a real person right way 82% of customers have stopped doing business with company because of its bad customers service 95% of customers share their bad experiences with others Call center: Inbound call center: customer service Outbound call center: telemarketing, market research and the seeking of charitable donations In 2013, the revenue of telemarketing and call center services in the United Statistics reached approximately 18 billion U.S. dollars 3
Objectives and Assumptions Objective: Minimize number of agents, given target acceptable waiting time and required service level Assumptions: No precedence: Each call is not sequence dependent. Non preemptive: Calls are worked to completion once an agent picks up a call. Single queue FCFS: first come, first served 4
Call Center Data Telephone data for a call center of an “anonymous bank” in Israel 12 months, 20,000 to 30,000 calls/month Vru entry: time of incoming calls Vru time: time spent in the Voice Response Unit Q start: time that customers enter queue Q time: time spent in the queue Outcome: hang ups, services by an agent Ser time: time serviced by an agent 5
Erlang Model Two extra assumptions: Erlang model assumes that both service time and arrival time have a very specific, exponential distribution. Customers do NOT leave the system before being served; no abandonments Exponentially distributed service time Exponentially distributed arrival time 6
Service Time 90% service time is less than 420s 7
Impatience Time Customers do NOT leave the system before being served; no abandonments 16% customers hang up within 10 seconds 84% do NOT hang up within 10 seconds Service Level: percentage of customers whose waiting time is at or below the acceptable waiting time. Target SL 90% of all customers are served within 10 seconds 8
Formula 420s service time; 10s AWT; 90% service level; arrival rate s number of agents/servers a offered load minimum number of agents required a/s utilization rate 9
Erlang Model Results Shift 3, 6 agents Shift 1, 8 agents Shift 2, 8 agents 10
Simulate Reality and Test Our Results Assumptions: The arrivals are Poisson Process at different rates based on different time periods The service times are independent identical exponential distributed with a constant rate Customers independently get impatient with iid impatience times distributed as exponential at a constant rate Methods: Simulating the time of incoming calls, service times and impatient times for different time period Using the Monte Carlo to estimate the number of incoming calls, number of impatient customers and service level Find the number of agents that achieves 90% service level on different time periods 11
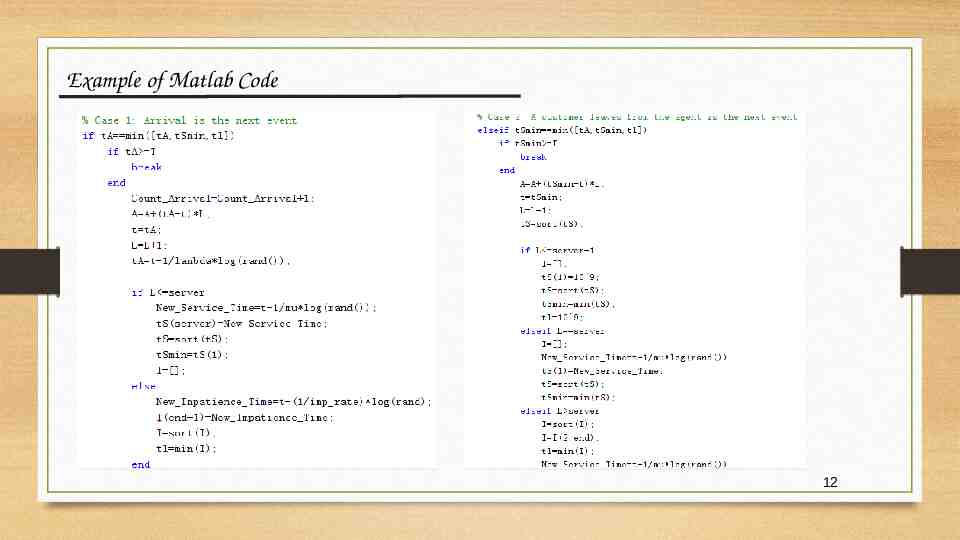
Example of Matlab Code 12
Simulation Result 13
Simulation Result 14
Schedule Comparison Current Schedule Shift 1, 8 agents Shift 2, 8 agents Our Schedule Shift 3, 5 agents Shift 1, 8 agents Shift 2, 8 agents 15
References http://www.insightsquared.com/2015/04/100-customer-service-statistics-you-need-to-know/ http://www.newvoicemedia.com/blog/the-multibillion-dollar-cost-of-poor-customer-service-infographic/ https://www.zendesk.com/resources/the-impact-of-customer-service/ http://ie.technion.ac.il/serveng/callcenterdata/index.html http://www.statista.com/topics/2169/call-center-services-industry-in-the-us/ 16