Business Management Curriculum Module 2: Market Assessment Estimating


35 Slides908.74 KB
Business Management Curriculum Module 2: Market Assessment Estimating market size and price
Project Team: Ruby Ward, Professor, Utah State University Trent Teegerstrom, Associate Director of Tribal Extension, University of Arizona Karli Salisbury, Research Associate, Utah State University Kynda Curtis, Professor, Utah State University Staci Emm, Extension Educator and Professor, University of Nevada Reno Carol Bishop, Extension Educator and Associate Professor, University of Nevada Reno Acknowledgments: Vicki Hebb, reviewing content, and Russ Tronstad (University of Arizona) and Stuart Nakamoto (University of Hawaii), content. This material is based upon work that is supported by the National Institute of Food and Agriculture, U.S. Department of Agriculture, under award number 2013-38640-22175 through the Western Sustainable Agriculture Research and Education program under subaward number EW14-017. USDA is an equal opportunity employer and service provider. Any opinions, findings, conclusions, or recommendations expressed in this publication are those of the author(s) and do not necessarily reflect the view of the U.S. Department of Agriculture. Each university is an affirmative action/equal opportunity institution
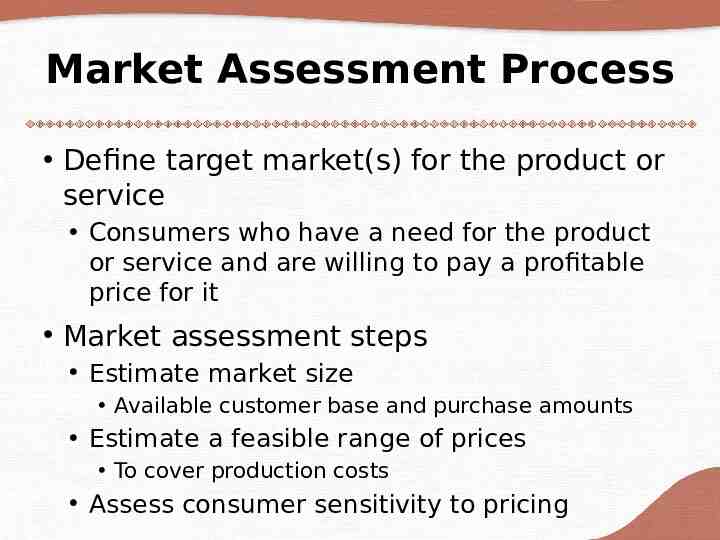
Market Assessment Process Define target market(s) for the product or service Consumers who have a need for the product or service and are willing to pay a profitable price for it Market assessment steps Estimate market size Available customer base and purchase amounts Estimate a feasible range of prices To cover production costs Assess consumer sensitivity to pricing
Target Market Description For each target market define the consumers’ Demographics Age, location (state, county, etc.), gender, education level, income, children, martial status, etc. Psychographics Interests, hobbies, or concerns regarding health, food safety, environmental, etc. Product/Services needs or preferences Product or product characteristics (options, variety, location, package size, etc.) consumers require All illustrate their motivation to purchase the product or not
Data Collection/ Research Methods Survey existing customers Conduct product/pricing trials Ask fellow providers (competitors) Use secondary data resources USDA, marketing firms, Extension, other online resources
Estimating Market Size – Farm Tourism Examples Local Tourists Local customers traveling for a day or weekend outing, such as in-state or less than 100 miles away U-pick strawberry operation example Destination Tourists Visitors on a long vacation to specific destinations National and state parks, heritage sites, etc. Farm tourism venture example
Local Tourists If selling items directly from farm/ranch Consider how far you can expect customers to travel The USDA Forest Service's National Survey on Recreation found the average distance traveled to visit a farm in 2000 was 80 miles Western operators find their consumers travel over 75 miles to participate in U-picks, farm festivals, and related farm activities No alternatives exist in their metro area
Local Tourists Potential number of customers Demographics and population size in the area are important for estimating demand Demographics from the most recent U.S. Census can be searched online by state and ZIP code http://factfinder.census.gov/faces/nav/jsf/pages/index.xhtml Ages, household and family size, income, ethnicity, etc. All of which can provide information as to the characteristics of potential customers in the surrounding area Potential purchase size Examining current and historical consumption patterns can be helpful Average annual consumption levels for hundreds of foods can be found on the USDA’s Economic Research Service (USDA-ERS) website http://www.ers.usda.gov/data-products/food-availability-(per-capita)-data-syste m/.aspx ERS data is for standard, conventional products only
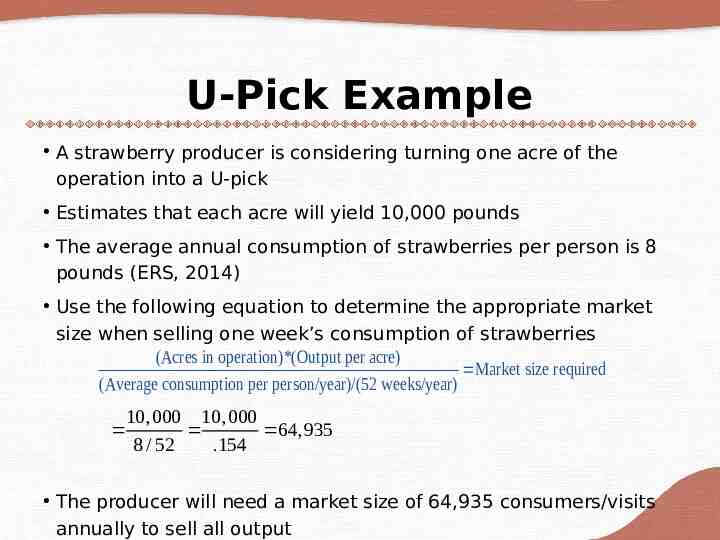
U-Pick Example A strawberry producer is considering turning one acre of the operation into a U-pick Estimates that each acre will yield 10,000 pounds The average annual consumption of strawberries per person is 8 pounds (ERS, 2014) Use the following equation to determine the appropriate market size when selling one week’s consumption of strawberries (Acres in operation)*(Output per acre) Market size required (Average consumption per person/year)/(52 weeks/year) 10, 000 10, 000 64,935 8 / 52 .154 The producer will need a market size of 64,935 consumers/visits annually to sell all output
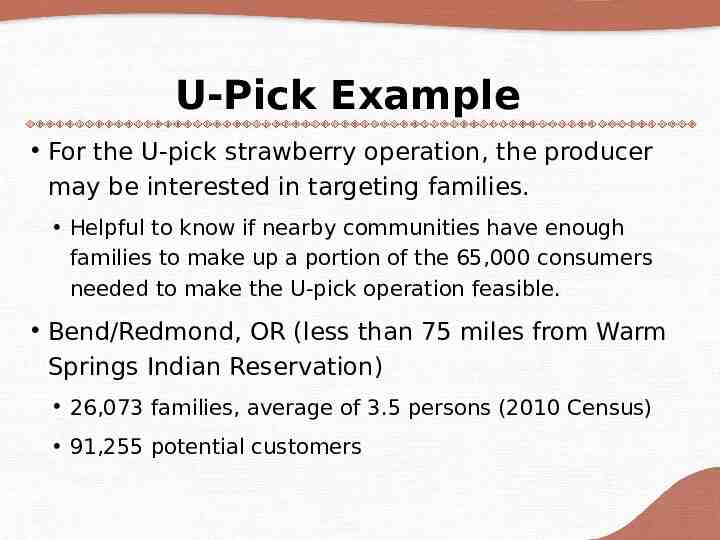
U-Pick Example For the U-pick strawberry operation, the producer may be interested in targeting families. Helpful to know if nearby communities have enough families to make up a portion of the 65,000 consumers needed to make the U-pick operation feasible. Bend/Redmond, OR (less than 75 miles from Warm Springs Indian Reservation) 26,073 families, average of 3.5 persons (2010 Census) 91,255 potential customers
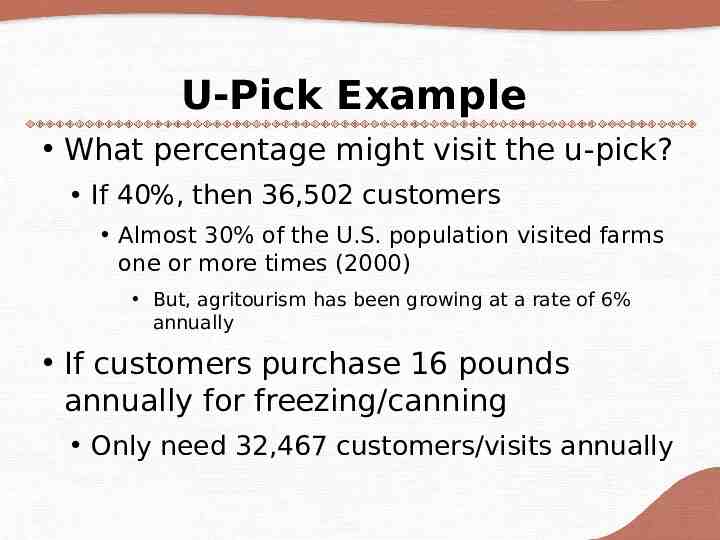
U-Pick Example What percentage might visit the u-pick? If 40%, then 36,502 customers Almost 30% of the U.S. population visited farms one or more times (2000) But, agritourism has been growing at a rate of 6% annually If customers purchase 16 pounds annually for freezing/canning Only need 32,467 customers/visits annually
Destination Tourists Many rural areas in the West are located between a major urban center and national/state parks, ski resorts, etc. Vacation destinations for many foreign and outof-state visitors Estimating the potential size of these markets requires information on Where visitors are coming from Where visitors are returning to
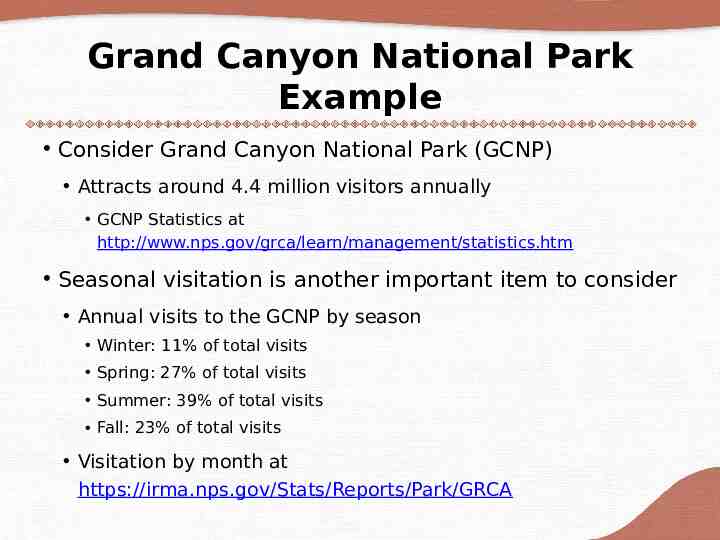
Grand Canyon National Park Example Consider Grand Canyon National Park (GCNP) Attracts around 4.4 million visitors annually GCNP Statistics at http://www.nps.gov/grca/learn/management/statistics.htm Seasonal visitation is another important item to consider Annual visits to the GCNP by season Winter: 11% of total visits Spring: 27% of total visits Summer: 39% of total visits Fall: 23% of total visits Visitation by month at https://irma.nps.gov/Stats/Reports/Park/GRCA
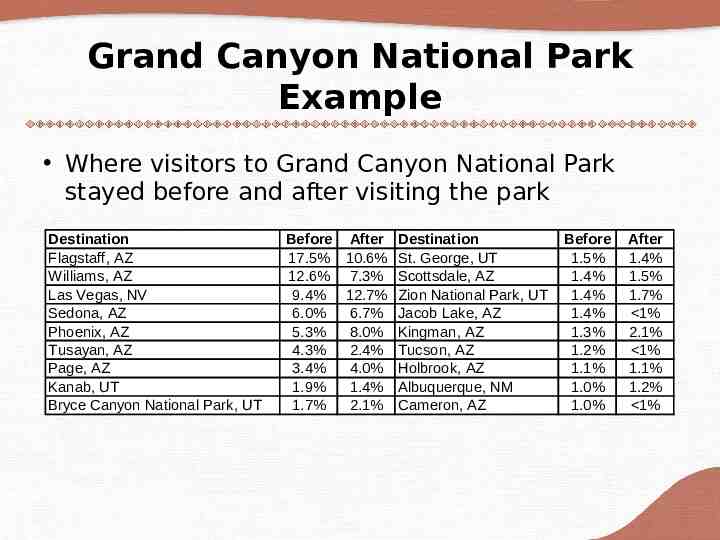
Grand Canyon National Park Example Where visitors to Grand Canyon National Park stayed before and after visiting the park Destination Flagstaff, AZ Williams, AZ Las Vegas, NV Sedona, AZ Phoenix, AZ Tusayan, AZ Page, AZ Kanab, UT Bryce Canyon National Park, UT Before After Destination 17.5% 10.6% St. George, UT 12.6% 7.3% Scottsdale, AZ 9.4% 12.7% Zion National Park, UT 6.0% 6.7% Jacob Lake, AZ 5.3% 8.0% Kingman, AZ 4.3% 2.4% Tucson, AZ 3.4% 4.0% Holbrook, AZ 1.9% 1.4% Albuquerque, NM 1.7% 2.1% Cameron, AZ Before 1.5% 1.4% 1.4% 1.4% 1.3% 1.2% 1.1% 1.0% 1.0% After 1.4% 1.5% 1.7% 1% 2.1% 1% 1.1% 1.2% 1%
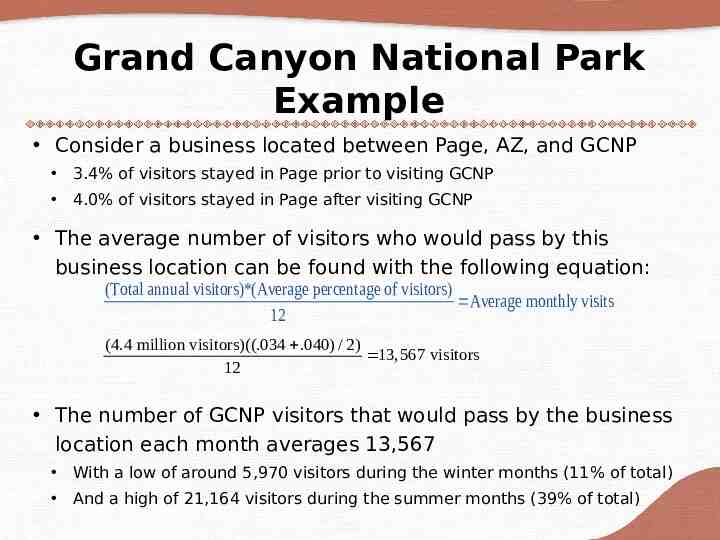
Grand Canyon National Park Example Consider a business located between Page, AZ, and GCNP 3.4% of visitors stayed in Page prior to visiting GCNP 4.0% of visitors stayed in Page after visiting GCNP The average number of visitors who would pass by this business location can be found with the following equation: (Total annual visitors)*(Average percentage of visitors) Average monthly visits 12 (4.4 million visitors)((.034 .040) / 2) 13,567 visitors 12 The number of GCNP visitors that would pass by the business location each month averages 13,567 With a low of around 5,970 visitors during the winter months (11% of total) And a high of 21,164 visitors during the summer months (39% of total)
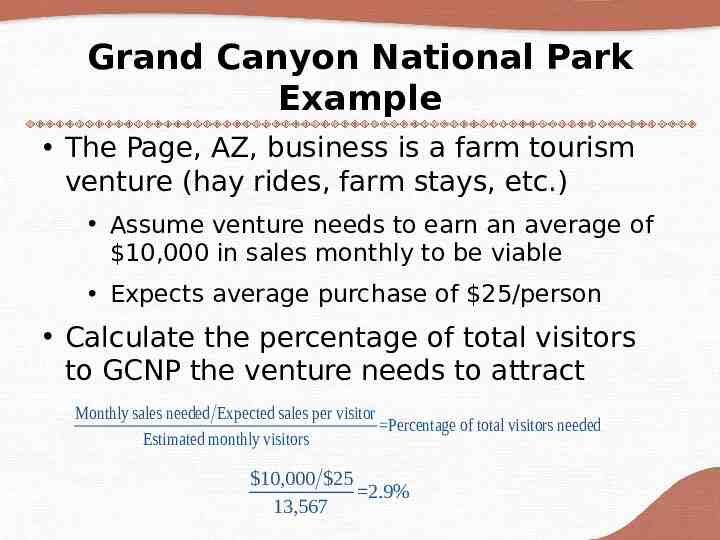
Grand Canyon National Park Example The Page, AZ, business is a farm tourism venture (hay rides, farm stays, etc.) Assume venture needs to earn an average of 10,000 in sales monthly to be viable Expects average purchase of 25/person Calculate the percentage of total visitors to GCNP the venture needs to attract Monthly sales needed Expected sales per visitor Percentage of total visitors needed Estimated monthly visitors 10,000 25 2.9% 13,567
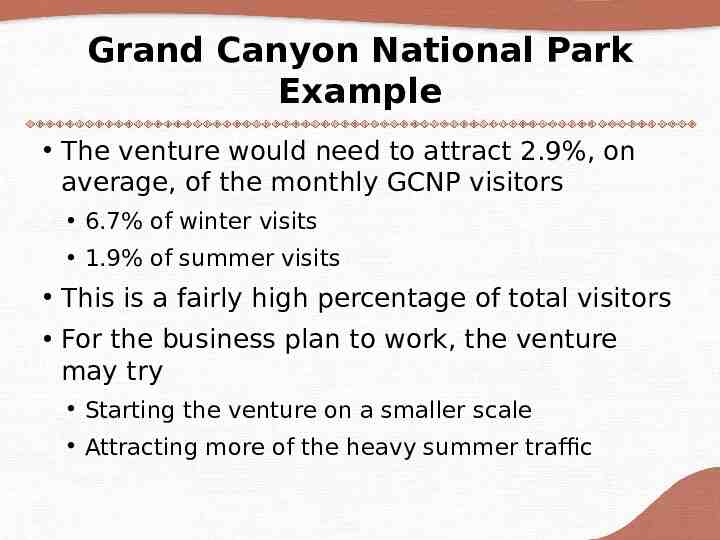
Grand Canyon National Park Example The venture would need to attract 2.9%, on average, of the monthly GCNP visitors 6.7% of winter visits 1.9% of summer visits This is a fairly high percentage of total visitors For the business plan to work, the venture may try Starting the venture on a smaller scale Attracting more of the heavy summer traffic
Estimating Product Price Major pricing approaches Cost-based Demand-oriented Competition-oriented Not normally used independently
Cost-Based Pricing Cost-plus pricing Price equals total costs divided by number of units Shortcomings Not tied to consumer demand No incentive to reduce costs Adjustments for rising costs poor Mark-up pricing Add a percentage to the cost of product (mark-up) Very popular for retailers and wholesales Easy, too many products to estimate demand Shortcomings Not tied to demand Profit biased by pricing
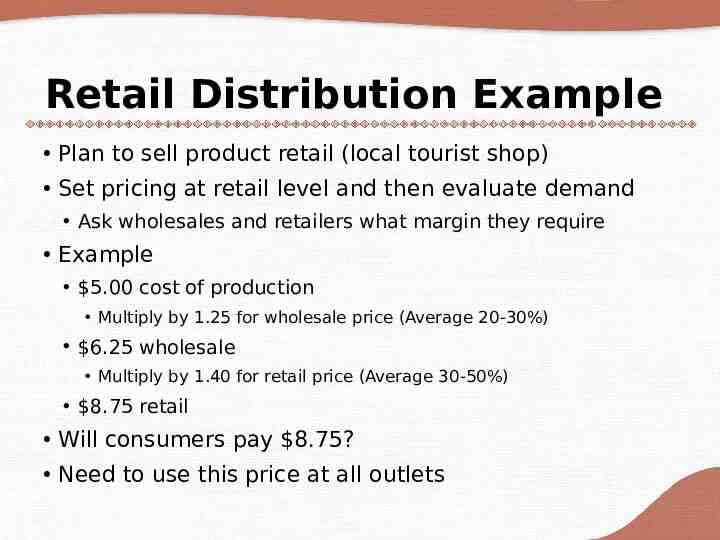
Retail Distribution Example Plan to sell product retail (local tourist shop) Set pricing at retail level and then evaluate demand Ask wholesales and retailers what margin they require Example 5.00 cost of production Multiply by 1.25 for wholesale price (Average 20-30%) 6.25 wholesale Multiply by 1.40 for retail price (Average 30-50%) 8.75 retail Will consumers pay 8.75? Need to use this price at all outlets
Demand-Oriented Pricing Price at customer value (willingness to pay) Price skimming Charge high price at first to pick up consumers willing to pay more Gradually reduce price to pick up consumers who are more price sensitive Penetration pricing Initial low price to capture market share Discourages competition Price is increased later when consumers are hooked Common in new food products
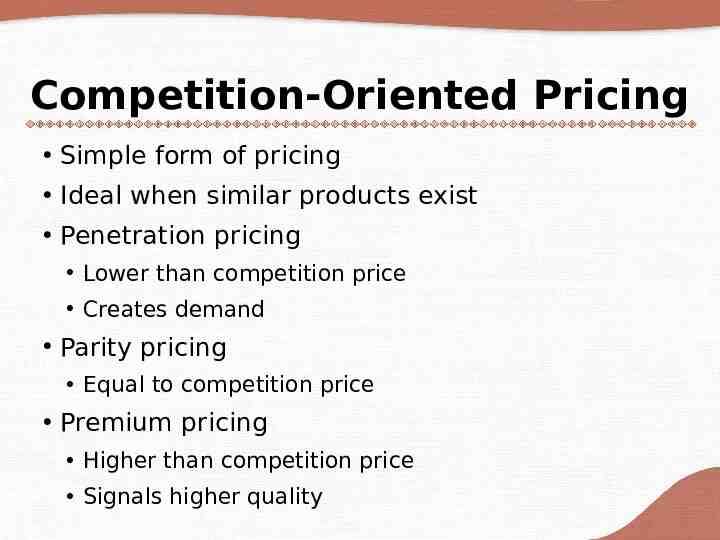
Competition-Oriented Pricing Simple form of pricing Ideal when similar products exist Penetration pricing Lower than competition price Creates demand Parity pricing Equal to competition price Premium pricing Higher than competition price Signals higher quality
Competitive Analysis How many competitors operate in the market? Are competitors large or small? Near or far? What types and numbers of products do they sell? What pricing methods do they use?
Consider External Factors In Pricing Distribution Wholesale and retail margins Transportation and packaging costs Environmental factors Taxes, weather events, fad diets, energy policy Legal/regulatory factors Labeling, certification, permits, safety
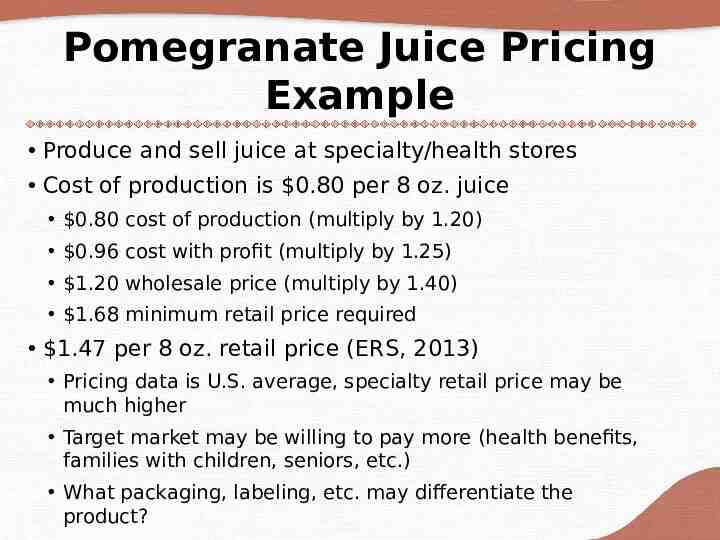
Pomegranate Juice Pricing Example Produce and sell juice at specialty/health stores Cost of production is 0.80 per 8 oz. juice 0.80 cost of production (multiply by 1.20) 0.96 cost with profit (multiply by 1.25) 1.20 wholesale price (multiply by 1.40) 1.68 minimum retail price required 1.47 per 8 oz. retail price (ERS, 2013) Pricing data is U.S. average, specialty retail price may be much higher Target market may be willing to pay more (health benefits, families with children, seniors, etc.) What packaging, labeling, etc. may differentiate the product?
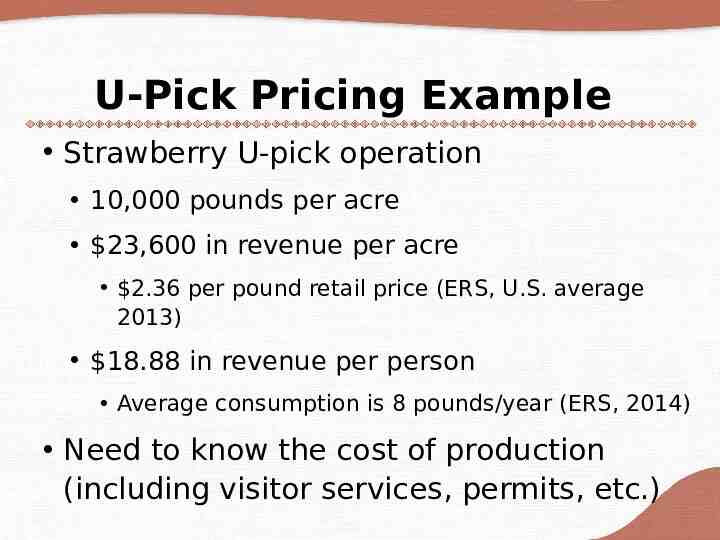
U-Pick Pricing Example Strawberry U-pick operation 10,000 pounds per acre 23,600 in revenue per acre 2.36 per pound retail price (ERS, U.S. average 2013) 18.88 in revenue per person Average consumption is 8 pounds/year (ERS, 2014) Need to know the cost of production (including visitor services, permits, etc.)
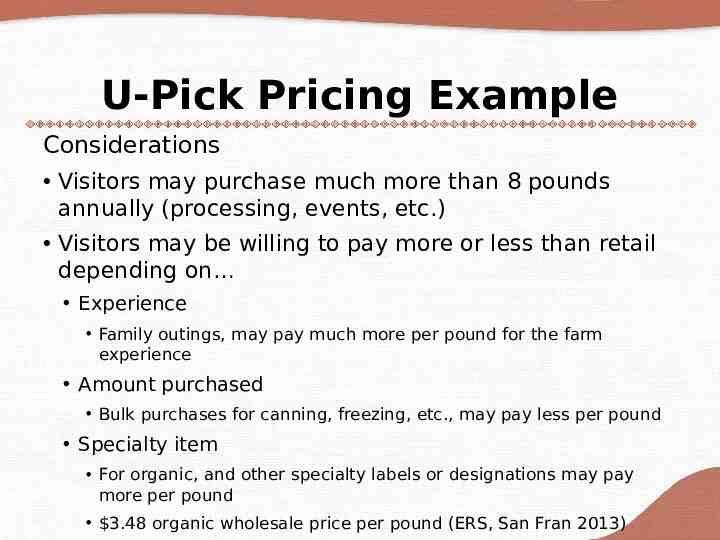
U-Pick Pricing Example Considerations Visitors may purchase much more than 8 pounds annually (processing, events, etc.) Visitors may be willing to pay more or less than retail depending on Experience Family outings, may pay much more per pound for the farm experience Amount purchased Bulk purchases for canning, freezing, etc., may pay less per pound Specialty item For organic, and other specialty labels or designations may pay more per pound 3.48 organic wholesale price per pound (ERS, San Fran 2013)
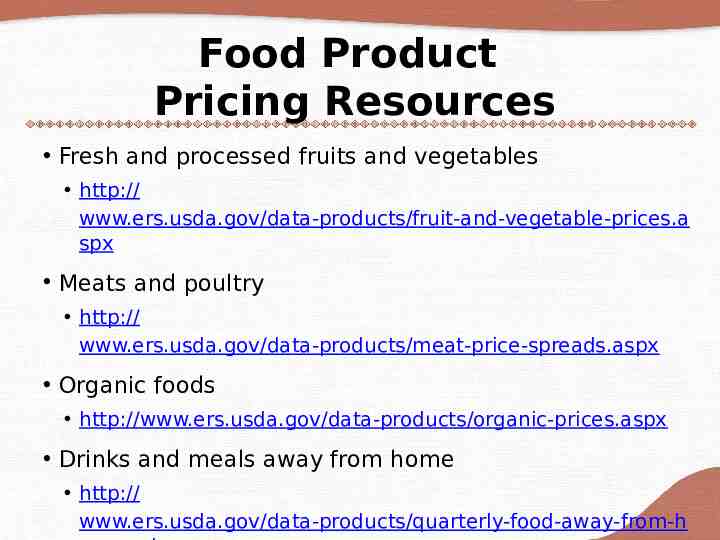
Food Product Pricing Resources Fresh and processed fruits and vegetables http:// www.ers.usda.gov/data-products/fruit-and-vegetable-prices.a spx Meats and poultry http:// www.ers.usda.gov/data-products/meat-price-spreads.aspx Organic foods http://www.ers.usda.gov/data-products/organic-prices.aspx Drinks and meals away from home http:// www.ers.usda.gov/data-products/quarterly-food-away-from-h
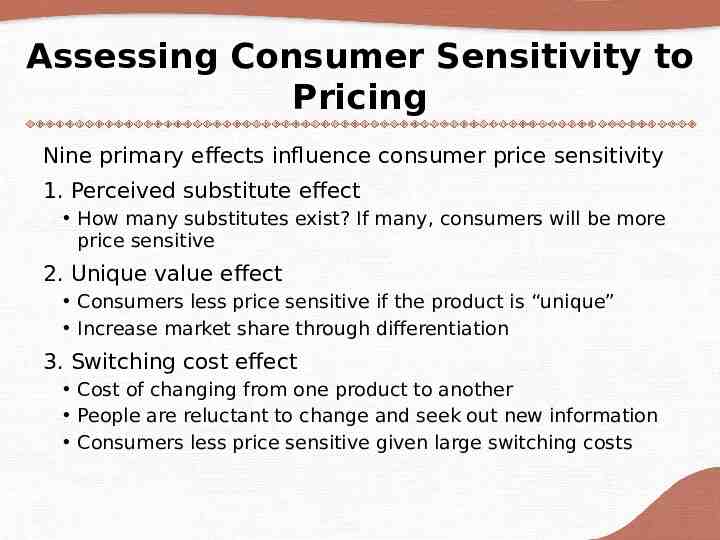
Assessing Consumer Sensitivity to Pricing Nine primary effects influence consumer price sensitivity 1. Perceived substitute effect How many substitutes exist? If many, consumers will be more price sensitive 2. Unique value effect Consumers less price sensitive if the product is “unique” Increase market share through differentiation 3. Switching cost effect Cost of changing from one product to another People are reluctant to change and seek out new information Consumers less price sensitive given large switching costs
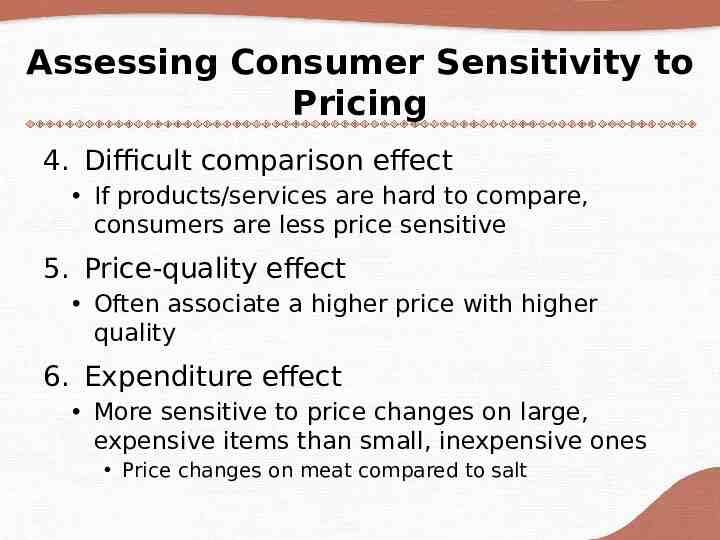
Assessing Consumer Sensitivity to Pricing 4. Difficult comparison effect If products/services are hard to compare, consumers are less price sensitive 5. Price-quality effect Often associate a higher price with higher quality 6. Expenditure effect More sensitive to price changes on large, expensive items than small, inexpensive ones Price changes on meat compared to salt
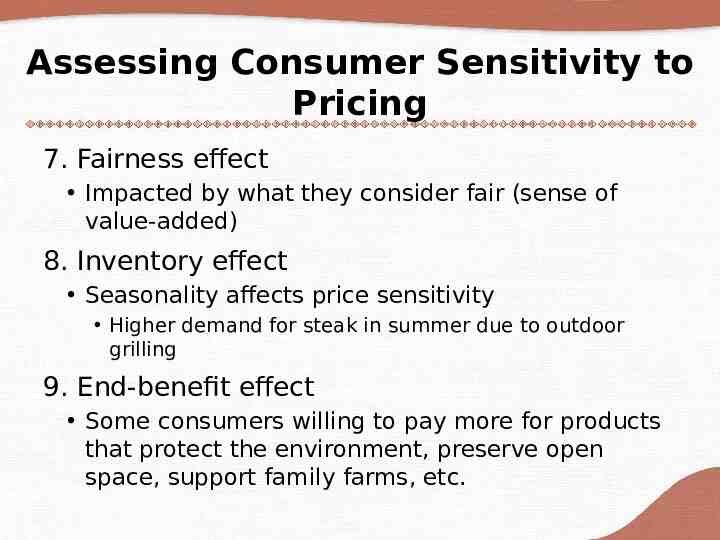
Assessing Consumer Sensitivity to Pricing 7. Fairness effect Impacted by what they consider fair (sense of value-added) 8. Inventory effect Seasonality affects price sensitivity Higher demand for steak in summer due to outdoor grilling 9. End-benefit effect Some consumers willing to pay more for products that protect the environment, preserve open space, support family farms, etc.
Market Assessment Process Define target market(s) for the product or service Consumers who have a need for the product or service and are willing to pay a profitable price for it Market assessment steps Estimate market size Available customer base and purchase amounts Estimate a feasible range of prices To cover production costs Assess consumer sensitivity to pricing
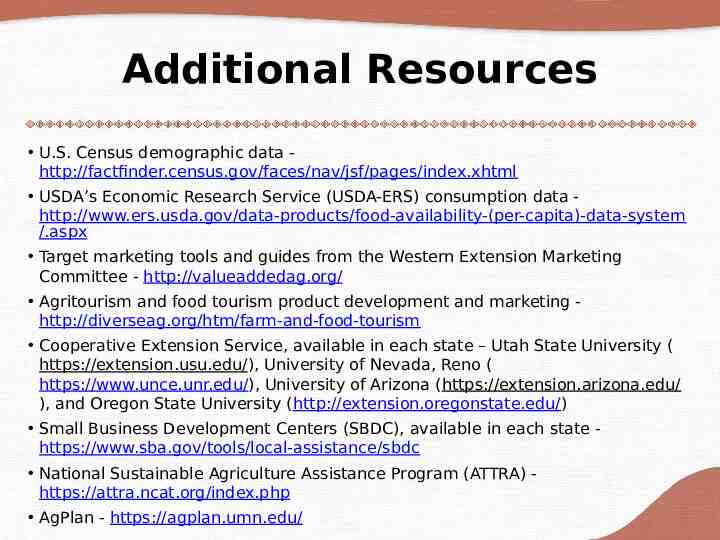
Additional Resources U.S. Census demographic data http://factfinder.census.gov/faces/nav/jsf/pages/index.xhtml USDA’s Economic Research Service (USDA-ERS) consumption data http://www.ers.usda.gov/data-products/food-availability-(per-capita)-data-system /.aspx Target marketing tools and guides from the Western Extension Marketing Committee - http://valueaddedag.org/ Agritourism and food tourism product development and marketing http://diverseag.org/htm/farm-and-food-tourism Cooperative Extension Service, available in each state – Utah State University ( https://extension.usu.edu/), University of Nevada, Reno ( https://www.unce.unr.edu/), University of Arizona (https://extension.arizona.edu/ ), and Oregon State University (http://extension.oregonstate.edu/) Small Business Development Centers (SBDC), available in each state https://www.sba.gov/tools/local-assistance/sbdc National Sustainable Agriculture Assistance Program (ATTRA) https://attra.ncat.org/index.php AgPlan - https://agplan.umn.edu/
Worksheets The following worksheets may be used to develop your product idea and complete a marketing plan Product/service description Target market(s) description Sales volume estimation Competition overview Pricing strategies Promotion plan
Thank you!