Corporate Solutions Avoiding E&O Claims From Catastrophes Sponsored by


76 Slides4.52 MB
Corporate Solutions Avoiding E&O Claims From Catastrophes Sponsored by the Big “I” Professional Liability Program and Swiss Re Corporate Solutions IIAA CAT Webinar Property & Business Interruption
Corporate Solutions Webinar goals Provide historical statistics and background on catastrophes Help your agency understand more about: – Catastrophic exposures facing customers – Key coverage considerations regarding products you’re selling – How your agency can reduce E&O exposure from them. Offer general agency E&O risk management guidance to assist in the avoidance and mitigation of E&O claims IIAA CAT Webinar Property & Business Interruption Visit the Big “I” Risk Management Website at www.iiaba.net/eohappens.
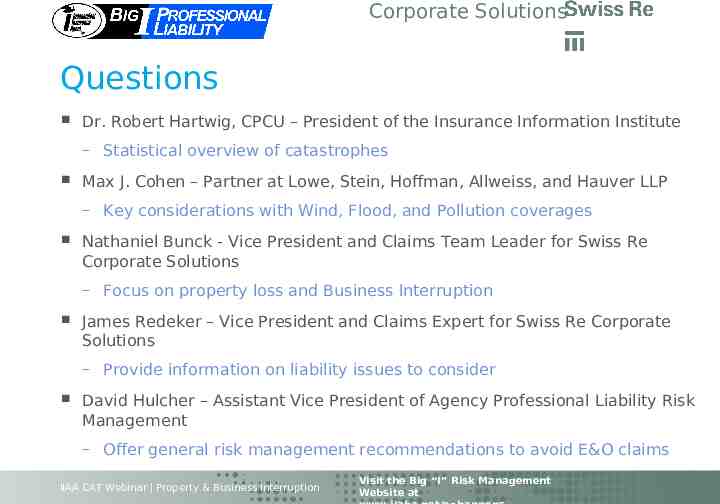
Corporate Solutions Questions Dr. Robert Hartwig, CPCU – President of the Insurance Information Institute – Statistical overview of catastrophes Max J. Cohen – Partner at Lowe, Stein, Hoffman, Allweiss, and Hauver LLP – Key considerations with Wind, Flood, and Pollution coverages Nathaniel Bunck - Vice President and Claims Team Leader for Swiss Re Corporate Solutions – Focus on property loss and Business Interruption James Redeker – Vice President and Claims Expert for Swiss Re Corporate Solutions – Provide information on liability issues to consider David Hulcher – Assistant Vice President of Agency Professional Liability Risk Management – Offer general risk management recommendations to avoid E&O claims IIAA CAT Webinar Property & Business Interruption Visit the Big “I” Risk Management Website at www.iiaba.net/eohappens.
Corporate Solutions Presenters Please send questions to: – Nathaniel Bunck at Nathaniel [email protected] – Jim Redeker at James [email protected] – Max Cohen at [email protected] – David Hulcher at [email protected] For technical coverage questions, Big “I” Virtual University Experts stand ready to assist at: http://www.iiaba.net/VU/Experts/ExpertsMain.htm IIAA CAT Webinar Property & Business Interruption Visit the Big “I” Risk Management Website at www.iiaba.net/eohappens.
Avoiding E&O Claims from Catastrophes Catastrophe Loss Overview Big “I” Professional Liability Program & Swiss Re Corporate Solutions July 21, 2011 Robert P. Hartwig, Ph.D., CPCU, President & Economist Insurance Information Institute 110 William Street New York, NY 10038 Tel: 212.346.5520 Cell: 917.453.1885 [email protected] www.iii.org
Presentation Outline US Catastrophe Loss Update 2011: A Year for the Record Books Spring 2011 Tornadoes & Other Severe Storms ITV , Contents Issues Hurricane Risk Wind vs. Water Flood Risk Standard Flooding Levee Failure Seismic Risk Earthquake Coverage Take-Up Rates Nuclear Exposure (e.g., could Fukishima happen in the US?) 6
US Catastrophe Loss Update 2011 Is a Year for the Record Books But Is Part of a Longer-Term Trend Implies Potential E&O Exposure 7
US Insured Catastrophe Losses ( Billions) 120 100 80 61.9 2000s: A Decade of Disaster 2000s: 193B (up 117%) 1990s: 89B 100.0 100 Billion CAT Year is Coming Eventually Record Tornado Losses Caused H1 CAT Losses to Surge 17.3 13.6 10.6 6.7 9.2 27.1 27.5 12.9 5.9 26.5 4.6 8.3 10.1 2.6 7.4 8.3 5.5 4.7 2.7 7.5 20 22.9 40 16.9 60 0 89 90 91 92 93 94 95 96 97 98 99 00 01 02 03 04 05 06 07 08 09 10 11*20? First Half 2011 US CAT Losses Already Exceed Losses from All of 2010. Even Modest Hurricane Losses Will Make 2011 Among the Most Expensive Ever for CATs *First half 2011. Note: 2001 figure includes 20.3B for 9/11 losses reported through 12/31/01. Includes only business and personal property claims, business interruption and auto claims. Non-prop/BI losses 12.2B. Sources: Property Claims Service/ISO; Insurance Information Institute. 8
Natural Disaster Losses in the United States: First 6 Months 2011 Source: MR NatCatSERVICE 9
Top 12 (13?) Most Costly Disasters in U.S. History (Insured Losses, 2010 Dollars, Billions) 50 45 40 35 30 25 20 15 10 5 0 Taken as a single event, the Spring 2011 tornado season would likely become 5th costliest event in US insurance history 45.8 22.6 23.1 4.3 5.3 Jeanne Frances (2004) (2004) 6.3 6.7 Rita (2005) Hugo (1989) 8.2 8.6 Ivan (2004) Charley (2004) 14.0 11.5 12.8 Wilma (2005) 17.5 Ike Spring Northridge Andrew 9/11 Attack Katrina (2008) Tornadoes* (1994) (1992) (2001) (2005) (2011) *Losses will actually be broken down into several “events” as determined by PCS. Sources: PCS; Insurance Information Institute inflation adjustments. 10
Combined Ratio Points Associated with Catastrophe Losses: 1960 – 2011:H1* 5.0 2.6 3.3 2010E 2008 2006 1.6 2.7 3.3 3.3 2004 1.6 2002 5.0 8.1 5.4 1.6 2000 1998 1996 1992 1.0 3.6 2.9 2.3 2.1 1.2 1990 1988 1986 1984 1982 1980 1978 1976 1974 1972 1970 1968 1.2 0.4 0.8 1.3 0.3 0.4 0.7 1.5 1.0 0.4 0.4 0.7 1.8 1.1 0.6 1.4 2.0 1.3 2.0 0.5 0.5 0.7 3.0 3.6 0.4 1966 1964 1962 0.8 1.1 1.1 0.1 0.9 1 0 1960 4 3 2 5.9 1960s: 1.04 1970s: 0.85 1980s: 1.31 1990s: 3.39 2000s: 3.52 2010s: 4.15* 8 7 6 5 3.3 2.8 10 9 8.8 Avg. CAT Loss Component of the Combined Ratio by Decade 1994 Combined Ratio Points The Catastrophe Loss Component of Private Insurer Losses Has Increased Sharply in Recent Decades *Insurance Information Institute estimates for 2010 and 2011:H1 Notes: Private carrier losses only. Excludes loss adjustment expenses and reinsurance reinstatement premiums. Figures are adjusted for losses ultimately paid by foreign insurers and reinsurers. Source: ISO; Insurance Information Institute. 11
Natural Disasters in the United States, 1980 – 2011* Number of Events (Annual Totals 1980 – 2010 and First Half 2011) 300 There were 98 natural disaster events in the first half of 2011 250 Number 200 150 100 37 8 50 51 2 1980 1982 1984 1986 1988 Geophysical (earthquake, tsunami, volcanic activity) *Through June 30. Source: MR NatCatSERVICE 1990 1992 1994 1996 1998 Meteorological (storm) Hydrological (flood, mass movement) 2000 2002 2004 2006 2008 2010 Climatological (temperature extremes, drought, wildfire) 12
U.S. Thunderstorm Loss Trends, 1980 – 2011* Thunderstorm losses in the first half of 2011 totaled 16.4 billion, a new annual record through just 6 months Average thunderstorm losses are up more than 8 fold since the early 1980s *Through June 30, 2011. Source: Property Claims Service, MR NatCatSERVICE Hurricanes get all the headlines, but thunderstorms are consistent producers of large scale loss. 2008-2011 are the most expensive years on record. 13
U.S. Winter Storm Loss Trends, 1980 – 2010 (Annual Totals) vs. First Half 2011 Insured winter storm losses in 2011 totaled 1.4 billion and are up 50% since 1980. Source: Property Claims Service, MR NatCatSERVICE 14
U.S. Acreage Burned by Wildfires, 1980 – 2010 (Annual Totals) vs. First Half 2011 2011 could be a severe year for wildfire damage. Acres burned through June 30 already exceed all of 2010. Source: National Forest Service, MR NatCatSERVICE 15
WILDFIRE: 10 Most Costly Wildfires, by Insured Loss 16
Inflation Adjusted U.S. Catastrophe Losses by Cause of Loss, 1990–2011:H11 Wind/Hail/Flood (3), 12.7 Fires (4), 9.0 Other (5), 0.6 2.4% Geological Events, 18.5 Terrorism, 24.9 4.9% 3.4%0.2% 6.6% Winter Storms, 30.0 42.7% 8.0% Hurricanes & Tropical Storms, 160.5 Tornado share of CAT losses is rising 31.8% Tornadoes (2), 119.5 Wind losses are by far cause the most catastrophe losses, even if hurricanes/TS are excluded. 1.Catastrophes are defined as events causing direct insured losses to property of 25 million or more in 2009 dollars. 2.Excludes snow. 3.Does not include NFIP flood losses 4.Includes wildland fires 5.Includes civil disorders, water damage, utility disruptions and non-property losses such as those covered by workers compensation. Source: ISO’s Property Claim Services Unit. 17
0 75 59 48 48 52 45 45 49 50 56 63 65 69 75 44 32 36 32 43 45 31 11 24 21 27 28 23 34 38 42 15 17 17 19 11 11 22 20 25 25 12 12 7 7 10 53 54 55 56 57 58 59 60 61 62 63 64 65 66 67 68 69 70 71 72 73 74 75 76 77 78 79 80 81 82 83 84 85 86 87 88 89 90 91 92 93 94 95 96 97 98 99 00 01 02 03 04 05 06 07 08 09 10 11* 20 13 17 18 16 16 30 29 40 23 50 22 25 60 38 70 30 80 The number of federal disaster declarations is on track to set a new record in 2011, with 48 declarations through July 1. There have been 1,998 federal disaster declarations since 1953. The average number of declarations per year is 34 from 1953-2010, though that few haven’t been recorded since 1995. 48 46 46 90 81 Number of Federal Disaster Declarations, 1953-2011* The Number of Federal Disaster Declarations Is Rising *Through July 1, 2011. Source: Federal Emergency Management Administration: http://www.fema.gov/news/disaster totals annual.fema ; Insurance Information Institute.
Federal Disasters Declarations by State, 1953 – June 30, 2011: Highest 25 States Over the past nearly half century, Texas has led the US in Federal Disaster Declarations 39 39 42 44 44 44 45 45 46 46 47 49 50 51 52 52 54 55 63 42 40 56 60 50 70 70 63 Disaster Declarations 80 78 90 85 100 30 20 10 0 TX CA OK FL NY LA AL KY AR MO IL MS TN MN IA WV KS NE OH PA WA ND VA IN NC Source: FEMA. 19
Federal Disasters Declarations by State, 1953 – June 30, 2011: Lowest 25 States 8 8 8 13 15 15 16 17 20 23 23 24 25 25 25 25 27 35 35 36 38 9 10 20 20 29 30 30 Disaster Declarations 40 39 50 0 SD ME GA AK WI VT NJ OR HI MA MI NH AZ ID NM MD MT NV CO CT SC DE DC RI UT WY Source: FEMA. 20
Spring 2011 Tornadoes & Severe Storms Few Coverage Disputes, ITV and Contents Disputes Can Sometimes Be an Issue 21
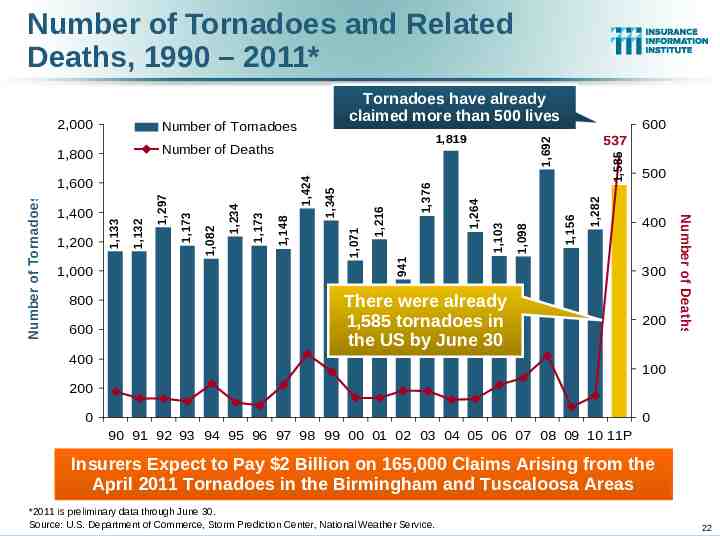
Number of Tornadoes and Related Deaths, 1990 – 2011* 800 600 1,282 1,585 1,692 1,098 1,103 1,376 1,216 1,071 1,148 1,173 1,234 1,082 1,173 1,297 1,132 537 941 1,000 1,133 1,200 600 There were already 1,585 tornadoes in the US by June 30 400 500 400 300 200 Number of Deaths Number of Tornadoes 1,600 1,345 1,424 Number of Deaths 1,800 1,400 1,819 1,156 Number of Tornadoes 1,264 2,000 Tornadoes have already claimed more than 500 lives 100 200 0 0 90 91 92 93 94 95 96 97 98 99 00 01 02 03 04 05 06 07 08 09 10 11P Insurers Expect to Pay 2 Billion on 165,000 Claims Arising from the April 2011 Tornadoes in the Birmingham and Tuscaloosa Areas *2011 is preliminary data through June 30. Source: U.S. Department of Commerce, Storm Prediction Center, National Weather Service. 22
U.S. Tornado Count, 2005-2011* ThereTornado were 1,585 tornadoes inactivity the USwas in 2010, off slightly abovepace average its record by mid-year Deadly and costly April/ May spike Source: http://www.spc.noaa.gov/wcm/ *Through July 2. 23
Location of Tornadoes in the US, January 1—June 30, 2011 1,585 tornadoes killed 537 people through June 30, including at least 340 on April 26 mostly in the Tuscaloosa area, and 130 in Joplin on May 22 Source: NOAA Storm Prediction Center; http://www.spc.noaa.gov/climo/online/monthly/2011 annual summary.html# 24
Location of Large Hail Reports in the US, January 1—June 30, 2011 There were 7,176 “Large Hail” reports through June 30, causing extensive damage to homes, businesses and vehicles Source: NOAA Storm Prediction Center; http://www.spc.noaa.gov/climo/online/monthly/2011 annual summary.html# 25
Location of Wind Damage Reports in the US, January 1—June 30, 2011 There were 11,283 “Wind Damage” reports through June 30, causing extensive damage to homes and, businesses Source: NOAA Storm Prediction Center; http://www.spc.noaa.gov/climo/online/monthly/2011 annual summary.html# 26
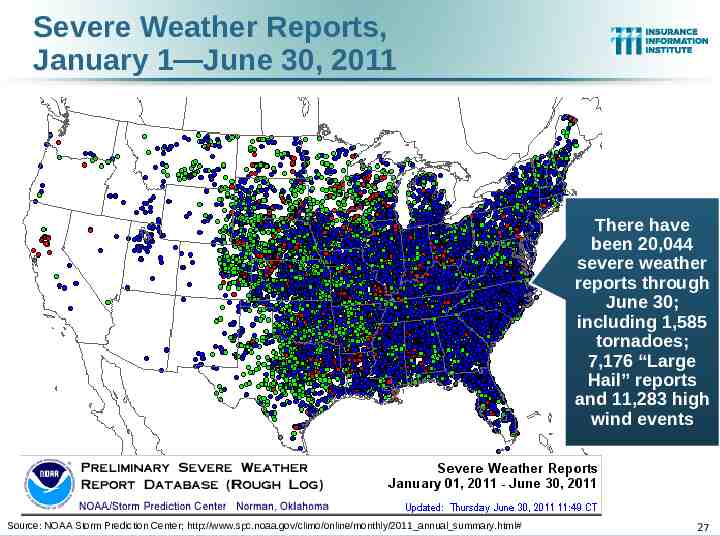
Severe Weather Reports, January 1—June 30, 2011 There have been 20,044 severe weather reports through June 30; including 1,585 tornadoes; 7,176 “Large Hail” reports and 11,283 high wind events Source: NOAA Storm Prediction Center; http://www.spc.noaa.gov/climo/online/monthly/2011 annual summary.html# 27
Number of Severe Weather Reports in US, by Type: January 1—June 30, 2011 Tornadoes, 1,585 , 8% Wind Damage, 11,283 , 56% Large Hail, 7,176 , 36% Tornadoes accounted for just 8% of all Severe Weather Reports through June 30 but more than 500 deaths Source: NOAA Storm Prediction Center; http://www.spc.noaa.gov/climo/online/monthly/2011 annual summary.html#
Outlook for the 2011 Atlantic Hurricane Season Wind vs. Water Debate Could Potentially Reemerge 29
Outlook for 2011 Hurricane Season: 75% More Active Than Average Average* 2005 2011F (Katrina Year) Named Storms 9.6 28 16 Named Storm Days 49.1 115.5 80 Hurricanes Hurricane Days Intense Hurricanes 5.9 24.5 2.3 14 47.5 7 9 35 5 Intense Hurricane Days 5.0 7 10 Accumulated Cyclone Energy 96.1 NA 160 Net Tropical Cyclone Activity 100% 275% 175% *Average over the period 1950-2000. Source: Dr. Philip Klotzbach and Dr. William Gray, Colorado State University, June 1, 2011.
Probability of Major Hurricane Landfall 3, 4, 5) in 2011 (CAT Average* 2011F Entire US Coast 52% 72% US East Coast Including Florida Peninsula Gulf Coast from FL Panhandle to Brownsville, TX 31% 48% 30% 47% ALSO Above-Average Major Hurricane Landfall Risk in Caribbean for 2011 (61% vs. 42%) *Average over the period 1950-2000. Source: Dr. Philip Klotzbach and Dr. William Gray, Colorado State University, June 1, 2011.
US Property Residual Markets Remain Under Strain Some Coastal Policies Need to Obtain All or Part of Their Coverage via StateRun Pools and Plans 32
U.S. Residual Market Exposure to Loss ( Billions) ( Billions) 900 Katrina, Rita and Wilma 800 700 500 400 281.8 200 100 757.9 430.5 419.5 372.3 Hurricane Andrew 300 703.0 696.4 656.7 4 Florida Hurricanes 600 771.9 292.0 221.3 244.2 150.0 54.7 0 1990 1995 1999 2000 2001 2002 2003 2004 2005 2006 2007 2008 2009 2010 In the 21-year period between 1990 and 2010, total exposure to loss in the residual market (FAIR & Beach/Windstorm) Plans has surged from 54.7 billion in 1990 to 757.9 billion in 2010. Source: PIPSO; Insurance Information Institute (I.I.I.); http://www.iii.org/pr/last-resort-2010. 33
U.S. Residual Market: Total Policies In-Force (1990-2010) (000) (000) Katrina, Rita and Wilma 3,000 4 Florida Hurricanes 2,500 2,841.4 2,621.3 2,479.4 2,209.3 2,203.9 2,000 1,500 2,780.6 2,840.4 Hurricane Andrew 1,785.0 1,319.7 1,458.1 1,741.7 1,642.3 1,196.5 1,000 931.6 500 0 1990 1995 1999 2000 2001 2002 2003 2004 2005 2006 2007 2008 2009 2010 In the 21-year period between 1990 and 2010, the total number of policies in-force in the residual market (FAIR & Beach/Windstorm) Plans has more than tripled. Source: PIPSO; Insurance Information Institute; http://www.iii.org/pr/last-resort-2010. 34
Flood Risk, Levee Failures Record Flooding in the US, Possibility of Levee Failures Can Lead to E&O Exposures 35
FLOOD: 10 Most Significant Flood Events by NFIP Payouts 36
LEVEES: Probability of Flooding Behind Levees Over Life of 30-Yr. Mortgage Surprise!! There is a 26% chance of a home flooding over the course of a 30 year mortgage behind a levee providing a 1-in-100 year protection level Source: FEMA. 37
FLOODING: 2011 Flooding Was Extensive, Especially Along the MS/MO Rivers Widespread, major floods could create a potential E&O exposure for agents Source: US Geological Service. 38
Seismic Risk, Earthquakes & Nuclear Power Could the Tragedy of Fukishima Happen in the US Is There an E&O Exposure? 39
EARTHQUAKE: 10 Most Costly Earthquakes, by Insured Loss 40
Estimated Insured Losses for the Top 10 Historical Earthquakes Based on Current Exposures (1) ( Billion) Rank Date Location Magnitude Insured loss (current exposures) 1 Feb. 7, 1812 New Madrid, MO 7.7 100 2 Apr. 18, 1906 San Francisco, CA 7.8 96 3 Aug. 31, 1886 Charleston, SC 7.3 37 4 Jun. 1, 1838 San Francisco, CA 7.4 27 5 Jan. 17, 1994 Northridge, CA 6.7 21 6 Oct. 21, 1868 Hayward, CA 7.0 21 7 Jan. 9, 1857 Fort Tejon, CA 7.9 8 8 Oct. 17, 1989 Loma Prieta, CA 6.3 6 9 Mar. 10, 1933 Long Beach, CA 6.4 5 10 Jul. 1, 1911 Calaveras, CA 6.4 4 (1) Modeled loss to property, contents, and business interruption and additional living expenses for residential, mobile home, commercial and auto exposures as of December 31, 2008. Losses include demand surge and fire following earthquake. Policy conditions and earthquake insurance take up rates are based on estimates by state insurance departments and client claims data. Source: AIR Worldwide Corporation. 41
Percentage of California Homeowners with Earthquake Insurance, 1994-2010* The vast majority of California homeowners forego earthquake coverage and play Russian Roulette with their most valuable asset 35% 32.9% 33.2% 30% 25% 19.5% 20% 17.4% 16.8% 15.7% 15.8% 15% 14.6% 13.3% 13.8% 12.0% 12.0% 10% 5% 0% 94 96 97 98 99 00 01 02 03 04 06** *Includes CEA policies beginning in 1996. **2006/10 estimates from Insurance Information Network of CA. Source: California Department of Insurance; Insurance Information Institute. 10**
49% 63% 69% 55% 51% 51% 56% 45% 43% 32% 40% 37% 50% 36% 60% 48% 70% 54% 80% Between 32% and 63% of MO homeowners buy quake coverage in vulnerable areas compared to 12% of CA homeowners and about 50% in Japan. 63% 73% % of Residences in MO Quake-Prone Areas with Earthquake Coverage, 2009 vs. 2002 30% 20% 10% 0% St. Louis City St. Louis County Dunklin Mississippi New Madrid Pemiscot 2002 Scott Stoddard 2009 Residential Take-Up Rates in Missouri Quake-Prone Counties Have Fallen Significantly in Recent Years, but Compare Favorably to California (12%) Sources: Missouri Department of Insurance news release, Feb. 11, 2011; Insurance Information Institute. 43
WILDFIRE: 10 Most Costly Wildfires, by Insured Loss 44
Insurance Information Institute Online: www.iii.org Thank you for your time and your attention! Twitter: twitter.com/bob hartwig
Corporate Solutions Flood, wind & pollution Max J. Cohen Lowe, Stein, Hoffman, Allweiss & Hauver, L.L.P. New Orleans, Louisiana IIAA CAT Webinar Property & Business Interruption Visit the Big “I” Risk Management Website at www.iiaba.net/eohappens.
Corporate Solutions Flood (1/2) Readily available through the National Flood Insurance Program (NFIP) What is the NFIP? Who may purchase a flood policy? Does your community participate in the NFIP? – www.fema.gov/fema/csb.shtm – 800-427-4661 – Big “I” Flood Program – [email protected] What types of property are insured by a NFIP policy? What property is not insurable? Is there a waiting period? IIAA CAT Webinar Property & Business Interruption Available to members: Need help writing flood coverage? Check with your state association – they may have a program designed for you. Members can also access to the Big “I” Flood Program. Learn more at: www.iiaba.net/flood Visit the Big “I” Risk Management Website at www.iiaba.net/eohappens.
Corporate Solutions Flood (2/2) Types of coverage available from the NFIP – Dwelling Form – General Property Form – Residential Condominium Building Association Policy (RCBAP) Limitations on amount of coverage available and valuation Excess Flood Insurance Duty to recommend and/or offer excess coverage IIAA CAT Webinar Property & Business Interruption Visit the Big “I” Risk Management Website at www.iiaba.net/eohappens.
Corporate Solutions Wind (1/2) Some policies exclude wind coverage. Some policies are renewed without wind coverage Some policies are renewed with significant changes in the deductible Carefully review renewal quotes and policies and inform your client of significant changes Off-premises power failure IIAA CAT Webinar Property & Business Interruption Visit the Big “I” Risk Management Website at www.iiaba.net/eohappens.
Corporate Solutions Wind (2/2) Homeowner policies contain limits for certain items Scheduled items – Coverage for wind and/or flood – No deductible – Does not reduce general limit of contents coverage IIAA CAT Webinar Property & Business Interruption Visit the Big “I” Risk Management Website at www.iiaba.net/eohappens.
Corporate Solutions Pollution (1/2) Total Pollution Exclusion – Intended to exclude claims for pollution and environmental hazards – May or may not be enforceable – Application of exclusion in Louisiana Pollution events occur during catastrophes such as hurricanes, tornadoes and earthquakes. – Hurricane Katrina - Murphy Oil Refinery Spill IIAA CAT Webinar Property & Business Interruption Visit the Big “I” Risk Management Website at www.iiaba.net/eohappens.
Corporate Solutions Pollution (2/2) Does your client have a pollution risk? Does your client need a separate pollution and environmental liability policy? Pollution insurance can protect your client’s business in two important ways: – First party coverage – Third party coverage Available to members: Need help writing environmental impairment-pollution coverage? Big “I” Markets can assist you with your customer’s environmental impairment or pollution needs. Learn more at: www.bigimarkets.com IIAA CAT Webinar Property & Business Interruption Visit the Big “I” Risk Management Website at www.iiaba.net/eohappens.
Corporate Solutions Property Insurance issues with catastrophes Nate Bunck Vice President and Claims Team Leader Swiss Re Corporate Solutions IIAA CAT Webinar Property & Business Interruption Visit the Big “I” Risk Management Website at www.iiaba.net/eohappens.
Corporate Solutions General Property Coverage Issues Setting Limits Wild Fires – Protection Class – Insuring to value Nuclear – Total Nuclear Exclusion? – No E&O experience – virtually none in general – 1994 Pennsylvania lawsuit Future Concerns – Broad Geographic Exposure – Applicability of lessons from Katrina IIAA CAT Webinar Property & Business Interruption Visit the Big “I” Risk Management Website at www.iiaba.net/eohappens.
Corporate Solutions Earthquake Coverage Limited Experience – 3 cases in 10 years – "Where" may be surprising – Same errors as other lines Future Concerns – Broader Geographic Exposure than Perceived – Applicability of lessons from Katrina Risk Management – Discussion – Documentation IIAA CAT Webinar Property & Business Interruption Visit the Big “I” Risk Management Website at www.iiaba.net/eohappens.
Corporate Solutions Business Interruption Broad experience – Katrina/Rita/Wilma – Other CAT Events Not commonly understood by insureds Historical Business Interruption Errors: – Failure to obtain indirect loss coverage – Failure to add new locations – Failure to arrange proper coverage – Failure to advise of restrictions and limitations in policies – Failure to provide adequate amounts of coverage Even more important following a CAT claims event IIAA CAT Webinar Property & Business Interruption Visit the Big “I” Risk Management Website at www.iiaba.net/eohappens.
Corporate Solutions Business Interruption and Global Challenges Interrelated Global Business Systems: Even small businesses in rural areas are increasingly part of a supply and customer chain that can stretch across international borders with multiple, dependant layers. These systems are heavily dependent on new technology and easy access to transportation to rapidly changing markets. These systems are more vulnerable than previously imagined to CAT perils. IIAA CAT Webinar Property & Business Interruption Visit the Big “I” Risk Management Website at www.iiaba.net/eohappens.
Corporate Solutions Contingent Business Income Insurability for damage to 3rd parties on which the insured is dependant is complicated by new Lean Production Models: – “Just In Time” Production – Outsourcing – Reduced Suppliers – Eliminating Stock Third World Suppliers Contingent Extra Expense – Designed to cover increased costs following CAT event – Avoids Contingent Business IIAA CAT Webinar Property & Business Interruption Visit the Big “I” Risk Management Website at www.iiaba.net/eohappens.
Corporate Solutions Restricted Access While business interruption damages due to restricted access by official order is generally covered, there is also need for similar losses where there are physical impediments to access but no government order restricting the same. Clear limitation on access will be the challenge rather than showing a direct causal connection to the damages. Natural Catastrophe Driven - Avalanches, Landslides, Earthquakes. Events that make access difficult but not technically impossible. IIAA CAT Webinar Property & Business Interruption Visit the Big “I” Risk Management Website at www.iiaba.net/eohappens.
Corporate Solutions Service Interruption IT Outage – Local Outages – External Network Outages Loss of Data IT failure presents additional complications to insurability due to pace at which network changes and updates are made, as well as the ever changing security environment. IIAA CAT Webinar Property & Business Interruption Visit the Big “I” Risk Management Website at www.iiaba.net/eohappens.
Corporate Solutions Future Challenges for Agents Increasing number of risks that include the elements of conventional business interruption insurance, but are not triggered by direct property damage. Heightened Evaluation of Client’s Risks – Increasingly Changing Nature – Wider Breadth of Risk – Quantify Damages As carriers expand coverage for these risks or major CAT events test expectations around such coverage, we expect claims around these products. IIAA CAT Webinar Property & Business Interruption Visit the Big “I” Risk Management Website at www.iiaba.net/eohappens.
Corporate Solutions Liability issues with catastrophes Jim Redeker Vice President and Claims Expert Swiss Re Corporate Solutions IIAA CAT Webinar Property & Business Interruption Visit the Big “I” Risk Management Website at www.iiaba.net/eohappens.
Corporate Solutions Commercial General Liability General policy exclusions include: – Asbestos – Lead – Mold – Nuclear – Pollution (and pollution related damages) – Silica Umbrella Coverage – Make sure it follows form IIAA CAT Webinar Property & Business Interruption Visit the Big “I” Risk Management Website at www.iiaba.net/eohappens.
Corporate Solutions Professional Liability Directors & Officers exposures include: Home Owners Associations Condo Associations Errors & Omissions exposures include: Architects & Engineers Insurance Agents Anyone who provides a service for a fee has an errors & omissions exposure. IIAA CAT Webinar Property & Business Interruption Visit the Big “I” Risk Management Website at www.iiaba.net/eohappens.
Corporate Solutions Business Continuity Management (1/2) While Risk Management protects the company’s earning power, BCM focuses on ensuring that a company can quickly recover from disruptions to its operations. A Business Continuity Management (BCM) plan will include how the company will work with its insurance carrier to: – Provide first notice – Mitigate losses – Provide financial data for loss evaluation – Minimize the duration of the interruption loss IIAA CAT Webinar Property & Business Interruption Visit the Big “I” Risk Management Website at www.iiaba.net/eohappens.
Corporate Solutions Business Continuity Management (2/2) Estimation: Identifying and prioritizing all possible business interruption risks by likelihood and amount of damage to the company’s income. Design: Formulating a plan for addressing each interruption concern and putting resources in place. Management: Both initial and ongoing testing of the plan will be necessary to ensure that it meets and continues to meet business needs. In addition, testing should identify areas where risks can be greatly reduced and/or eliminated. IIAA CAT Webinar Property & Business Interruption Visit the Big “I” Risk Management Website at www.iiaba.net/eohappens.
Corporate Solutions General Agency E&O risk management guidance David Hulcher Assistant Vice President of Agency Professional Liability Risk Management IIABA IIAA CAT Webinar Property & Business Interruption Visit the Big “I” Risk Management Website at www.iiaba.net/eohappens.
Corporate Solutions E&O Risk Management considerations of catastrophes It takes an uncovered claim E&O claim you did something wrong “To say or Not to Say” E&O risk management culture within the agency State standard of care and duty to advise a customer Understand your duties Legal duty vs. agency best practices Article at www.iiaba.net/EOhappens under “Standard of Care” tab “Say what you do and do what you say!” IIAA CAT Webinar Property & Business Interruption Visit the Big “I” Risk Management Website at www.iiaba.net/eohappens.
Corporate Solutions Risk Management (1/5) Product knowledge Exclusive to members: – What’s covered and what’s not – Invest in training staff (work with your state association) – Educate your customer (www.trustedchoice.com) Know your carrier and your authority – Financial ratings – Carrier contracts and binding authority Understand your customer's operation – Communication – Risk exposure identification – Exposure analysis and increased profits IIAA CAT Webinar Property & Business Interruption Commercial and Personal Lines Risk Exposure Evaluation System (including E&O coverage checklist) PF&M provide detail analysis of policy forms and endorsements Insurance Word Glossary Insurance related articles to educate customers. Learn more at: www.iiaba.net/VRC Visit the Big “I” Risk Management Website at www.iiaba.net/eohappens.
Corporate Solutions Risk Management (2/5) Applications Sample proposal disclaimer language: – Timeliness – Additional steps to bind – Material facts – Customer signature Proposals – Give options, let customer decide – Increased limits – umbrella/excess policies – Disclaimer language – Explain complex terms – Coverage limitations or uncovered exposure – Duties in event of a claim – Expiration date on quotes and proposals IIAA CAT Webinar Property & Business Interruption This is a proposal (or summary) provided for illustration purposes only; it is not a legal contract. It is provided to facilitate your understanding of your insurance program. Please refer to the actual policies for specific terms, coverage, conditions, limitations and exclusions that will govern the event of a loss. Specimen copies of all policies are available for review prior to the binding of coverage. In assisting you with your insurance needs we have been dependent upon information provided to us by you. If there are other areas that need to be evaluated prior to binding of coverage, please bring them to our attention. Should any of your business operations or exposures to loss change after coverage is bound, it is the customers responsibility to let us know promptly so proper coverage(s) can be discussed. Visit the Big “I” Risk Management Website at www.iiaba.net/eohappens.
Corporate Solutions Risk Management (3/5) E&O Coverage Checklist/Rejection Forms – Coverages available and offered/rejected – File documentation Documentation – Importance in an E&O claim – Reductions in coverage and limits – Consistent procedures – Invariable practice – Documentation - Who, What, Where, When, How IIAA CAT Webinar Property & Business Interruption Visit the Big “I” Risk Management Website at www.iiaba.net/eohappens.
Corporate Solutions Risk Management (4/5) Claims Available to members: – Coverage determination – Reporting claims to carrier – Notify all relevant carriers – Follow-up until resolution Disaster Plan for the Agency – Business continuity plan – Resources available: Best Practices of Crisis Management—A Step-By-Step Business Recovery Planner Agility works with over 1,000 insurance agencies helping them be prepared to get back in business after a disaster. They provide disaster preparedness services like remote location or “hot site” or their Agility ReadySuite mobile replacement office capability. Learn more at: www.agilityrecovery.com IIAA CAT Webinar Property & Business Interruption Visit the Big “I” Risk Management Website at www.iiaba.net/eohappens.
Corporate Solutions Risk Management (5/5) Catastrophe extra expense – Swiss Re Corporate Solutions policy feature at no extra charge CATASTROPHE EXTRA EXPENSE. We will pay up to 10,000 per catastrophe subject to a per “policy period” aggregate limit of 25,000 for the actual extra expenses incurred by you as a result of a catastrophe during the “policy period” beginning on the date of a catastrophe and for thirty (30) days thereafter. The extra expense incurred must be incurred by you only to assist in the insurance claims processing needs of your customer(s) who have been affected by the catastrophe. The catastrophe must be a declared catastrophe by the Property Claims Services. A 500 Deductible for each “claim” shall apply to each “claim” made under this paragraph. Limits provided by this paragraph are part of and not in addition to the limits provided by this “policy.” IIAA CAT Webinar Property & Business Interruption Visit the Big “I” Risk Management Website at www.iiaba.net/eohappens.
Corporate Solutions Questions Please send questions to: – Nathaniel Bunck at Nathaniel [email protected] – Jim Redeker at James [email protected] – Max Cohen at [email protected] – David Hulcher at [email protected] For technical coverage questions, Big “I” Virtual University Experts stand ready to assist at: http://www.iiaba.net/VU/Experts/ExpertsMain.htm IIAA CAT Webinar Property & Business Interruption Visit the Big “I” Risk Management Website at www.iiaba.net/eohappens.
Corporate Solutions Thank you! IIAA CAT Webinar Property & Business Interruption
Corporate Solutions Legal notice 2011 Swiss Re and IIABA. All rights reserved. You are not permitted to create any modifications or derivatives of this presentation or to use it for commercial or other public purposes without the prior written permission of Swiss Re and IIABA. Although all the information used was taken from reliable sources, Swiss Re and IIABA does not accept any responsibility for the accuracy or comprehensiveness of the details given. All liability for the accuracy and completeness thereof or for any damage resulting from the use of the information contained in this presentation is expressly excluded. Under no circumstances shall Swiss Re or its Group companies and IIABA be liable for any financial and/or consequential loss relating to this presentation. IIAA CAT Webinar Property & Business Interruption 76