Benchmarking Network Quality Network Performance Score methodology


25 Slides539.75 KB
Benchmarking Network Quality Network Performance Score methodology ı 22 May 2019 ı Zoran Asenov ı Netra Ltd. (R&S partner)
Excellent Network Performance – expected everywhere ı Subscriber‘s satisfaction is key - The perceived technical performance of a network depends on the satisfaction of the users with the quality and the availability of telecommunication services. ı Measurements and scoring must reflect QoE - The score considers and weights the main KPIs for a wide range of services that are essential and exemplary for the service quality and combines them into an overall performance score.
Benchmarking Mobile Networks ı The ultimate goal of “Benchmarking” is, to figure out which network performs best, which region or market or also how are the individual technologies score to each other. ı It is rather easy to compare performance on individual KPI levels (Drop Rate, Call Setup Time, single file download speed, ). One problem though is, that there are many KPIs to compare and therefore to optimize. At which KPI the most benefit for the end users can be reached? Another challenge starts, when operators aim to ultimately have “the best network”, for the simple reason: there was no commonly agreed standard or methodology which defines what “the best network” is! Network Quality Benchmarking 3
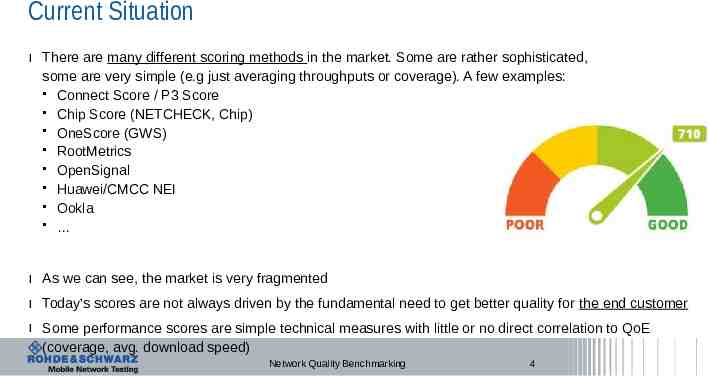
Current Situation ı There are many different scoring methods in the market. Some are rather sophisticated, some are very simple (e.g just averaging throughputs or coverage). A few examples: Connect Score / P3 Score Chip Score (NETCHECK, Chip) OneScore (GWS) RootMetrics OpenSignal Huawei/CMCC NEI Ookla ı As we can see, the market is very fragmented ı Today’s scores are not always driven by the fundamental need to get better quality for the end customer ı Some performance scores are simple technical measures with little or no direct correlation to QoE (coverage, avg. download speed) Network Quality Benchmarking 4
Motivation ı We as R&S MNT have not contributed to the network score activities so far. Our focus was rather on the KPI levels (Application Layer and all layers below). ı We are recognized as the player in the market who drives the standardization (e.g P.863 POLQA, J.343.1 and J.341 for Video-MOS) within standardization bodies such as ETSI, Video Quality Experts Group (VQEG) and ITU-T. ı We started to have discussions with many players (operators, regulators, infrastructure vendors, competitors, service companies) and realized, that it is a common interest to have a common method and the time is now. ı Therefore, we started the dialog with ETSI STQ, collected ideas and contributions, with the goal to come up with an ETSI document describes a open and public methodology ı We as R&S are a considered as neutral party that allows us the moderation of this activity Network Quality Benchmarking 5
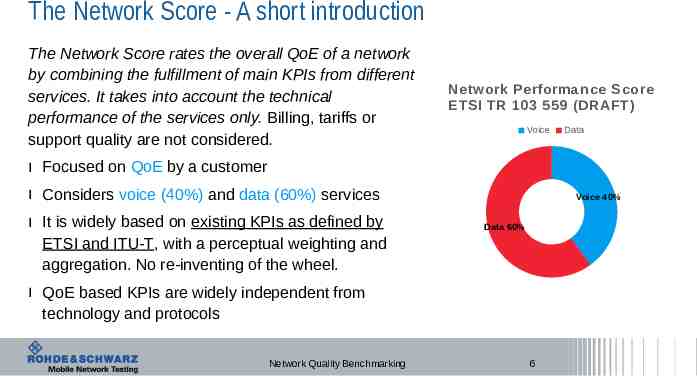
The Network Score - A short introduction The Network Score rates the overall QoE of a network by combining the fulfillment of main KPIs from different services. It takes into account the technical performance of the services only. Billing, tariffs or support quality are not considered. Network Performance Score ETSI TR 103 559 (DRAFT) Voice Data ı Focused on QoE by a customer ı Considers voice (40%) and data (60%) services ı It is widely based on existing KPIs as defined by ETSI and ITU-T, with a perceptual weighting and aggregation. No re-inventing of the wheel. Voice 40% Data 60% ı QoE based KPIs are widely independent from technology and protocols Network Quality Benchmarking 6
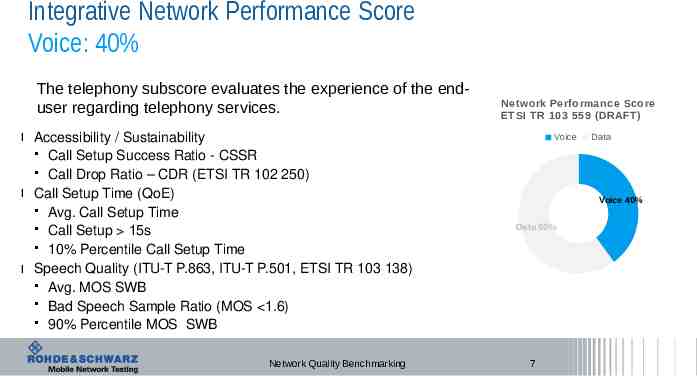
Integrative Network Performance Score Voice: 40% The telephony subscore evaluates the experience of the enduser regarding telephony services. ı Accessibility / Sustainability Call Setup Success Ratio - CSSR Call Drop Ratio – CDR (ETSI TR 102 250) ı Call Setup Time (QoE) Avg. Call Setup Time Call Setup 15s 10% Percentile Call Setup Time ı Speech Quality (ITU-T P.863, ITU-T P.501, ETSI TR 103 138) Avg. MOS SWB Bad Speech Sample Ratio (MOS 1.6) 90% Percentile MOS SWB Network Quality Benchmarking Network Performance Score ETSI TR 103 559 (DRAFT) Voice Data Voice 40% Data 60% 7
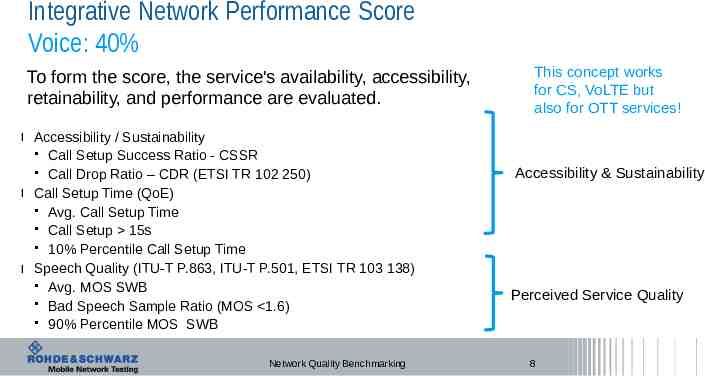
Integrative Network Performance Score Voice: 40% To form the score, the service's availability, accessibility, retainability, and performance are evaluated. ı Accessibility / Sustainability Call Setup Success Ratio - CSSR Call Drop Ratio – CDR (ETSI TR 102 250) ı Call Setup Time (QoE) Avg. Call Setup Time Call Setup 15s 10% Percentile Call Setup Time ı Speech Quality (ITU-T P.863, ITU-T P.501, ETSI TR 103 138) Avg. MOS SWB Bad Speech Sample Ratio (MOS 1.6) 90% Percentile MOS SWB Network Quality Benchmarking This concept works for CS, VoLTE but also for OTT services! Accessibility & Sustainability Perceived Service Quality 8
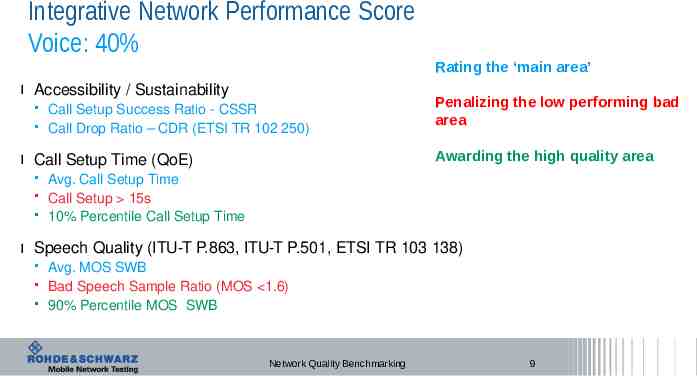
Integrative Network Performance Score Voice: 40% Rating the ‘main area’ ı Accessibility / Sustainability Call Setup Success Ratio - CSSR Call Drop Ratio – CDR (ETSI TR 102 250) Awarding the high quality area ı Call Setup Time (QoE) Penalizing the low performing bad area Avg. Call Setup Time Call Setup 15s 10% Percentile Call Setup Time ı Speech Quality (ITU-T P.863, ITU-T P.501, ETSI TR 103 138) Avg. MOS SWB Bad Speech Sample Ratio (MOS 1.6) 90% Percentile MOS SWB Network Quality Benchmarking 9
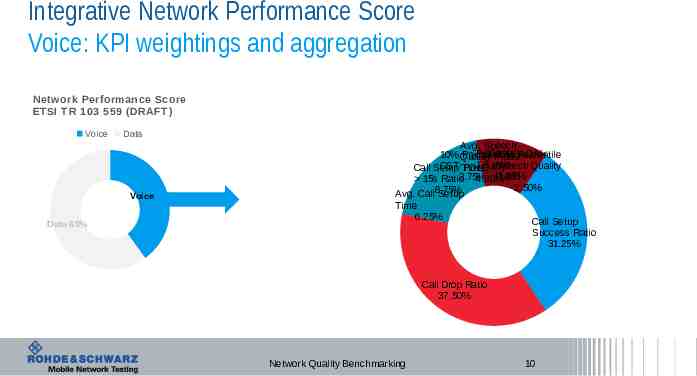
Integrative Network Performance Score Voice: KPI weightings and aggregation Network Performance Score ETSI TR 103 559 (DRAFT) Voice Data Voice 40% Data 60% Avg. Speech P.863 ‘POLQA’ 10% Quality Percentile 90% Percentile P.863 1.6 ratio CST ‘POLQA’ Speech Quality Call Setup Time 5.63% 3.75% P.863 15s Ratio 4.38% 2.50% Avg. Call8.75% Setup Time 6.25% Call Setup Success Ratio 31.25% Call Drop Ratio 37.50% Network Quality Benchmarking 10
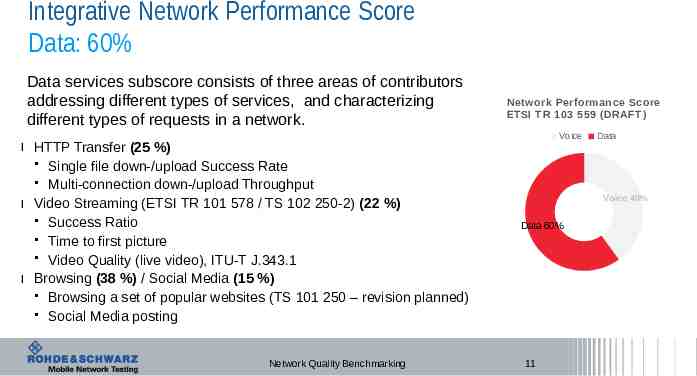
Integrative Network Performance Score Data: 60% Data services subscore consists of three areas of contributors addressing different types of services, and characterizing different types of requests in a network. ı HTTP Transfer (25 %) Single file down-/upload Success Rate Multi-connection down-/upload Throughput ı Video Streaming (ETSI TR 101 578 / TS 102 250-2) (22 %) Success Ratio Time to first picture Video Quality (live video), ITU-T J.343.1 ı Browsing (38 %) / Social Media (15 %) Browsing a set of popular websites (TS 101 250 – revision planned) Social Media posting Network Quality Benchmarking Network Performance Score ETSI TR 103 559 (DRAFT) Voice Data Voice 40% Data 60% 11
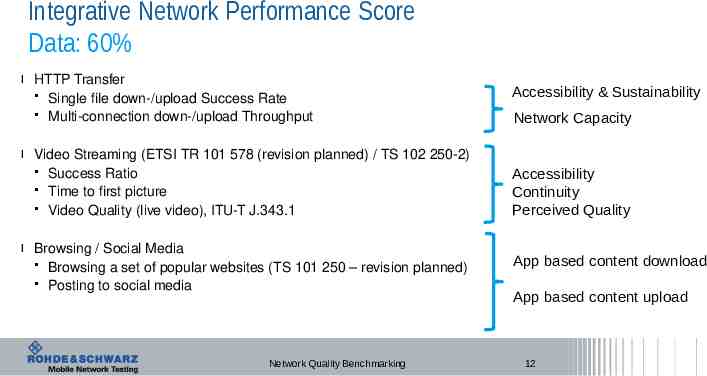
Integrative Network Performance Score Data: 60% ı HTTP Transfer Single file down-/upload Success Rate Multi-connection down-/upload Throughput ı Video Streaming (ETSI TR 101 578 (revision planned) / TS 102 250-2) Success Ratio Time to first picture Video Quality (live video), ITU-T J.343.1 ı Browsing / Social Media Browsing a set of popular websites (TS 101 250 – revision planned) Posting to social media Network Quality Benchmarking Accessibility & Sustainability Network Capacity Accessibility Continuity Perceived Quality App based content download App based content upload 12
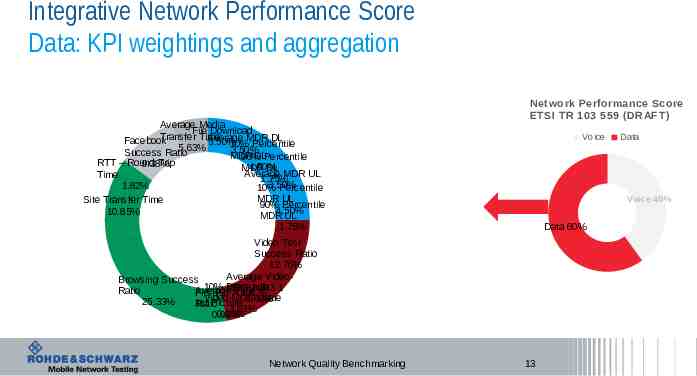
Integrative Network Performance Score Data: KPI weightings and aggregation Average Media File Download Transfer Time Average MDR DL Facebook 5.50% 10% Percentile 5.63% 3.50% Success Ratio MDR DLPercentile 90% RTT – Round Trip 9.38% 4.50% MDR DL Average MDR UL Time 1.75% 3.50% 1.82% 10% Percentile MDR UL Site Transfer Time 90% Percentile 4.50% 10.85% MDR UL 1.75% Network Performance Score ETSI TR 103 559 (DRAFT) Voice Voice 40% Data 60% Video Test Success Ratio 12.76% Average VideoBrowsing Success 10% Percentile Ratio Average to FirstPicMOS Time 10sJ.343.1 Video-MOS Value 25.33% 1st Picture 3.63% Ratio 3.63% 0.98% 0.98% Network Quality Benchmarking Data 13
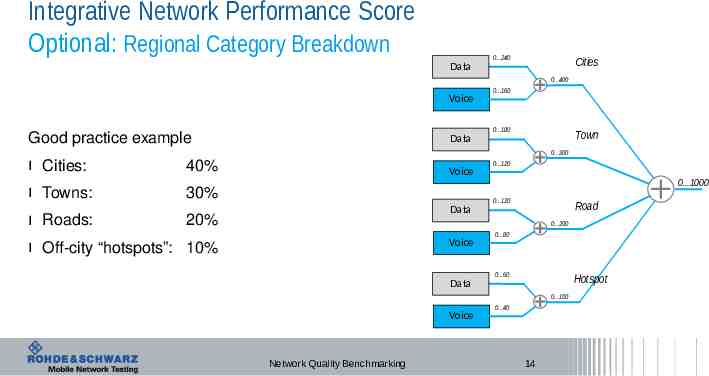
Integrative Network Performance Score Optional: Regional Category Breakdown 0.240 Cities Data 0.400 Voice 0.180 Good practice example Town Data 0.300 ı Cities: 40% ı Towns: 30% ı Roads: 0.160 Voice 0.120 0.1000 0.120 Road Data 20% 0.200 ı Off-city “hotspots”: 10% Voice 0.80 0.60 Hotspot Data 0.100 Voice Network Quality Benchmarking 0.40 14
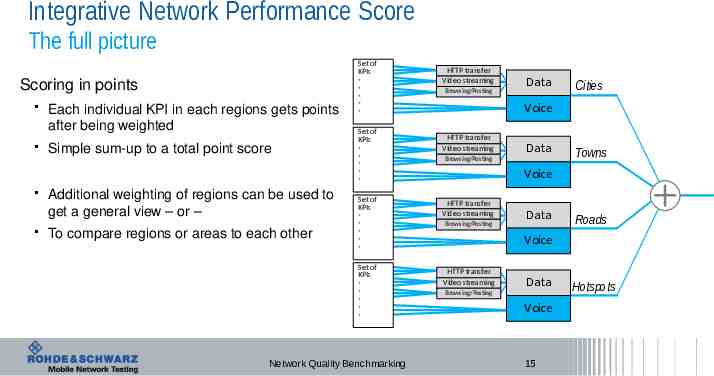
Integrative Network Performance Score The full picture Scoring in points Each individual KPI in each regions gets points after being weighted Simple sum-up to a total point score Additional weighting of regions can be used to get a general view – or – To compare regions or areas to each other Set of KPIs Set of KPIs Set of KPIs Set of KPIs - Network Quality Benchmarking HTTP transfer Vid eo streaming Browsing/Posting Data Cities Voice HTTP transfer Vid eo streaming Data Browsing/Posting Towns Voice HTTP transfer Vid eo streaming Browsing/Posting Data Roads Voice HTTP transfer Video streaming Data Browsing/Posting Voice 15 Hotspots
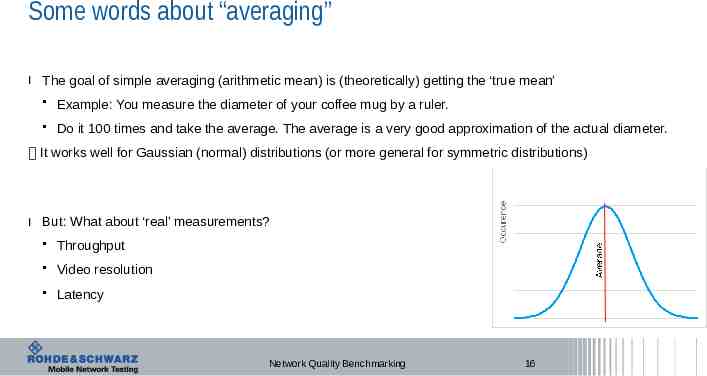
Some words about “averaging” ı The goal of simple averaging (arithmetic mean) is (theoretically) getting the ‘true mean’ Example: You measure the diameter of your coffee mug by a ruler. Do it 100 times and take the average. The average is a very good approximation of the actual diameter. It works well for Gaussian (normal) distributions (or more general for symmetric distributions) ı But: What about ‘real’ measurements? Throughput Video resolution Latency Network Quality Benchmarking 16
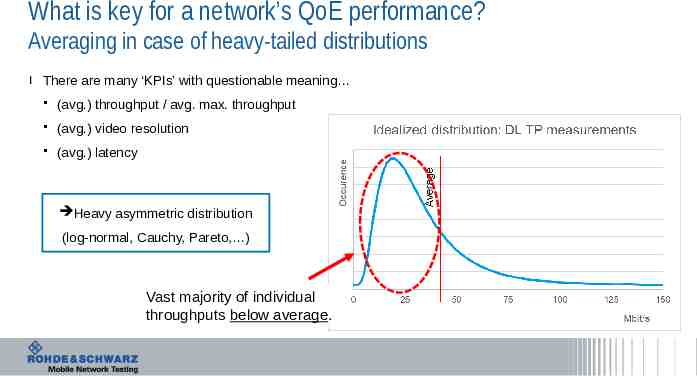
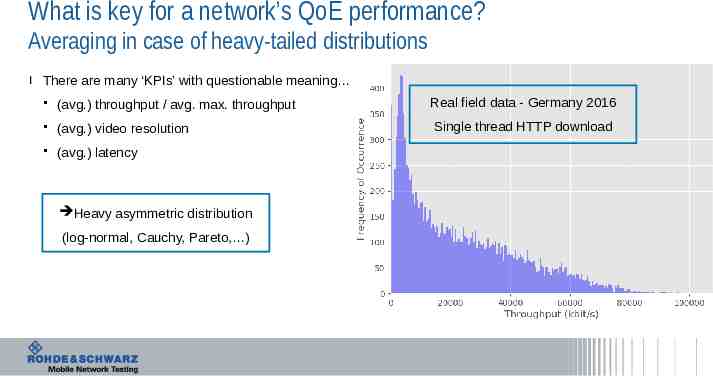
What is key for a network’s QoE performance? Averaging in case of heavy-tailed distributions ı There are many ‘KPIs’ with questionable meaning (avg.) throughput / avg. max. throughput (avg.) video resolution (avg.) latency Heavy asymmetric distribution (log-normal, Cauchy, Pareto, ) Vast majority of individual throughputs below average.
What is key for a network’s QoE performance? Averaging in case of heavy-tailed distributions ı There are many ‘KPIs’ with questionable meaning (avg.) throughput / avg. max. throughput Real field data - Germany 2016 (avg.) video resolution Single thread HTTP download (avg.) latency Heavy asymmetric distribution (log-normal, Cauchy, Pareto, )
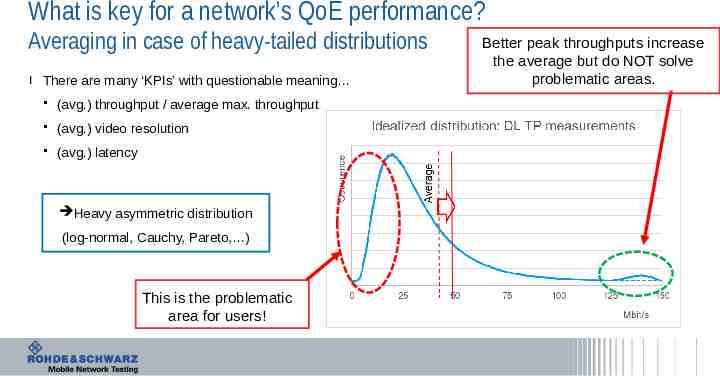
What is key for a network’s QoE performance? Averaging in case of heavy-tailed distributions ı There are many ‘KPIs’ with questionable meaning (avg.) throughput / average max. throughput (avg.) video resolution (avg.) latency Heavy asymmetric distribution (log-normal, Cauchy, Pareto, ) This is the problematic area for users! Better peak throughputs increase the average but do NOT solve problematic areas.
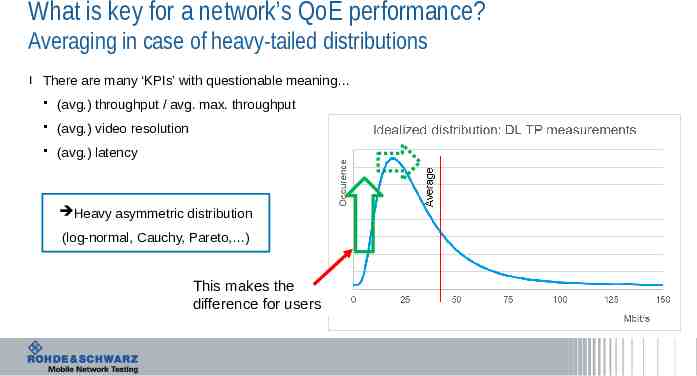
What is key for a network’s QoE performance? Averaging in case of heavy-tailed distributions ı There are many ‘KPIs’ with questionable meaning (avg.) throughput / avg. max. throughput (avg.) video resolution (avg.) latency Heavy asymmetric distribution (log-normal, Cauchy, Pareto, ) This makes the difference for users
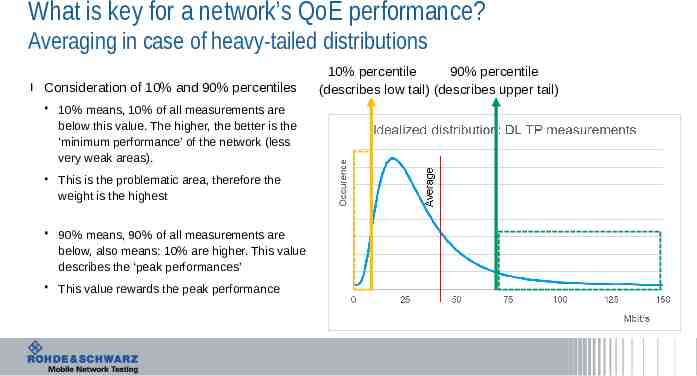
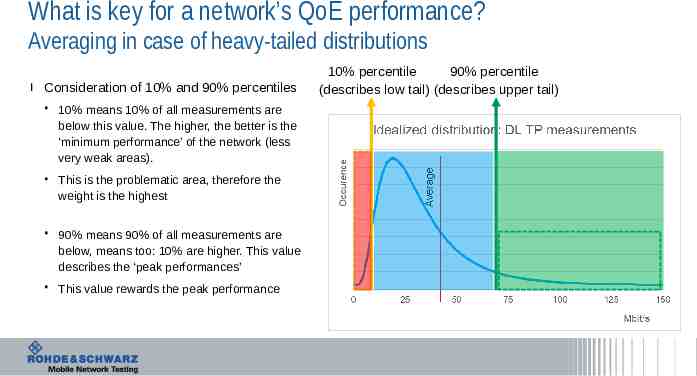
What is key for a network’s QoE performance? Averaging in case of heavy-tailed distributions ı Consideration of 10% and 90% percentiles 10% means, 10% of all measurements are below this value. The higher, the better is the ‘minimum performance’ of the network (less very weak areas). This is the problematic area, therefore the weight is the highest 90% means, 90% of all measurements are below, also means: 10% are higher. This value describes the ‘peak performances’ This value rewards the peak performance 10% percentile 90% percentile (describes low tail) (describes upper tail)
What is key for a network’s QoE performance? Averaging in case of heavy-tailed distributions ı Consideration of 10% and 90% percentiles 10% means 10% of all measurements are below this value. The higher, the better is the ‘minimum performance’ of the network (less very weak areas). This is the problematic area, therefore the weight is the highest 90% means 90% of all measurements are below, means too: 10% are higher. This value describes the ‘peak performances’ This value rewards the peak performance 10% percentile 90% percentile (describes low tail) (describes upper tail)
Summary ı The ETSI TR 103 559 (DRAFT) methodology will be the new standard to calculate Network Performance Scores for the following reason: It has a wide support from the industry (operators, infrastructure vendors, regulators, ) The industry is tired to have so many different scores and is waiting for a standard Several companies already consider to give up on their “own definition” and move to the ETSI methodology The description and calculation of the score is 100% transparent The methodology is very focused on QoE, but it is builds (wherever possible) on existing standards from ETSI and ITU-T. If and where needed, modifications of existing standards are considered. Network Quality Benchmarking 23
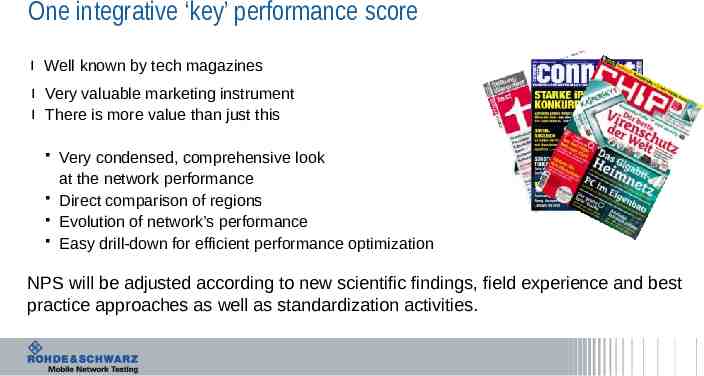
One integrative ‘key’ performance score ı Well known by tech magazines ı Very valuable marketing instrument ı There is more value than just this Very condensed, comprehensive look at the network performance Direct comparison of regions Evolution of network’s performance Easy drill-down for efficient performance optimization NPS will be adjusted according to new scientific findings, field experience and best practice approaches as well as standardization activities.
Thank you! Network Quality Benchmarking 25