Applying Lean Principles for Revenue Cycle Improvements Debbie Gray,


29 Slides4.22 MB
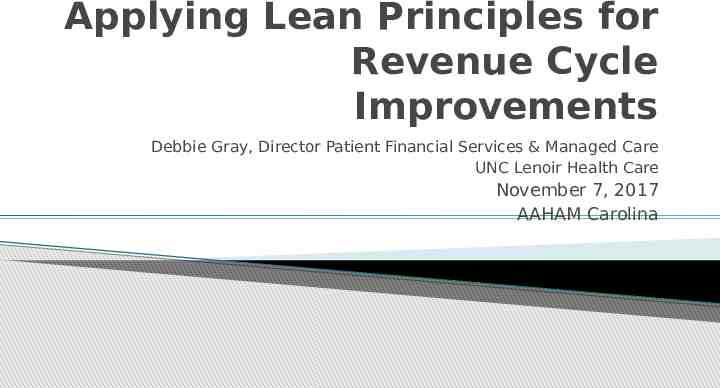
Applying Lean Principles for Revenue Cycle Improvements Debbie Gray, Director Patient Financial Services & Managed Care UNC Lenoir Health Care November 7, 2017 AAHAM Carolina
UNC Lenoir Health Care Kinston, NC
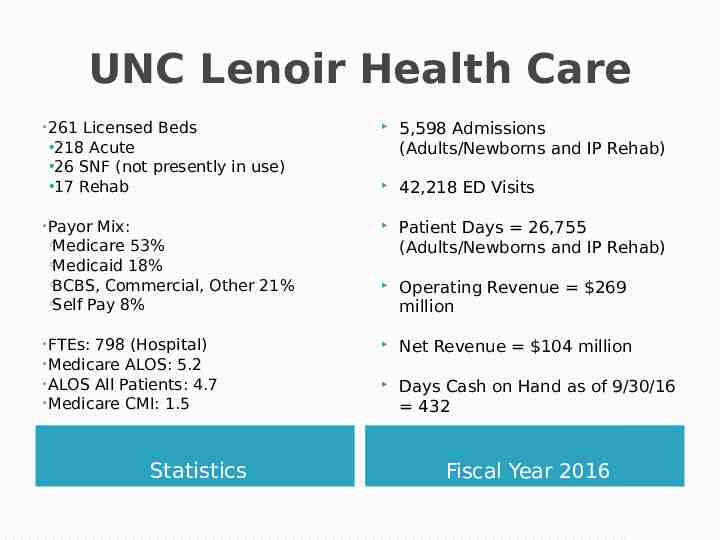
UNC Lenoir Health Care 261 Licensed Beds 218 Acute 26 SNF (not presently in use) 17 Rehab Payor Mix: Medicare 53% Medicaid 18% BCBS, Commercial, Other 21% Self Pay 8% FTEs: 798 (Hospital) Medicare ALOS: 5.2 ALOS All Patients: 4.7 Medicare CMI: 1.5 Statistics 5,598 Admissions (Adults/Newborns and IP Rehab) 42,218 ED Visits Patient Days 26,755 (Adults/Newborns and IP Rehab) Operating Revenue 269 million Net Revenue 104 million Days Cash on Hand as of 9/30/16 432 Fiscal Year 2016
Demographics Lenoir County Lenoir County is designated Tier 1 (most distressed) by NC Department of Commerce for 2016. County Tiers are calculated using four factors: Average unemployment rate Median household income Percentage growth in population Adjusted property tax base per capita Source: North Carolina Department of Commerce Kinsto n Lenoir County North Carolina Population Change, 2000 – 2015 -9.7% -2.5% 24.8% Percent Below Poverty Level, 2014 32.8% 23.7% 17.2% Median Household Income, 2014 28,608 35,687 46,693 Children Under 18 in Poverty, 2014 55.1% 37.7% 25% Source: US Census Bureau; American Community Survey 2010-2014; AdvanceED Executive Summary for Lenoir County Schools 2015
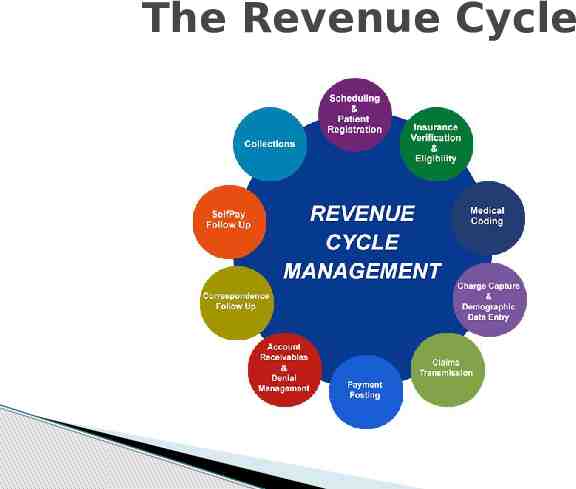
The Revenue Cycle
The Revenue Cycle Characteristics of an Effective and Efficient Revenue Cycle: 1. Dedicated and well-trained staff 2. Shared accountability between the front end (Registration) and back end (Billing) 3. Consistent, well-documented and properly communicated policies, procedures and performance expectations. 4. Effective management reporting around relevant performance metrics.
Lean Originated in the automobile industry in Japan to improve manufacturing processes. A method of streamlining a process, resulting in increased revenue, reduced costs and improved customer satisfaction. Lean is achieved by removing “waste” from a process, synchronizing work flows, and managing variability.
Alphabet Soup TPOC – VSA – RIE – What!?!? TPOC – Transformation Plan of Care (Organizational Level) VSA – Value Stream Analysis (Area of Focus) RIE – Rapid Improvement Event (Process Level) Projects, Just Do-its, and Stop-its along the way
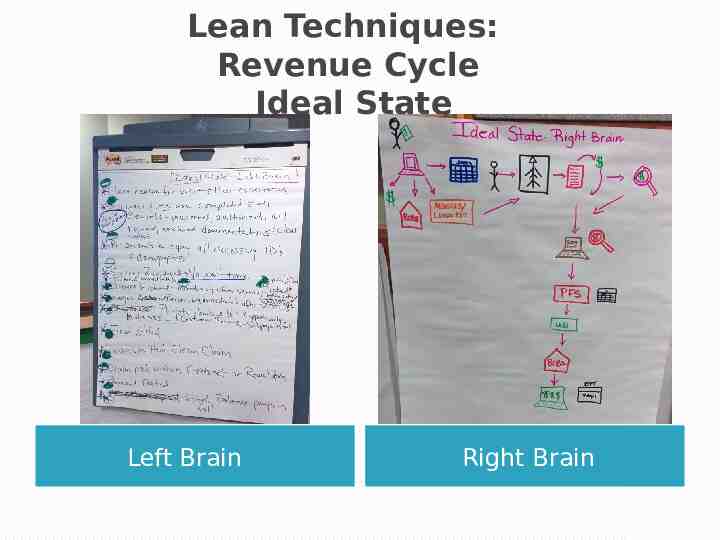
Lean Techniques: Revenue Cycle Ideal State Left Brain Right Brain
Lean Techniques: RCVSA Current State Map Pink Waste
Lean Techniques: RCVSA Future State
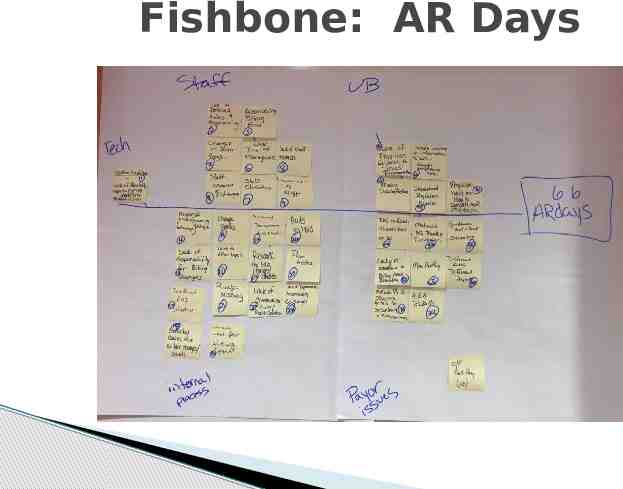
Fishbone: AR Days
Lean Techniques: PFS Project Gaps No. GAPS 1 Accounts on tracing reports are not worked consistently 2 Reports not updated according to schedule 4 Unclear documentation on accounts 5 Balance moved prematurely 6 Timely response from outside departments not consistent 7 One to one communication not utilized 8 Inconsistencies in appropriate research completed prior to referral 9 Delay tactics / conflicting information received by insurers 10 Inaccurate patient information on accounts Root Cause No consistent standard work established for tracing reports; Lack of technical skills; no clear prioritization of other duties Dedicated staff not in place to update reports / Restricted access to report capabilities Use of insurer specific jargon, typing errors in comments; lack of awareness of comment contents No consistent guidelines established for billing patient or other responsible insurer (i.e. information requested from pt, nursing home / Medicare billing questions); number of receipts results in automatic balance transfer in Meditech No organizational expectation / accountability for responses; Insufficient information provided to referred department; Lack of secondary contact person list Contact person for specific issue not identified; Appropriate party for issues not always known; "blast" emails sent to multiple people Resources not known; staff empowered / expectation set for individual research; appropriate presentation of background information not consistently provided to referral No established policy on when to escalate account; utilization of appropriate scripting; availability of contractual information Patient provides incorrect information; registration errors, Meditech information flow
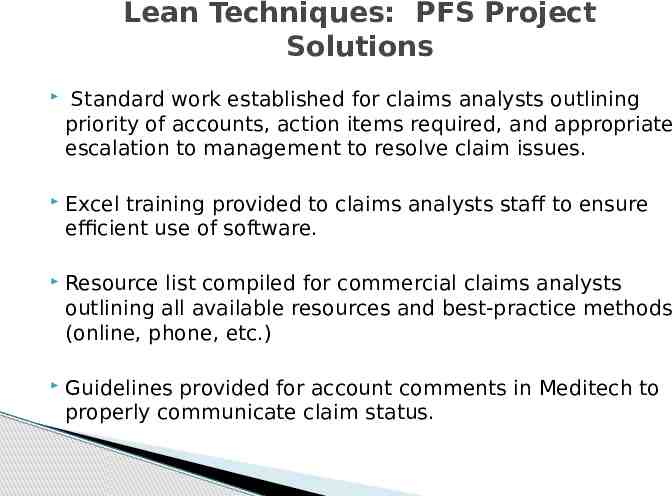
Lean Techniques: PFS Project Solutions Standard work established for claims analysts outlining priority of accounts, action items required, and appropriate escalation to management to resolve claim issues. Excel training provided to claims analysts staff to ensure efficient use of software. Resource list compiled for commercial claims analysts outlining all available resources and best-practice methods (online, phone, etc.) Guidelines provided for account comments in Meditech to properly communicate claim status.
Lean Techniques: PFS Project Solutions Developed cross-train matrix to ensure consistent, efficient completion of departmental duties. Standard work established for COB coordination. Created process for obtaining requested information from patients when requested by insurer. Developed goals for accounts with credit balances.
Key Performance Indicators AR Days 75.00 70.00 AR Days 65.00 60.00 55.00 Trigger indicator Initial State 64.65 50.00 45.00 14 14 14 14 14 14 15 15 15 15 15 15 16 16 16 16 16 16 17 17 17 20 r 20 20 l 20 20 20 20 r 20 20 l 20 20 20 20 r 20 20 l 20 20 20 20 r 20 20 n p v n p v n y y y p v n y Ja Ma Ma Ju Se No Ja Ma Ma Ju Se No Ja Ma Ma Ju Se No Ja Ma Ma Target - 53
Accounts Receivable Days AR Days 65.00 AR Days Trigger indicator Initial State - 64.65 60.00 Target - 53 55.00 50.00 45.00 5 5 5 6 6 6 6 6 7 4 4 5 5 6 7 7 7 5 01 201 201 201 201 201 201 201 201 201 201 201 201 201 201 201 201 201 2 r r r g n g n n g ct ct ct ec Feb Ap ec Feb Ap ec Feb Ap Ju Ju Ju O O O D Au D Au D Au September 2017 Gross AR Days at 49.2
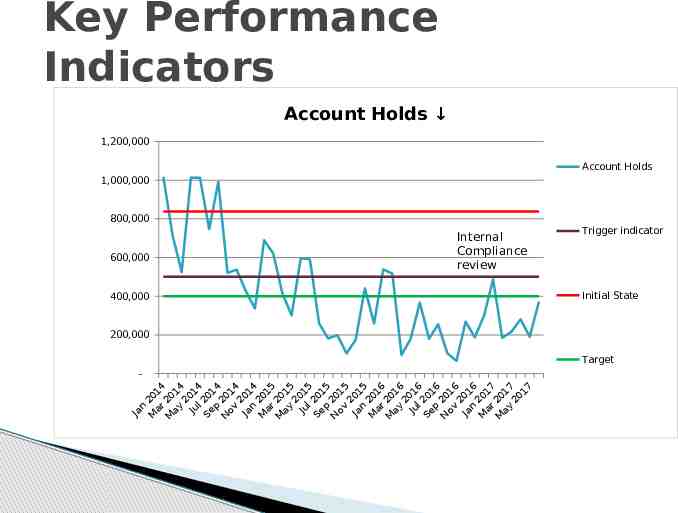
Key Performance Indicators Account Holds 1,200,000 Account Holds 1,000,000 800,000 600,000 Internal Compliance review 400,000 Trigger indicator Initial State 200,000 Target 14 14 14 14 14 14 15 15 15 15 15 15 16 16 16 16 16 16 17 17 17 20 r 20 20 l 20 20 20 20 r 20 20 l 20 20 20 20 r 20 20 l 20 20 20 20 r 20 20 n y p v n y p v n y p v n y Ja Ma Ma Ju Se No Ja Ma Ma Ju Se No Ja Ma Ma Ju Se No Ja Ma Ma
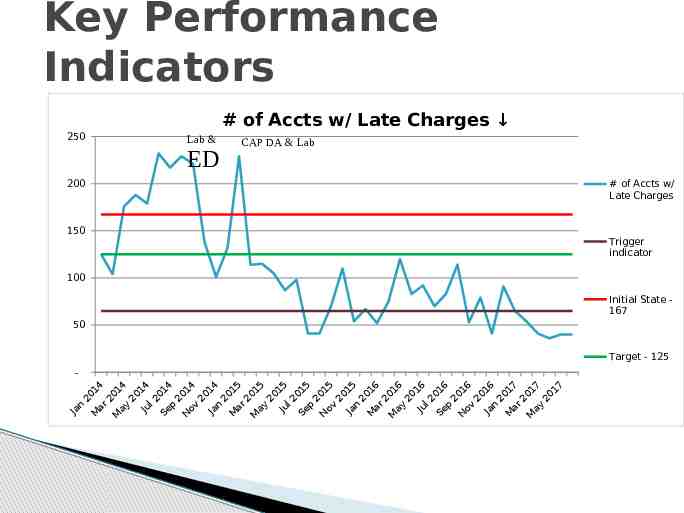
Key Performance Indicators # of Accts w/ Late Charges 250 Lab & ED CAP DA & Lab 200 150 # of Accts w/ Late Charges Trigger indicator 100 Initial State 167 50 Target - 125 14 14 14 14 14 14 15 15 15 15 15 15 16 16 16 16 16 16 17 17 17 20 r 20 20 l 20 20 20 20 r 20 20 l 20 20 20 20 r 20 20 l 20 20 20 20 r 20 20 n y Ju p v an a ay Ju Sep ov Jan Ma ay Ju Sep ov Jan Ma ay Ja Ma Ma J Se No M N N M M M
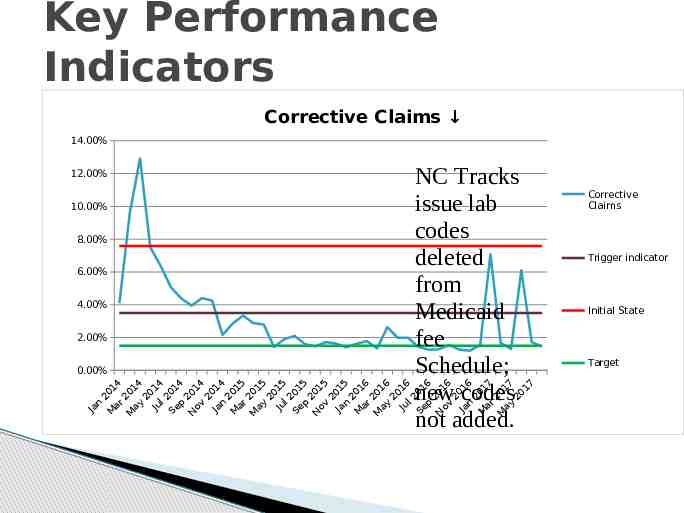
Key Performance Indicators Corrective Claims 14.00% NC Tracks 10.00% issue lab codes 8.00% deleted 6.00% from 4.00% Medicaid 2.00% fee Schedule; 0.00% 4 5 6 4 4 4 4 5 5 5 5 6 4 5 6 1 1 1 1 1 1 1 1 1 1 1 1 016 016 016 017 017 017 1 1 1 20 r 20 20 l 20 20 20 20 r 20 20 l 20 20 20 20 r 20 20 l 2new 2 2 2 2 codes 2 n a ay Ju ep ov an a ay Ju ep ov an a ay Ju ep ov an ar ay a J J J J M M S M M S M M S N M M N N not added. 12.00% Corrective Claims Trigger indicator Initial State Target
Key Performance Indicators Commercial Claim Denials *Post Oct-15, excluded BCBS 25.00% 835 Denials BC/MCE/MCD 8.00% Medicaid taxonomy codes & NPI changes 7.00% 20.00% VA modifier 25 & Incomplete MR’s Comme rcial Claim Denials 5.00% 15.00% Trigger Indicato r - 10% 10.00% 5.00% 0.00% 6.00% 4.00% 3.00% Initial State 7.28% Target 8% Trigger indicat or 2.00% 1.00% 0.00% 5 5 6 6 6 6 6 6 7 7 7 7 01 201 201 201 201 201 201 201 201 201 201 201 2 r n g ct c b r n g ct c b O De Fe Ap Ju Au O De Fe Ap Ju Au Excludes BCBS Denials 835 Denials Includes BCBS Denials Initial State Target
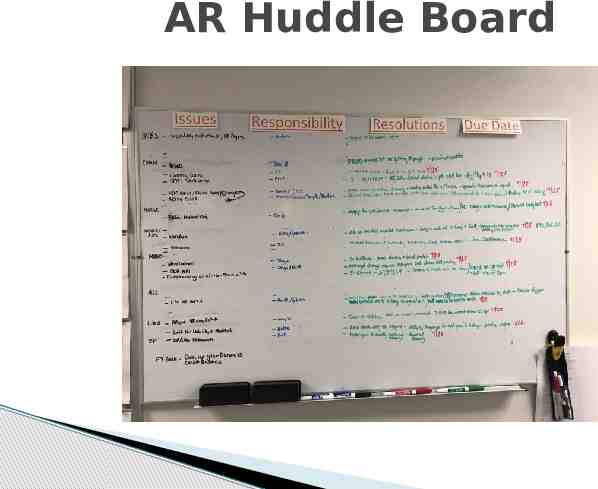
Sustainment Improve Communication Weekly Accounts Receivable (AR) Huddles Monthly Metrics review at Revenue Cycle Meetings Transparency KPI Dashboard-Push data monthly to Senior Leadership Accountability Develop trigger points and countermeasures for metrics
AR Huddle Board
AR Huddle Graphs
Denials Management Metrics
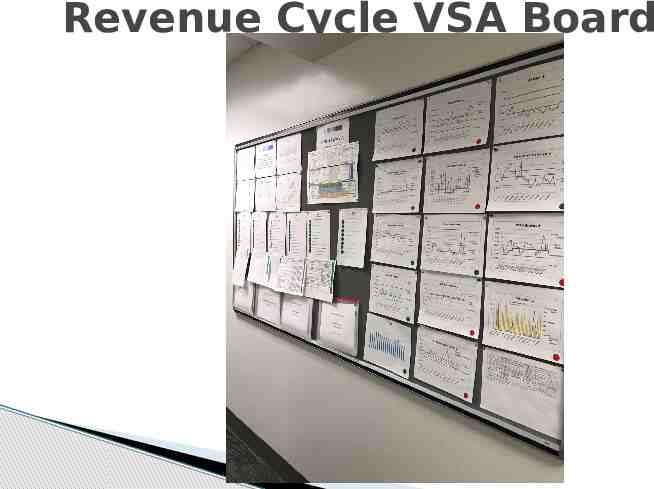
Revenue Cycle VSA Board
Key Performance Indicators
Results Red vs. Green AR AGING 2014 AR AGING 2017
Questions/Comments