An Overview of British Columbia


22 Slides3.45 MB
An Overview of British Columbia
In this presentation: i. Basic Information ii. Demographics iii. Cost of Living iv. Economy v. Tourism
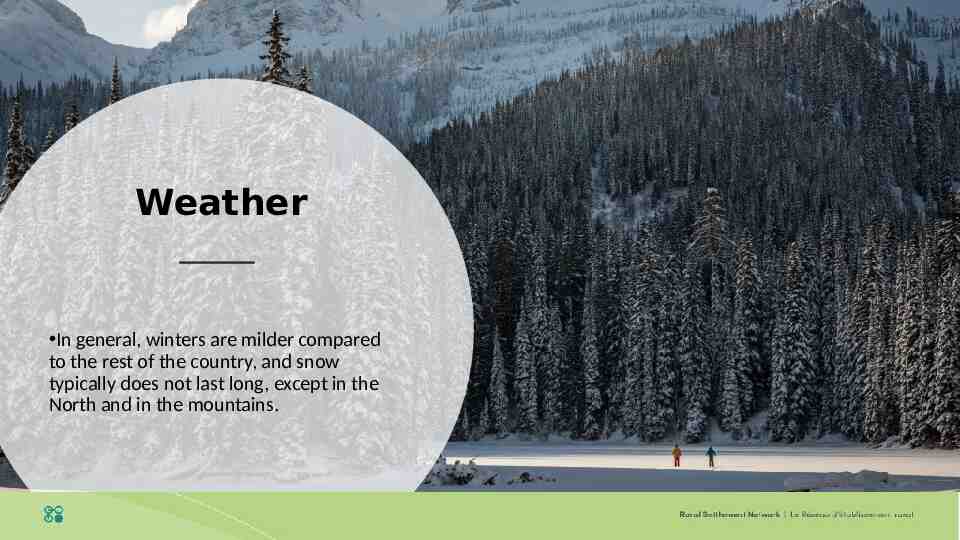
Weather In general, winters are milder compared to the rest of the country, and snow typically does not last long, except in the North and in the mountains.
Demographics
Province or territory Newfoundland-and-Labrador French-speaking population 2,428 (0.5%) English-speaking population 512,523 (99.4%) Bilingual population (English and French) 25,940 (5%) Prince Edward Island 4,665 (3.3%) 135,130 (95.8%) 17,840 (12.7%) Nova Scotia 29,368 (3.2%) 880,348 (96.5%) 95,380 (10.5%) New Brunswick 234,055 (31.8%) 499,970 (67.9%) 249,955 (33.9%) Quebec 6,890,305 (85.4%) 1,103,475 (13.7%) 3,586,410 (44.5%) Ontario 550,595 (4.1%) 12,440,795 (93.4%) 1,490,395 (11.2%) Manitoba 40,978 (3.2%) 1,204,798 (95.5%) 108,455 (8.6%) Saskatchewan 14,440 (1.3%) 1,061,110 (98%) 51,360 (4.7%) Alberta 79,838 (2%) 3,888,983 (96.6%) 264,715 (6.6%) British Columbia 64,323 (1.4%) 4,382,328 (95.3%) 314,925 (6.8%) Yukon 1,635 (4.6%) 33,785 (95%) 4,900 (13.8%) Northwest Territories 1,240 (3%) 39,950 (96.5%) 4,275 (10.3%) Nunavut 630 (1.8%) 33,040 (92.6%) 1,525 (4.3%) Total 7,914,498 (22.8%) 26,216,233 (75.4%) 6,216,075 (17.9%)
Top 10 Immigrant Language Mother Tongues in BC Top 10 Immigrant Language Mother Tongues in BC Punjabi (Panjabi) Cantonese Mandarin Tagalog (Pilipino, Filipino) German Korean Spanish Persian (Farsi) Hindi Vietnamese Percent of immigrant languages 15.9 15 14.2 6.9 5.2 4 3.8 3.4 2.3 2.2 Percent of total population 4.7 4.4 4.2 2 1.5 1.2 1.1 1 0.7 0.6 Most Common NonOfficial Languages Vancouver Percentage of population with a mother tongue other Percentage than English of total or French population Language Number Cantonese 193,030 17.7 7.9 Mandarin 180,170 16.5 7.4 Punjabi (Panjabi) 163,400 14.9 6.7 Tagalog (Pilipino, Filipino) 78,830 7.2 3.2 Korean 47,915 4.4 2.0
Population 0 to 14 years 15 to 64 years Demographics 65 years and over Average age Median age % Years Canada 38,005,238 15.9 66.1 18.0 40.9 41.4 Newfoundland and Labrador 522,103 13.4 64.3 22.3 47.4 44.8 Prince Edward Island 159,625 15.3 64.7 20.0 42.9 42.4 Nova Scotia 979,351 14.0 64.7 21.3 45.0 43.8 New Brunswick 781,476 14.3 63.7 21.9 46.1 44.3 Quebec 8,574,571 15.8 64.5 19.7 42.7 42.6 Ontario 14,734,014 15.5 66.9 17.6 40.4 41.2 Manitoba 1,379,263 18.9 65.0 16.1 37.6 39.1 Saskatchewan 1,178,681 19.6 64.2 16.2 37.8 39.2 Alberta 4,421,876 18.6 67.6 13.8 37.5 38.5 British Columbia 5,147,712 14.0 66.9 19.2 42.2 42.6 Yukon 42,052 17.0 69.6 13.3 39.4 39.6 Northwest Territories 45,161 20.0 71.1 8.8 35.5 36.1 Nunavut 39,353 31.7 64.3 4.0 26.2 28.5
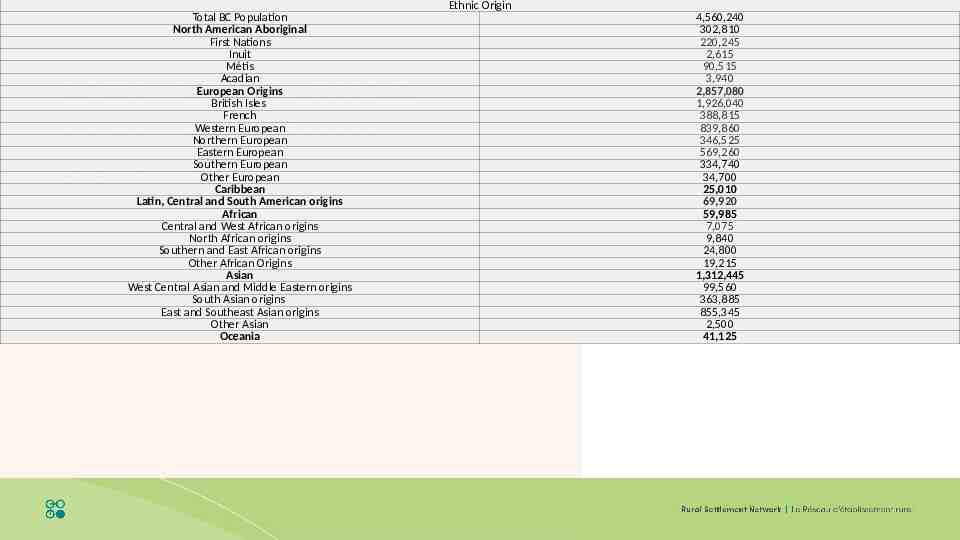
Ethnic Origin Total BC Population North American Aboriginal First Nations Inuit Métis Acadian European Origins British Isles French Western European Northern European Eastern European Southern European Other European Caribbean Latin, Central and South American origins African Central and West African origins North African origins Southern and East African origins Other African Origins Asian West Central Asian and Middle Eastern origins South Asian origins East and Southeast Asian origins Other Asian Oceania Demographics (racial/ethnic origin) 4,560,240 302,810 220,245 2,615 90,515 3,940 2,857,080 1,926,040 388,815 839,860 346,525 569,260 334,740 34,700 25,010 69,920 59,985 7,075 9,840 24,800 19,215 1,312,445 99,560 363,885 855,345 2,500 41,125
Cost of Living & Economic Sectors
Housing Province Average House Price (March, 2021) British Columbia 945,936 Ontario 890,035 Alberta 443,000 Quebec 435,516 Manitoba 338,458 Saskatchewan 278,400 Nova Scotia 362,988 Prince Edward Island 330,121 Newfoundland / Labrador 282,600 New Brunswick 253,870 Canadian Average 716,828
Housing - Rentals Location Vacancy Rates (%) Average Rent Two Bedroom ( ) British Columbia 2.4 1,515 Abbotsford CMA 0.6 1,152 Kelowna CMA 2.1 1,391 Vancouver CMA 2.6 1,792 Victoria CMA 2.2 1,507 Canada 3.2 1,077
Median After Tax 2014 2015 2016 Income 59,200 59,000 59,200 2017 2018 60,900 61,400 Newfoundland and Labrador 59,100 56,700 58,000 55,500 57,700 Prince Edward Island 53,700 54,900 53,600 54,700 57,100 Nova Scotia 51,400 50,000 51,600 51,400 52,200 New Brunswick 52,000 53,500 52,900 54,200 54,900 Quebec 50,700 50,800 51,500 52,700 53,200 Ontario 61,900 62,200 61,700 64,100 66,200 Manitoba 58,200 58,700 59,200 60,300 60,400 Saskatchewan 65,900 62,600 62,000 62,700 61,900 Alberta 75,900 75,200 72,900 71,900 72,700 British Columbia 58,100 58,700 59,000 63,500 62,000 Canada
Tourism! In 2018, the tourism industry in BC generated 20.5 billion in revenue and employed over 160,000 people.
Victoria Population 335,696 British Columbia’s capital, located on Vancouver Island “With a nod to its English heritage, British Columbia’s capital is filled with gardens and seafront parks, stately hotels and museums, bohemian eateries, and craft brewers.”
Population 2,264,823 Vancouver Top spots for exploration: Downtown’s Stanley Park, Granville Island Public Market Gastown, Chinatown
Whistl er Whistler is a resort town north of Vancouver. It is known for its ski resort, with over 2 million visitors annually.
Glacier National Park Mount Revelstoke National Park Gulf Islands National Park Reserve Pacific Rim National Park Reserve Gwaii Haanas National Park Reserve Kootenay National Park Yoho National Park
There are 12 National Historic Sites in BC, including: National Historic Sites Kicking Horse Pass “Cross the Kicking Horse Pass, the highest point on the Trans-Canada Highway, and stare down onto a spectacular mountain corridor in Yoho National Park. The legendary pass opened British Columbia to the rest of Canada by rail in the 19th century. From the Spiral Tunnels viewpoint, watch a Canadian engineering phenomenon in action as trains disappear into one Rocky Mountain tunnel and emerge from another at a different elevation on the steep slopes.” Stanley Park “Stanley Park National Historic Site of Canada is a magnificent green oasis in the midst of the heavily built urban landscape of Vancouver.” Fort Langley “See where Hudson’s Bay Company fur traders mingled with California gold prospectors and hear First Nations interpreters tell century-old tales. Feel the blast of the musket fire, pan for gold dust dreams and dress up to play a historic trading boss.”