2020 International Statistical Genetics Workshop Introduction to


45 Slides4.10 MB
2020 International Statistical Genetics Workshop Introduction to Multivariate Genetic Analysis PRACTICAL Lucía Colodro Conde, Meike Bartels, Elizabeth Prom-Wormley, and Hermine Maes with thanks to Katrina Grasby, Jose Morosoli, Sarah Medland, and Dorret Boomsma In \\workshop\Faculty\lucia\2020\Wednesday\twoACEvc practical 2traits.R
The dataset: Simulated data Children age 8 years old, 50 % females Phenotypes are scores on reading, grammar, writing, and math skills. Available both raw and scaled (mean 0, SD 1) – before restructuring the file to one row per family! Means and Variances could be equated across Twin Order and Zygosity No need of sex-limitation model Age and sex should be included as covariates We’ll analyse “Read” and “Writ”
Three Concepts 1.- What is the variance due to genetic and (shared and unique) environmental contributions for each trait? Variance Decomposition 2.- How much of the phenotypic correlation between the traits is accounted for by genetic and (shared and unique) environmental factors? Covariance Decomposition 3.- To what extent do the genetic factors underlying each trait overlap? And the (shared and unique) environmental factors? Genetic and Environmental correlations
From univariate to multivariat e assumed degree of genetic relatedness (1, 0.5)
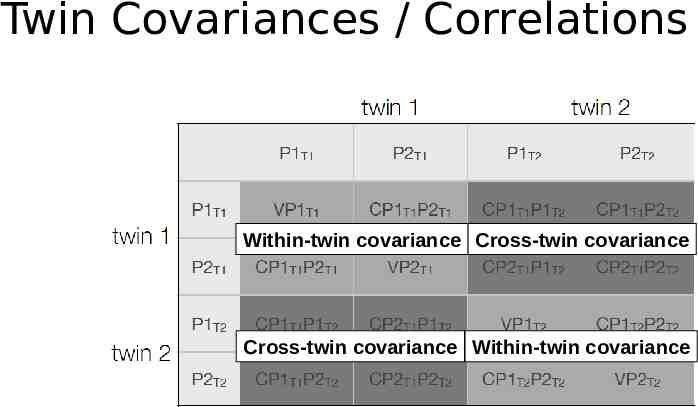
Twin Covariances / Correlations
Twin Covariances / Correlations Within-twin covariance Cross-twin covariance Cross-twin covariance Within-twin covariance
Variance/covariance matrices Correlation matrices MZ MZ Twin 1 Twin 2 Twin 1 Twin 1 Twin 2 Twin 2 DZ Twin 1 Twin 2 DZ Twin 1 Twin 1 Twin 2 Twin 2 Twin 1 Twin 2 Twin 1 Twin 2
Variance/covariance matrices Correlation matrices MZ MZ Twin 1 Twin 2 Twin 1 Twin 1 Twin 2 Twin 2 DZ Twin 1 Twin 2 DZ Twin 1 Twin 1 Twin 2 Twin 2 Twin 1 Twin 2 Twin 1 Twin 2
What are our initial expectations after looking at the covariance and correlation matrices by zygosity? MZ Twin 1 Twin 2 - Are there common etiological influences? Twin 1 Twin 2 DZ Twin 1 Twin 2 Twin 1 Twin 2
What are our initial expectations after looking at the covariance and correlation matrices by zygosity? MZ Twin 1 Twin 2 - Are there common etiological influences? Within-twin Cross-trait covariances Twin 1 Twin 2 DZ Twin 1 Twin 2 Twin 1 Twin 2
What are our initial expectations after looking at the covariance and correlation matrices by zygosity? MZ Twin 1 Twin 2 - Are there common etiological influences? Within-twin Cross-trait covariances Twin 1 - Do familial common etiological influences contribute to the covariation? Twin 2 DZ Twin 1 Twin 2 Twin 1 Twin 2
What are our initial expectations after looking at the covariance and correlation matrices by zygosity? MZ Twin 1 Twin 2 - Are there common etiological influences? Within-twin Cross-trait covariances Twin 1 - Do familial common etiological influences contribute to the covariation? Cross-twin Cross-trait covariances Twin 2 DZ Twin 1 Twin 2 Twin 1 Twin 2
What are our initial expectations after looking at the covariance and correlation matrices by zygosity? MZ Twin 1 Twin 2 - Are there common etiological influences? Within-twin Cross-trait covariances Twin 1 - Do familial common etiological influences contribute to the covariation? Cross-twin Cross-trait covariances Twin 2 DZ Twin 1 Twin 2 Twin 1 Twin 2 - Are the common etiological influences genetic and/or environmental (A and/or C)?
What are our initial expectations after looking at the covariance and correlation matrices by zygosity? MZ Twin 1 Twin 2 - Are there common etiological influences? Within-twin Cross-trait covariances Twin 1 - Do familial common etiological influences contribute to the covariation? Cross-twin Cross-trait covariances Twin 2 DZ Twin 1 Twin 2 Twin 1 Twin 2 - Are the common etiological influences genetic and/or environmental (A and/or C)? MZ/DZ ratio of Cross-twin Cross-trait covariances
What are our initial expectations after looking at the covariance and correlation matrices by zygosity? MZ Twin 1 Twin 2 - Are there common etiological influences? Within-twin Cross-trait covariances Twin 1 - Do familial common etiological influences contribute to the covariation? Cross-twin Cross-trait covariances Twin 2 DZ Twin 1 Twin 2 - Are the common etiological influences genetic and/or environmental (A and/or C)? MZ/DZ ratio of Cross-twin Cross-trait covariances Twin 1 Twin 2 - Is there evidence of covariation due to unique environment (E)?
What are our initial expectations after looking at the covariance and correlation matrices by zygosity? MZ Twin 1 Twin 2 - Are there common etiological influences? Within-twin Cross-trait covariances Twin 1 - Do familial common etiological influences contribute to the covariation? Cross-twin Cross-trait covariances Twin 2 DZ Twin 1 Twin 2 - Are the common etiological influences genetic and/or environmental (A and/or C)? MZ/DZ ratio of Cross-twin Cross-trait covariances Twin 1 Twin 2 - Is there evidence of covariation due to unique environment (E)? Ratio of cross-twin to within-twin cross-trait covariance
Variance Components covA - mxMatrix( type "Symm", nrow nv, ncol nv, free TRUE, values valDiag(svPa,nv), labels labLower("VA",nv), name "VA" ) assumed degree of genetic relatedness (1, 0.5)
Predicted MZ Twin Covariance Predicted DZ Twin Covariance
Correlations corA - mxAlgebra( expression solve(sqrt(I*VA))%&%VA, name "rA" ) rg 𝑉𝐴12 𝑉𝐴 11 𝑉 𝐴22 )
Three Important Concepts 1.- What is the variance due to genetic and environmental contributions for each trait? Variance Decomposition 2.- How much of the phenotypic correlation between the traits is accounted for by genetic and environmental factors? Covariance Decomposition 3.- To what extent do the genetic factors underlying each trait overlap? And the environmental factors? Genetic and Environmental correlations
SA Read Write SC SE
SA Read Write SC SE
Read SA SC SE 0.57 (0.44,0.70) 0.15 (0.03,0.26) 0.28 (0.24,0.32) Write To retrieve the intervals, run: fitACE - mxRun( modelACE, intervals T )
Read Write SA SC SE 0.57 (0.44,0.70) 0.26 (0.08,0.42) 0.15 (0.03,0.26) 0.23 (0.09,0.36) 0.28 (0.24,0.32) 0.52 (0.45,0.59) To retrieve the intervals, run: fitACE - mxRun( modelACE, intervals T )
Three Important Concepts 1.- What is the variance due to genetic and (shared and unique) environmental contributions for each trait? Variance Decomposition Genetic, common environmental and unique genetic factors (including measurement error) contribute to 57%, 15%, and 28% of the individual differences in read, respectively. Genetic, common environmental and unique genetic factors (including measurement error) contribute to 26%, 23%, and 52% of the individual differences in write, respectively.
Three Important Concepts 1.- What is the variance due to genetic and (shared and unique) environmental contributions for each trait? Variance Decomposition 2.- How much of the phenotypic correlation between the traits is accounted for by genetic and (shared and unique) environmental factors? Covariance Decomposition 3.- To what extent do the genetic factors underlying each trait overlap? And the (shared and unique) environmental factors? Genetic and Environmental correlations
SA12 Read-write SC12 SE12
SA12 SC12 SE12 Read-write To retrieve the intervals, run: fitACE - mxRun( modelACE, intervals T )
Read-write SA12 SC12 SE12 0.60 (0.40,0.81) 0.26 (0.08,0.42) 0.14 (0.08,0.21) To retrieve the intervals, run: fitACE - mxRun( modelACE, intervals T )
Read-write SA12 SC12 SE12 0.60 (0.40,0.81) 0.26 (0.08,0.42) 0.14 (0.08,0.21) Remember the relative importance of the covariance of A, C, and E depends on the rph. If rph is very low, a covariance of 0.60 due to genetic factors means nothing. To retrieve the intervals, run: fitACE - mxRun( modelACE, intervals T )
Three Important Concepts 2.- How much of the phenotypic correlation between the traits is accounted for by genetic and (shared and unique) environmental factors? Covariance Decomposition Genetic, common environmental and unique genetic factors contribute to 60%, 26%, and 14% of the covariance between read and write, respectively.
Three Important Concepts 1.- What is the variance due to genetic and (shared and unique) environmental contributions for each trait? Variance Decomposition 2.- How much of the phenotypic correlation between the traits is accounted for by genetic and (shared and unique) environmental factors? Covariance Decomposition 3.- To what extent do the genetic factors underlying each trait overlap? And the (shared and unique) environmental factors? Genetic and Environmental correlations
ra Read-write rc re rph
Read-write ra rc 0.85 (0.62,1) 0.75 (0.33,1) re rph 0.20 0.54 (0.11,0.29) (0.51,0.57)
Three Important Concepts 3.- To what extent do the genetic factors underlying each trait overlap? And the (shared and unique) environmental factors? Genetic and Environmental correlations The genetic and common shared environment correlations between read and write are large (ra .85 and rc .75); the unique environment correlation is low (re .20). 85%, 75%, and 20% of the genetic factors, shared environmental factors, and unique environmental factors between read and write overlap.
Correlations. Interpreting Results High ra large overlap in genetic effects on the two traits If ra 1, the two sets of genes influencing each trait overlap completely If there is a high ra , does it mean that the phenotypic correlation between the traits is largely due to genetic effects? No: The contribution to rph is a function of both h2 of the traits and ra i.e. the substantive importance of genetic effects depends on the value of the ra and the heritability of each phenotype (h2) Proportion of rph due to A: Same for rc and re h2P1 * rg * h2P2 rph
Consider write-read rph 0.54 and ra 0.85 SAread 0.58 and SAwrite 0.26 What is the contribution to phenotypic correlation attributable to additive genetic effects? h2P1 * rg * h2P2 Proportion of rph due to A: rph Same for rc and re
Consider write-read rph 0.54 and ra 0.85 SAread 0.58 and SAwrite 0.26 What is the contribution to phenotypic correlation attributable to additive genetic effects? h2P1 * rg * h2P2 Proportion of rph due to A: rph Same for rc and re Prop of rph due to A: (sqrt(0.58)*0.85*sqrt(0.26))/0.54 0.61 (61%) Prop of rph due to C: (sqrt(0.15)*0.75*sqrt(0.23))/0.54 0.22 (26%) Prop of rph due to E: (sqrt(0.28)*0.20*sqrt(0.52))/0.54 0.15 (15%)
Consider write-read rph 0.54 and ra 0.85 SAread 0.58 and SAwrite 0.26 What is the contribution to phenotypic correlation attributable to additive genetic effects? h2P1 * rg * h2P2 Proportion of rph due to A: rph Same for rc and re Prop of rph due to A: (sqrt(0.58)*0.85*sqrt(0.26))/0.54 0.61 (61%) Prop of rph due to C: (sqrt(0.15)*0.75*sqrt(0.23))/0.54 0.22 (26%) Prop of rph due to E: (sqrt(0.28)*0.20*sqrt(0.52))/0.54 0.15 (15%) Read-write SA12 SC12 SE12 0.60 (0.40,0.81) 0.26 (0.08,0.42) 0.14 (0.08,0.21)
Consider write-read rph 0.54 and ra 0.85 This only makes sense if all the covariances have the same sign SAread 0.58 and SAwrite 0.26 What is the contribution to phenotypic correlation attributable to additive genetic effects? h2P1 * rg * h2P2 Proportion of rph due to A: rph Same for rc and re Prop of rph due to A: (sqrt(0.58)*0.85*sqrt(0.26))/0.54 0.61 (61%) Prop of rph due to C: (sqrt(0.15)*0.75*sqrt(0.23))/0.54 0.22 (26%) Prop of rph due to E: (sqrt(0.28)*0.20*sqrt(0.52))/0.54 0.15 (15%) Read-write SA12 SC12 SE12 0.60 (0.40,0.81) 0.26 (0.08,0.42) 0.14 (0.08,0.21)
Consider other variables with rph 0.54 and ra 0.85 SAP1 0.10 and SAP2 0.15 What is the contribution to phenotypic correlation attributable to additive genetic effects? h2P1 * rg * h2P2 Proportion of rph due to A: rph Same for rc and re Prop of rph due to A: (sqrt(0.10)*0.85*sqrt(0.15))/0.54 0.20 (20%)
What’s the best fitting model? Check submodels
Now let’s add more variables! In \\workshop\Faculty\lucia\2020\Wednesday\twoACEvc practical 3traits.R
SA Read SC Write Math R Read Write SE Math R Read Write Math R Read Write Math R ra Read Read Write Math R Write rc Math R Read Write re Math R Read Write rph Math R Write Read Math R
SA Read SC Write Math R Read 0.58 Write 0.62 0.27 Math R 0.69 0.60 Write Read 1 Write 0.85 1 Math R 0.79 0.80 Write Math R Read 0.15 0.58 ra Read Read SE 0.24 0.22 0.22 0.31 Write 0.15 1 0.14 0.51 0.09 0.08 Math R Read Write rph Math R Write 1 1 0.98 0.86 0.27 re 1 0.74 Math R 0.28 rc Math R Read Write 1 Read Math R 1 0.19 1 0.22 0.12 1 0.54 1 0.66 0.51 1