2008 FIRMA National Conference Why You Should Know About Structured

27 Slides336.00 KB
2008 FIRMA National Conference Why You Should Know About Structured Products By : Eric Miller Managing Director Date: April 7, 2008
Contents What Are Structured Products? Section 1 Industry Trends Section 2 Current Market for Structured Products Section 3 Looking Ahead: Emerging Themes for 2008 Section 4 Challenges & Opportunities Section 5 2
What Are Structured Products?
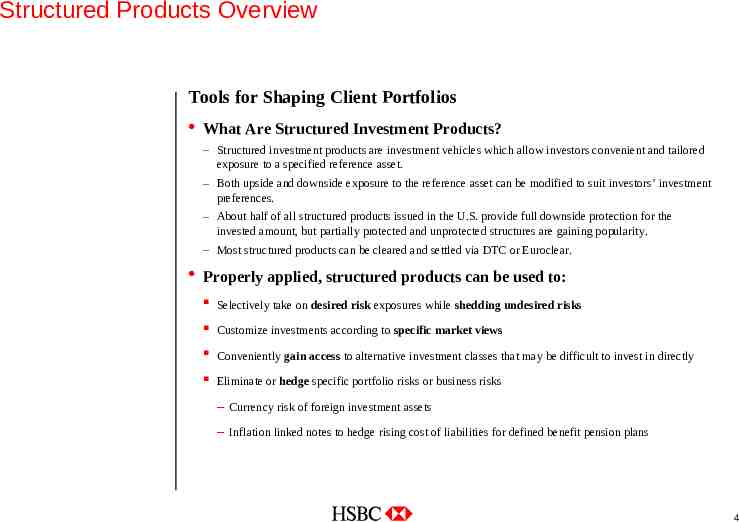
Structured Products Overview Tools for Shaping Client Portfolios What Are Structured Investment Products? – Structured investment products are investment vehicles which allow investors convenient and tailored exposure to a specified reference asset. – Both upside and downside exposure to the reference asset can be modified to suit investors’ investment preferences. – About half of all structured products issued in the U.S. provide full downside protection for the invested amount, but partially protected and unprotected structures are gaining popularity. – Most structured products can be cleared and settled via DTC or Euroclear. Properly applied, structured products can be used to: Selectively take on desired risk exposures while shedding undesired risks Customize investments according to specific market views Conveniently gain access to alternative investment classes that may be difficult to invest in directly Eliminate or hedge specific portfolio risks or business risks – Currency risk of foreign investment assets – Inflation linked notes to hedge rising cost of liabilities for defined benefit pension plans 4
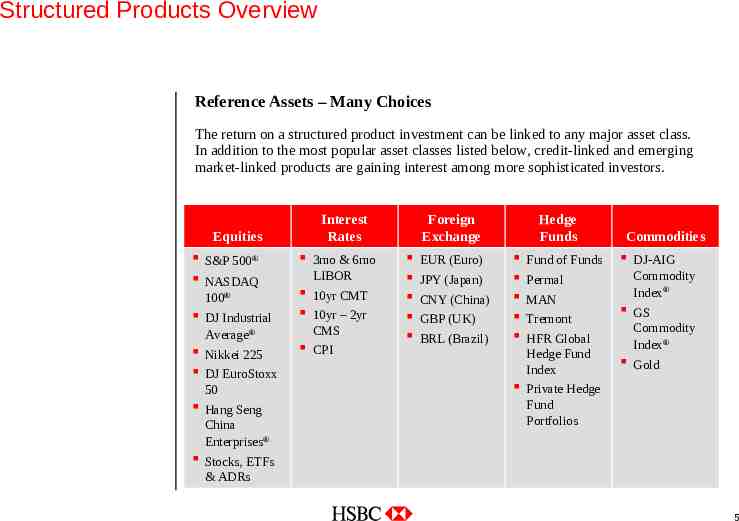
Structured Products Overview Reference Assets – Many Choices The return on a structured product investment can be linked to any major asset class. In addition to the most popular asset classes listed below, credit-linked and emerging market-linked products are gaining interest among more sophisticated investors. Equities S&P 500 NASDAQ 100 DJ Industrial Average Nikkei 225 DJ EuroStoxx 50 Hang Seng China Enterprises Interest Rates 3mo & 6mo LIBOR 10yr CMT 10yr – 2yr CMS CPI Foreign Exchange EUR (Euro) JPY (Japan) CNY (China) GBP (UK) BRL (Brazil) Hedge Funds Fund of Funds Permal MAN Tremont HFR Global Hedge Fund Index Private Hedge Fund Portfolios Commodities DJ-AIG Commodity Index GS Commodity Index Gold Stocks, ETFs & ADRs 5
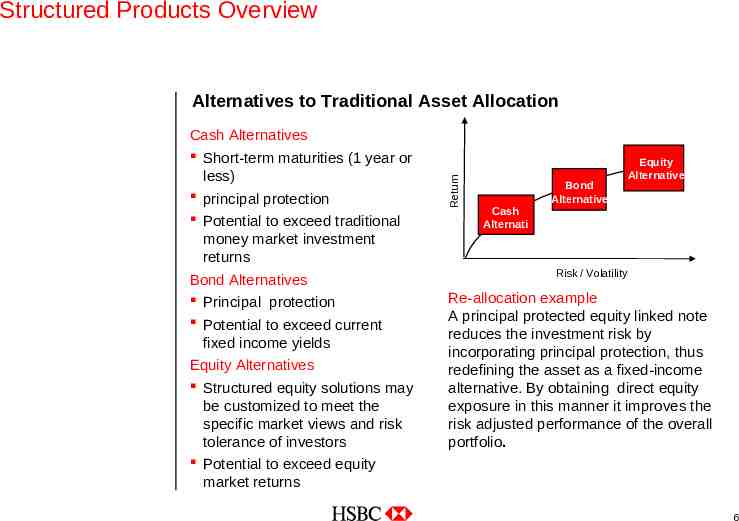
Structured Products Overview Cash Alternatives Short-term maturities (1 year or less) principal protection Potential to exceed traditional money market investment returns Bond Alternatives Principal protection Potential to exceed current fixed income yields Equity Alternatives Structured equity solutions may be customized to meet the specific market views and risk tolerance of investors Potential to exceed equity market returns Return Alternatives to Traditional Asset Allocation Cash Alternati ve Bond Alternative Equity Alternative Risk / Volatility Re-allocation example A principal protected equity linked note reduces the investment risk by incorporating principal protection, thus redefining the asset as a fixed-income alternative. By obtaining direct equity exposure in this manner it improves the risk adjusted performance of the overall portfolio. 6
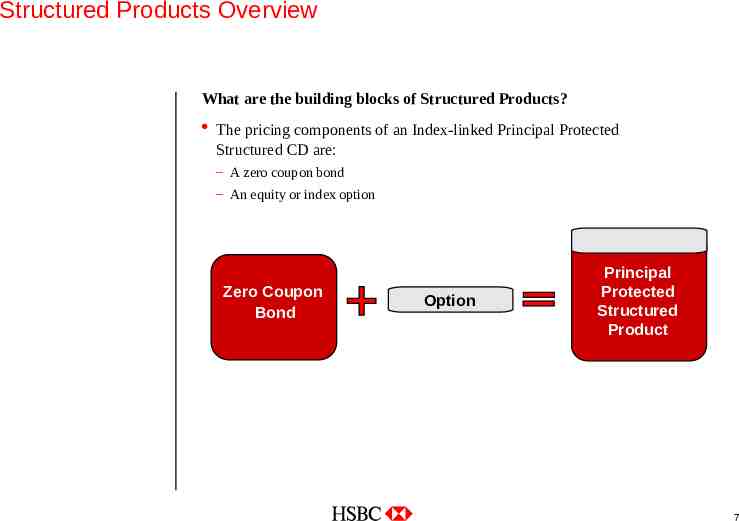
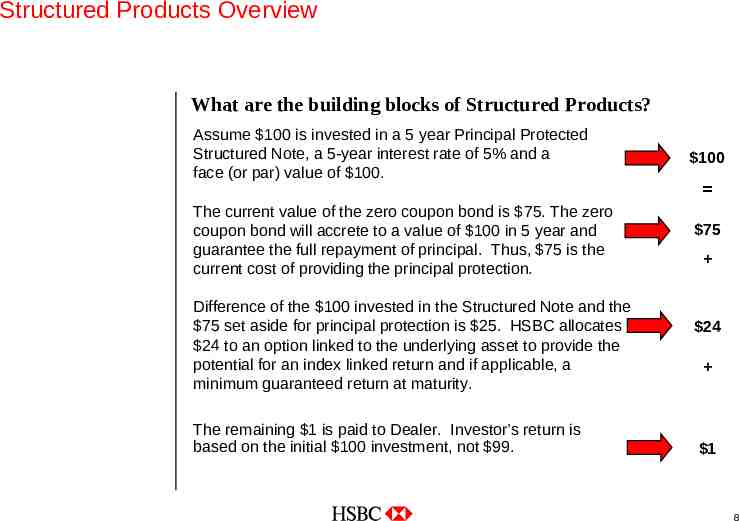
Structured Products Overview What are the building blocks of Structured Products? The pricing components of an Index-linked Principal Protected Structured CD are: – A zero coupon bond – An equity or index option Zero Coupon Bond Option Principal Protected Structured Product 7
Structured Products Overview What are the building blocks of Structured Products? Assume 100 is invested in a 5 year Principal Protected Structured Note, a 5-year interest rate of 5% and a face (or par) value of 100. The current value of the zero coupon bond is 75. The zero coupon bond will accrete to a value of 100 in 5 year and guarantee the full repayment of principal. Thus, 75 is the current cost of providing the principal protection. Difference of the 100 invested in the Structured Note and the 75 set aside for principal protection is 25. HSBC allocates 24 to an option linked to the underlying asset to provide the potential for an index linked return and if applicable, a minimum guaranteed return at maturity. The remaining 1 is paid to Dealer. Investor’s return is based on the initial 100 investment, not 99. 100 75 24 1 8
Industry Trends
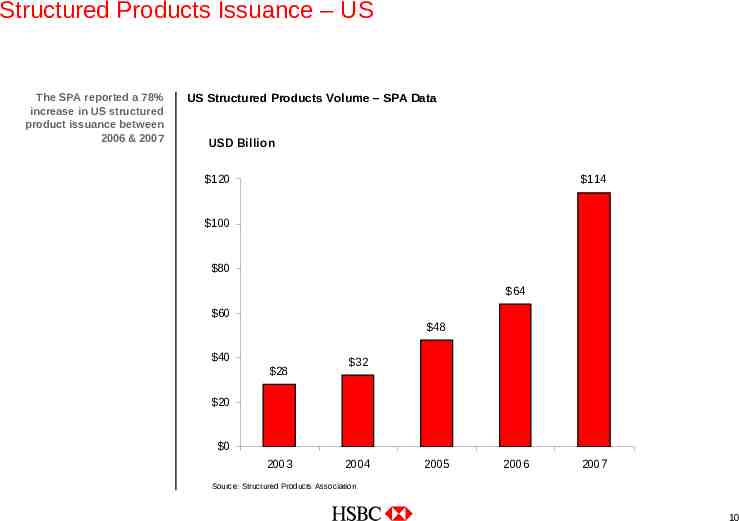
Structured Products Issuance – US The SPA reported a 78% increase in US structured product issuance between 2006 & 2007 US Structured Products Volume – SPA Data USD Billion 120 114 100 80 64 60 48 40 28 32 20 0 2003 2004 2005 2006 2007 Source: Structured Products Association 10
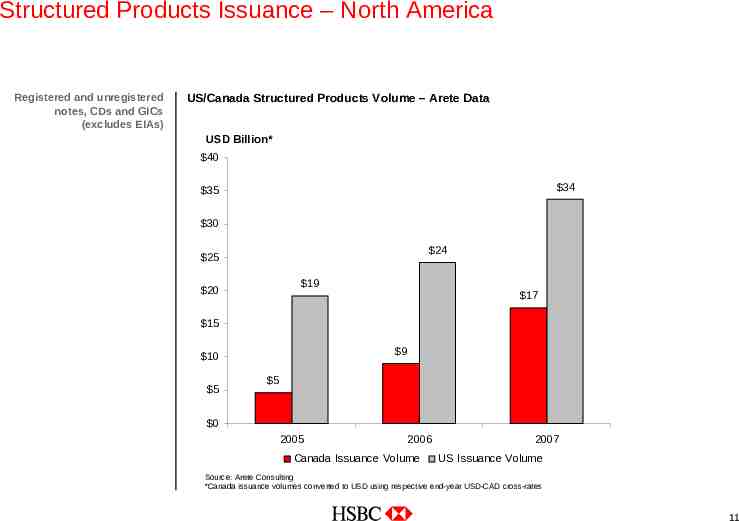
Structured Products Issuance – North America Registered and unregistered notes, CDs and GICs (excludes EIAs) US/Canada Structured Products Volume – Arete Data USD Billion* 40 34 35 30 24 25 19 20 17 15 9 10 5 5 0 2005 2006 Canada Issuance Volume 2007 US Issuance Volume Source: Arete Consulting *Canada issuance volumes converted to USD using respective end-year USD-CAD cross-rates 11
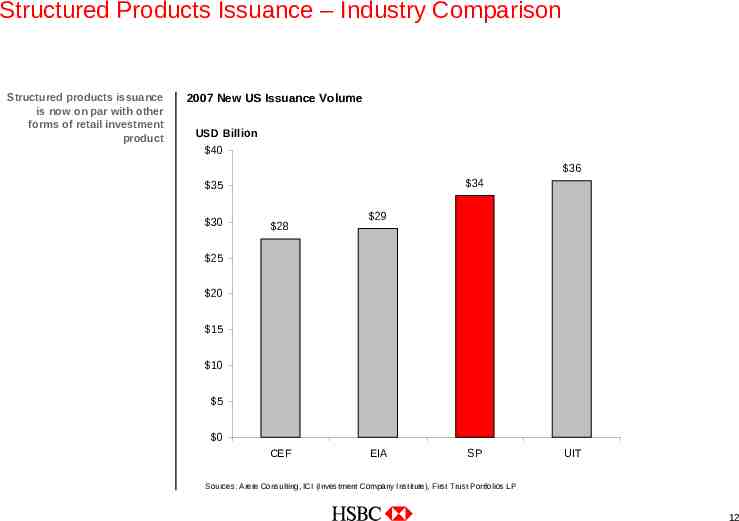
Structured Products Issuance – Industry Comparison Structured products issuance is now on par with other forms of retail investment product 2007 New US Issuance Volume USD Billion 40 36 34 35 30 28 29 25 20 15 10 5 0 CEF EIA SP UIT Sources: Arete Consulting, ICI (Investment Company Institute), First Trust Portfolios LP 12
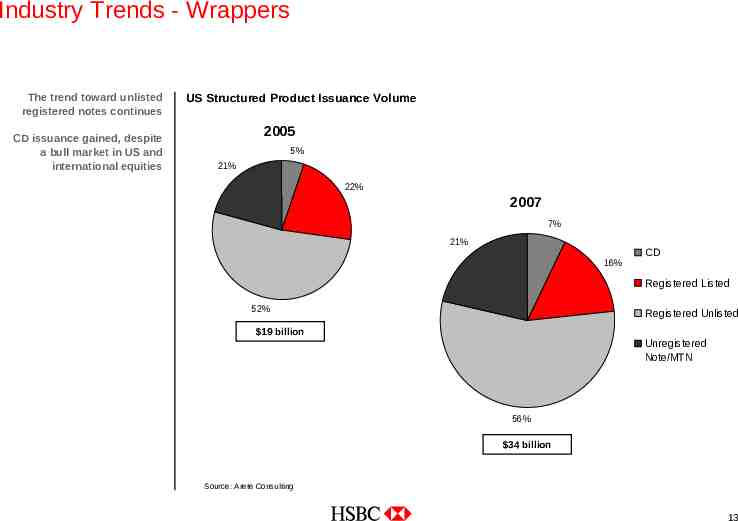
Industry Trends - Wrappers The trend toward unlisted registered notes continues CD issuance gained, despite a bull market in US and international equities US Structured Product Issuance Volume 2005 5% 21% 22% 2007 7% 21% 16% CD Registered Listed 52% Registered Unlisted 19 billion Unregistered Note/MTN 56% 34 billion Source: Arete Consulting 13
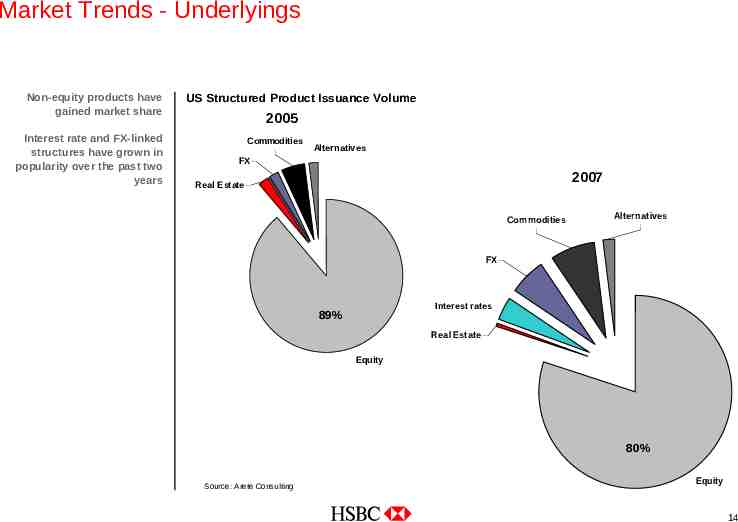
Market Trends - Underlyings Non-equity products have gained market share Interest rate and FX-linked structures have grown in popularity over the past two years US Structured Product Issuance Volume 2005 Commodities Alternatives FX 2007 Real Estate Commodities Alternatives FX Interest rates 89% Real Estate Equity 80% Source: Arete Consulting Equity 14
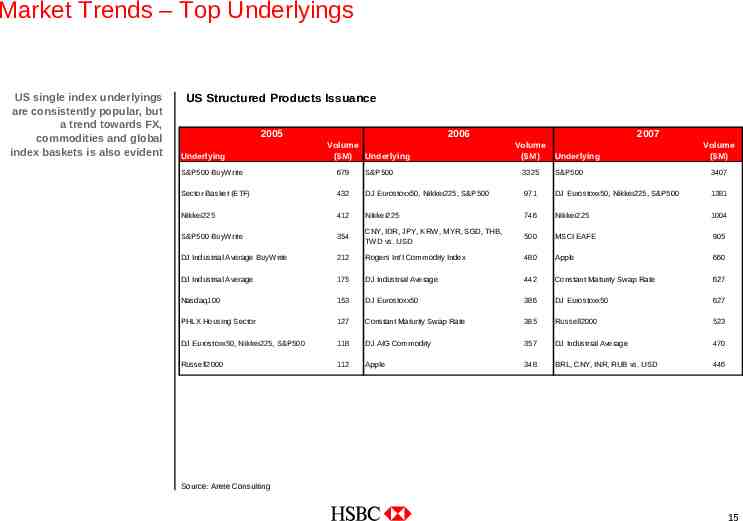
Market Trends – Top Underlyings US single index underlyings are consistently popular, but a trend towards FX, commodities and global index baskets is also evident US Structured Products Issuance 2005 Underlying 2006 Volume ( M) Underlying 2007 Volume ( M) Underlying Volume ( M) S&P500 BuyWrite 679 S&P500 3325 S&P500 3407 Sector Basket (ETF) 432 DJ Eurostoxx50, Nikkei225, S&P500 971 DJ Eurostoxx50, Nikkei225, S&P500 1381 Nikkei225 412 Nikkei225 746 Nikkei225 1004 S&P500 BuyWrite 354 CNY, IDR, JPY, KRW , MYR, SGD, THB, TWD vs. USD 500 MSCI EAFE 905 DJ Industrial Average BuyW rite 212 Rogers Int'l Commodity Index 480 Apple 660 DJ Industrial Average 175 DJ Industrial Average 442 Constant Maturity Swap Rate 627 Nasdaq100 153 DJ Eurostoxx50 386 DJ Eurostoxx50 627 PHLX Housing Sector 127 Constant Maturity Swap Rate 385 Russell2000 523 DJ Eurostoxx50, Nikkei225, S&P500 118 DJ AIG Commodity 357 DJ Industrial Average 470 Russell2000 112 Apple 348 BRL, CNY, INR, RUB vs. USD 446 Source: Arete Consulting 15
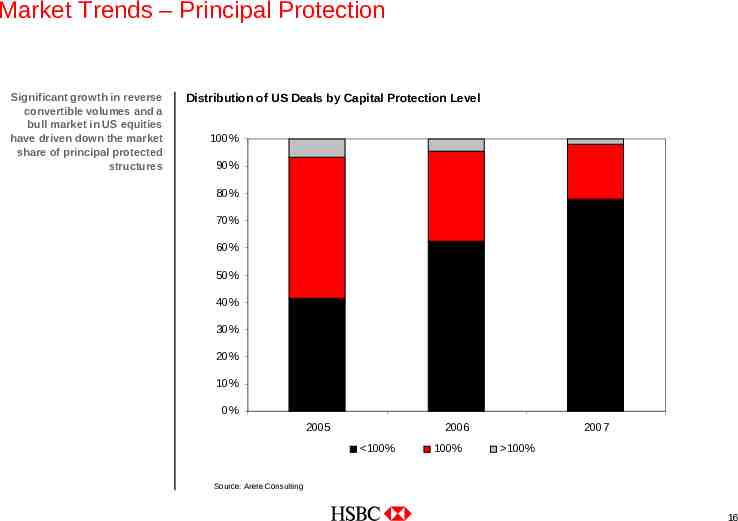
Market Trends – Principal Protection Significant growth in reverse convertible volumes and a bull market in US equities have driven down the market share of principal protected structures Distribution of US Deals by Capital Protection Level 100% 90% 80% 70% 60% 50% 40% 30% 20% 10% 0% 2005 2006 100% 100% 2007 100% Source: Arete Consulting 16
Current Market for Structured Products
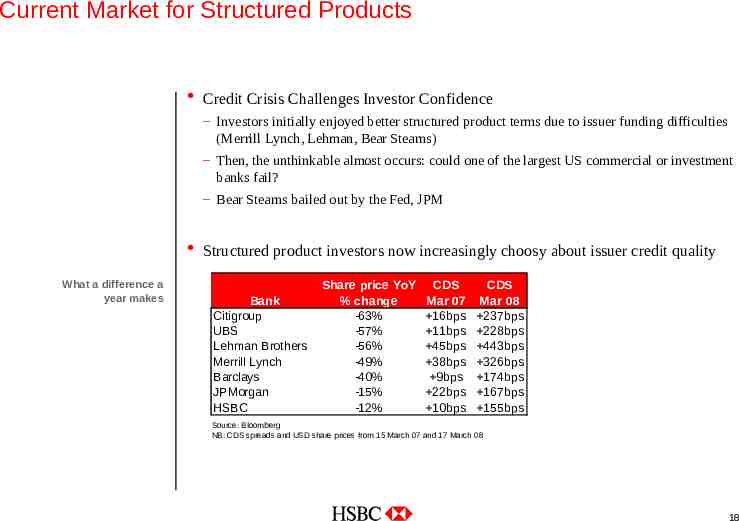
Current Market for Structured Products Credit Crisis Challenges Investor Confidence – Investors initially enjoyed better structured product terms due to issuer funding difficulties (Merrill Lynch, Lehman, Bear Stearns) – Then, the unthinkable almost occurs: could one of the largest US commercial or investment banks fail? – Bear Stearns bailed out by the Fed, JPM Structured product investors now increasingly choosy about issuer credit quality What a difference a year makes Bank Citigroup UBS Lehman Brothers Merrill Lynch Barclays JPMorgan HSBC Share price YoY % change -63% -57% -56% -49% -40% -15% -12% CDS Mar 07 16bps 11bps 45bps 38bps 9bps 22bps 10bps CDS Mar 08 237bps 228bps 443bps 326bps 174bps 167bps 155bps Source: Bloomberg NB: CDS spreads and USD share prices from 15 March 07 and 17 March 08 18
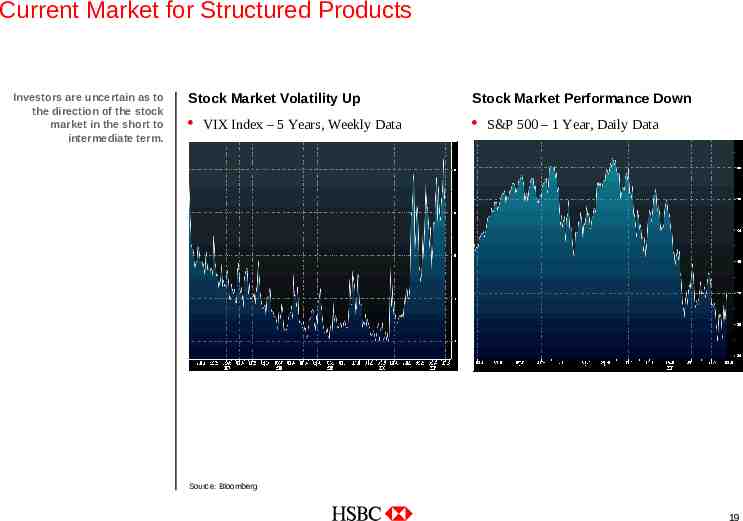
Current Market for Structured Products Investors are uncertain as to the direction of the stock market in the short to intermediate term. Stock Market Volatility Up Stock Market Performance Down VIX Index – 5 Years, Weekly Data S&P 500 – 1 Year, Daily Data Source: Bloomberg 19
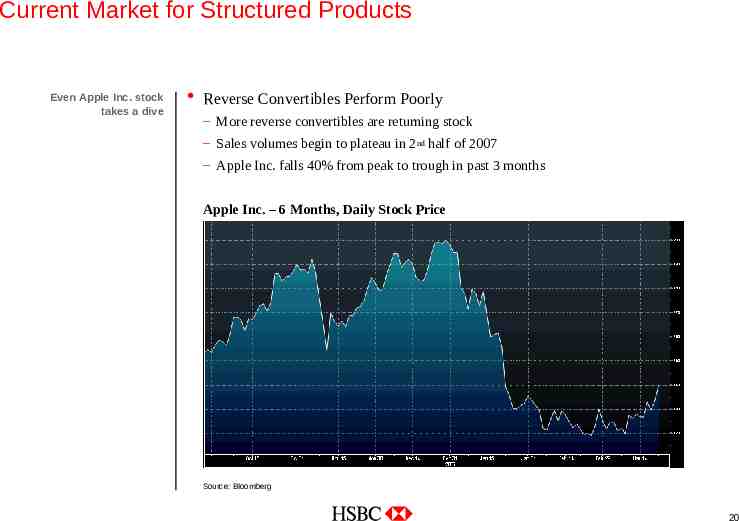
Current Market for Structured Products Even Apple Inc. stock takes a dive Reverse Convertibles Perform Poorly – More reverse convertibles are returning stock – Sales volumes begin to plateau in 2nd half of 2007 – Apple Inc. falls 40% from peak to trough in past 3 months Apple Inc. – 6 Months, Daily Stock Price Source: Bloomberg 20
Current Market for Structured Products Brokers and advisors are looking beyond Reverse Convertibles Searching for Safety – Increased demand for principal protection especially via CDs as FDIC insurance comforts credit fears – Partial protection OK as long as protection is “firm”, not “contingent” Performance Through Uncertain or “Sideways” Equity Markets – Absolute return notes for equity cash on the sidelines – Accelerated return notes: more bang for the buck Quest for Yield Continues – Autocallable notes gaining popularity beyond Latam and Private Banking marketplace – Return of the LIBOR range accrual note 21
Looking Ahead: Emerging Themes for 2008
Emerging Themes for 2008 - Convergence The asset management industry continues to evolve New Wrappers for Structured Investments – Mutual funds and Unit Investment Trusts (UITs) offering principal protection – Closed-end funds offering buy/write yield enhancement strategies Active Management Offered via ETFs – Recent regulatory approval for the first actively-managed ETFs – Formerly the territory of mutual funds and SMAs New “Strategy-based” Indices – Replicating active management techniques for structured notes – – – – S&P’s DTI and CTI indices (HSBC) SEVENS Index (UBS, MS) Citibank Country Selection Index (Citi) Adagio Index (Bear Stearns) 23
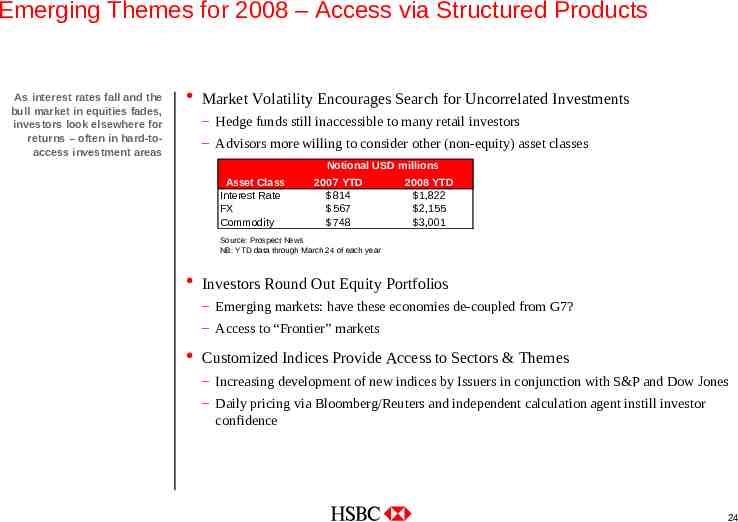
Emerging Themes for 2008 – Access via Structured Products As interest rates fall and the bull market in equities fades, investors look elsewhere for returns – often in hard-toaccess investment areas Market Volatility Encourages Search for Uncorrelated Investments – Hedge funds still inaccessible to many retail investors – Advisors more willing to consider other (non-equity) asset classes Notional USD millions Asset Class Interest Rate FX Commodity 2007 YTD 814 567 748 2008 YTD 1,822 2,155 3,001 Source: Prospect News NB: YTD data through March 24 of each year Investors Round Out Equity Portfolios – Emerging markets: have these economies de-coupled from G7? – Access to “Frontier” markets Customized Indices Provide Access to Sectors & Themes – Increasing development of new indices by Issuers in conjunction with S&P and Dow Jones – Daily pricing via Bloomberg/Reuters and independent calculation agent instill investor confidence 24
Challenges & Opportunities
Today’s Challenges. Today’s challenges will lead to new opportunities and encourage continued innovation Credit Crisis – Avoid the taint of problems in the structured credit market (SIVs, CDOs, etc) – Restore confidence in the credit-worthiness of Issuers Taxation of ETNs – Aggressive marketing of ETNs has led to increased scrutiny – Clearer guidance as to tax treatment of certain structured products may benefit industry Poor Performance of Reverse Convertibles – Independent broker-dealer channel most vulnerable Current Market Environment Unfriendly for New Equity-linked PPNs – Low interest rates, high equity volatility – Opportunity for more interest-rate and FX linked principal protected notes/CDs 26
.and Tomorrow’s Opportunities Today’s challenges will lead to new opportunities and encourage continued innovation Get the Word Out! – Increased broker awareness of structured products through education – Nearly ¾ of structured product volume in 2007 sold via Issuers with internal distribution channels1 Great Time for Structured Products to Shine – The current market environment highlights the many benefits of structured products: 1. Attractive combinations of risk and reward 2. Access to uncorrelated asset classes and hard-to-reach markets 3. Returns linked to customized and/or strategy-based indices Source: Structured Products Association 1 27