13 Chapter 13 The Data Warehouse 1


51 Slides2.22 MB
13 Chapter 13 The Data Warehouse 1
13 The Need for Data Analysis Managers must be able to track daily transactions to evaluate how the business is performing By tapping into the operational database, management can develop strategies to meet organizational goals Data analysis can provide information about short-term tactical evaluations and strategies 2
13 Solving Business Problems and Adding Value with Data Warehouse-Based Solutions 3
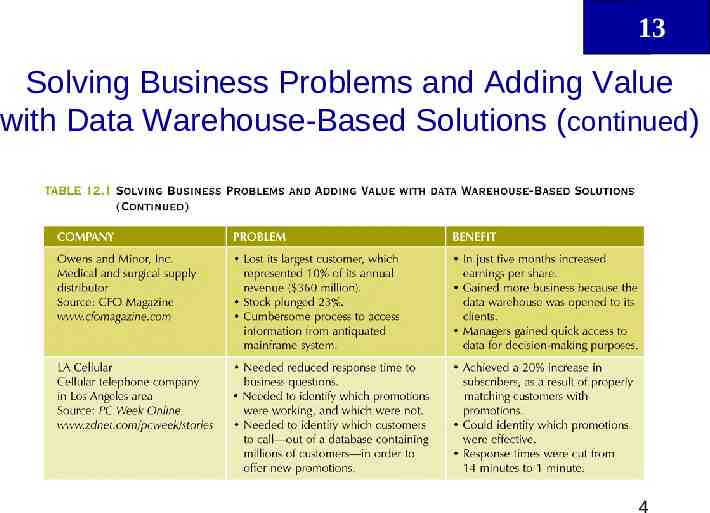
13 Solving Business Problems and Adding Value with Data Warehouse-Based Solutions (continued) 4
13 Decision Support Systems Methodology (or series of methodologies) designed to extract information from data and to use such information as a basis for decision making Decision support system (DSS): – Arrangement of computerized tools used to assist managerial decision making within a business – Usually requires extensive data “massaging” to produce information – Used at all levels within an organization – Often tailored to focus on specific business areas – Provides ad hoc query tools to retrieve data and to display data in different formats 5
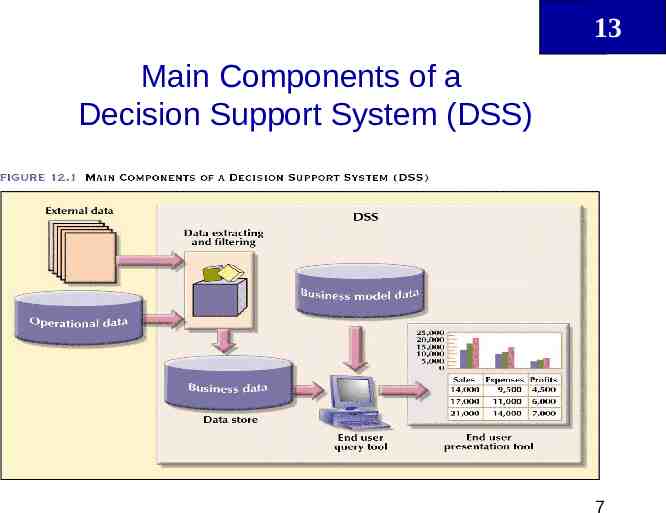
13 Decision Support Systems (continued) Composed of four main components: – Data store component Basically a DSS database – Data extraction and filtering component Used to extract and validate data taken from operational database and external data sources – End-user query tool Used to create queries that access database – End-user presentation tool Used to organize and present data 6
13 Main Components of a Decision Support System (DSS) 7
13 Transforming Operational Data Into Decision Support Data 8
13 Contrasting Operational and DSS Data Characteristics 9
13 The Data Warehouse Integrated, subject-oriented, time-variant, nonvolatile database that provides support for decision making 10
13 A Comparison of Data Warehouse and Operational Database Characteristics 11
13 Creating a Data Warehouse 12
13 The ETL Process Capture/Extract Scrub or data cleansing Transform Load and Index ETL Extract, transform, and load 13
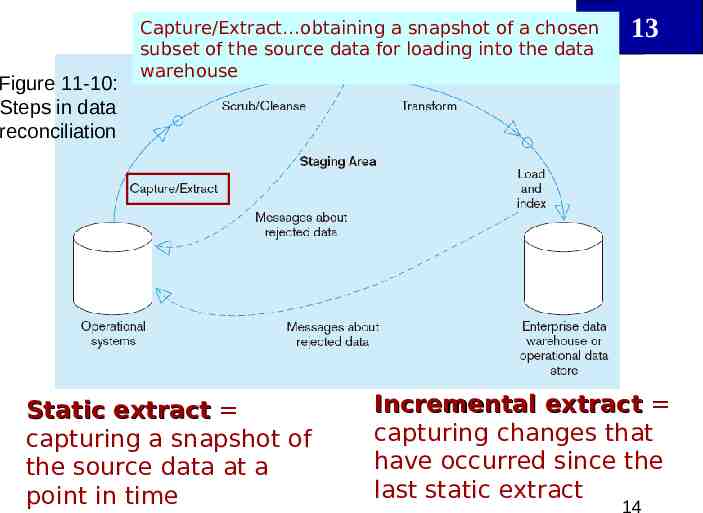
Figure 11-10: Steps in data reconciliation Capture/Extract obtaining a snapshot of a chosen subset of the source data for loading into the data warehouse Static extract capturing a snapshot of the source data at a point in time 13 Incremental extract capturing changes that have occurred since the last static extract 14
Scrub/Cleanse uses pattern recognition and AI techniques to upgrade data quality 13 Figure 11-10: Steps in data reconciliation (cont.) Fixing errors: misspellings, erroneous dates, incorrect field usage, mismatched addresses, missing data, duplicate data, inconsistencies Also: decoding, reformatting, time stamping, conversion, key generation, merging, error detection/logging, locating 15 missing data
13 Cleanse: Process to identify erroneous data, not to fix them Fixes are made at the source Scrubbing: A technique using pattern recognition and other AI techniques to upgrade the quality of data 16
Transform convert data from format of operational system to format of data warehouse 13 Figure 11-10: Steps in data reconciliation (cont.) Record-level: Selection–data partitioning Joining–data combining Aggregation–data summarization Field-level: single-field–from one field to one field multi-field–from many fields to one, or one field to many 17
Figure 11-10: Steps in data reconciliation (cont.) Load/Index place transformed data into the warehouse and create indexes Refresh mode: bulk rewriting of target data at periodic intervals 13 Update mode: only changes in source data are written to data warehouse 18
Figure 11-11: Single-field transformation 13 In general–some transformation function translates data from old form to new form Algorithmic transformation uses a formula or logical expression Table lookup–another approach, uses a separate table keyed by source record code 19
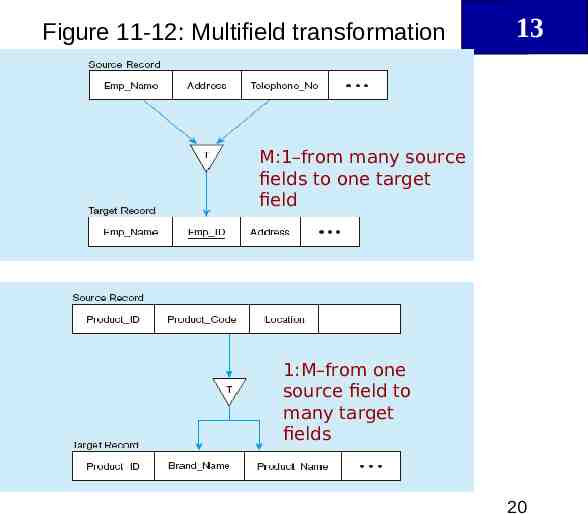
Figure 11-12: Multifield transformation 13 M:1–from many source fields to one target field 1:M–from one source field to many target fields 20
Derived Data 13 Objectives – – – – – Ease of use for decision support applications Fast response to predefined user queries Customized data for particular target audiences Ad-hoc query support Data mining capabilities Characteristics – Detailed (mostly periodic) data – Aggregate (for summary) – Distributed (to departmental servers) Most common data model star schema (also called “dimensional model”) 21
Star Schemas 13 Data modeling technique used to map multidimensional decision support data into a relational database Creates the near equivalent of a multidimensional database schema from the existing relational database Yield an easily implemented model for multidimensional data analysis, while still preserving the relational structures on which the operational database is built Has four components: facts, dimensions, attributes, and attribute hierarchies 22
Figure 11-13 Components of a star schema 13 Fact tables contain factual or quantitative data 1:N relationship between dimension tables and fact tables Dimension tables are denormalized to maximize performance Dimension tables contain descriptions about the subjects of the business Excellent for ad-hoc queries, but bad for online transaction processing 23
Figure 11-14 Star schema example 13 Fact table provides statistics for sales broken down by product, period and store dimensions 24
Figure 11-15 Star schema with sample data 13 25
13 Size of fact table assume: Total number of stores 1000 Total number of products 10,000 Total number of periods 24 (two years) Assume 50% of products record sales Then total rows in fact table 1000stores* 5000 active products)*24 months 120,000,000 rows 26
13 Size of “fact” table Assume there are 6 fields each 4 bytes long, then total size 120,00,000* 6 fields* 4bytes/field 2,880,000,000 (2.88 gigabytes) If instead of monthly, you record daily data Multiply above by 30 (30 days/per month) 27
13 Online Analytical Processing Advanced data analysis environment that supports decision making, business modeling, and operations research OLAP systems share four main characteristics: – – – – Use multidimensional data analysis techniques Provide advanced database support Provide easy-to-use end-user interfaces Support client/server architecture 28
13 Operational vs. Multidimensional View of Sales 29
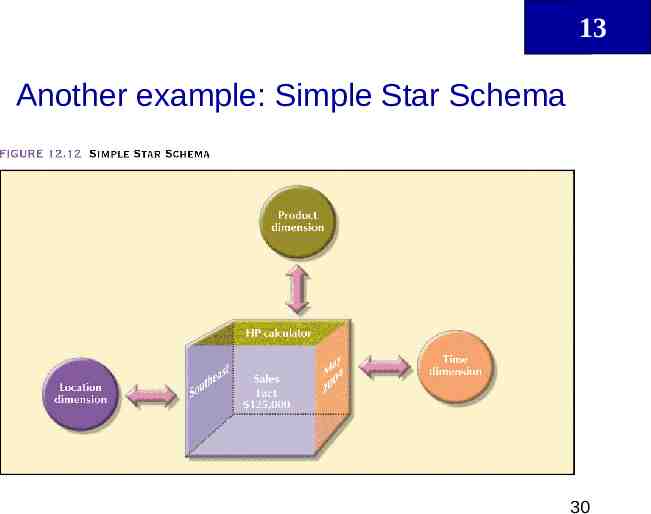
13 Another example: Simple Star Schema 30
13 Possible Attributes for Sales Dimensions 31
13 Three-Dimensional View of Sales 32
13 Slice and Dice View of Sales 33
13 Location Attribute Hierarchy 34
13 Star Schema for Sales 35
13 Orders Star Schema 36
13 Normalized Dimension tables 37
13 Multiple Fact Tables 38
13 On-Line Analytical Processing (OLAP) Tools The use of a set of graphical tools that provides users with multidimensional views of their data and allows them to analyze the data using simple windowing techniques Relational OLAP (ROLAP) – Traditional relational representation Multidimensional OLAP (MOLAP) – Cube structure OLAP Operations – Cube slicing–come up with 2-D view of data – Drill-down–going from summary to more detailed views 39
Figure 11-23 Slicing a data cube 13 40
Figure 11-24 Example of drill-down Starting with summary data, users can obtain details for particular cells Summary report 13 Drill-down with color added 41
13 Implementing a Data Warehouse Numerous constraints: – Available funding – Management’s view of the role played by an IS department and of the extent and depth of the information requirements – Corporate culture No single formula can describe perfect data warehouse development 42
13 Factors Common to Data Warehousing Data warehouse is not a static database Dynamic framework for decision support that is always a work in progress Data warehouse data cross departmental lines and geographical boundaries Must satisfy: – Data integration and loading criteria – Data analysis capabilities with acceptable query performance – End-user data analysis needs Apply database design procedures 43
13 Data Mining Tools that: – analyze data – uncover problems or opportunities hidden in data relationships, – form computer models based on their findings, and then – use the models to predict business behavior Require minimal end-user intervention 44
13 Extraction of Knowledge From Data 45
13 Data-Mining Phases 46
13 A Sample of Current Data Warehousing and Data-Mining Vendors 47
Data Mining and Visualization 13 Knowledge discovery using a blend of statistical, AI, and computer graphics techniques Goals: – Explain observed events or conditions – Confirm hypotheses – Explore data for new or unexpected relationships Techniques – – – – – – – – – Statistical regression Decision tree induction Clustering and signal processing Affinity Sequence association Case-based reasoning Rule discovery Neural nets Fractals Data visualization–representing data in graphical/multimedia formats for analysis 48
13 Summary Data analysis is used to derive and interpret information from data Decision support is a methodology designed to extract information from data and to use such information as a basis for decision making Decision support system is an arrangement of computerized tools used to assist managerial decision making within a business Data warehouse is an integrated, subjectoriented, time-variant, nonvolatile database that provides support for decision making 49
13 Summary (continued) Online analytical processing is an advanced data analysis environment that supports decision making, business modeling, and operations research Star schema is a data-modeling technique used to map multidimensional decision support data into a relational database The implementation of any company-wide information system is subject to conflicting organizational and behavioral factors 50
13 Summary (continued) Data mining automates analysis of operational data with the intention of finding previously unknown data characteristics, relationships, dependencies, and/or trends Data warehouse is storage location for decision support data 51