Water Quality Management in India R.M.Bhardwaj Central

30 Slides529.50 KB
Water Quality Management in India R.M.Bhardwaj Central Pollution Control Board (Ministry of Environment & Forests) ‘Parivesh Bhawan', East Arjun Nagar Delhi – 110 032
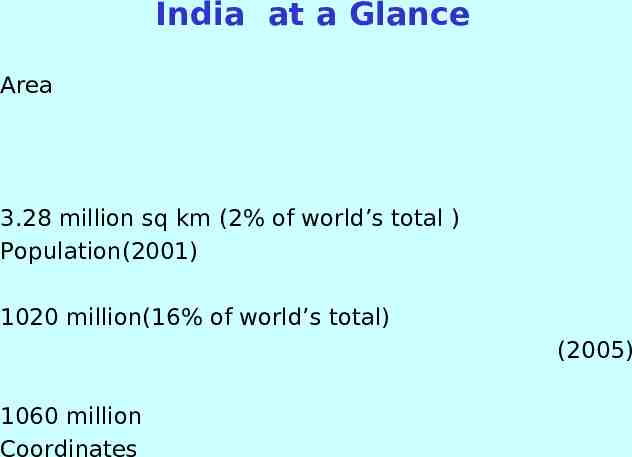
India at a Glance Area 3.28 million sq km (2% of world’s total ) Population(2001) 1020 million(16% of world’s total) (2005) 1060 million Coordinates
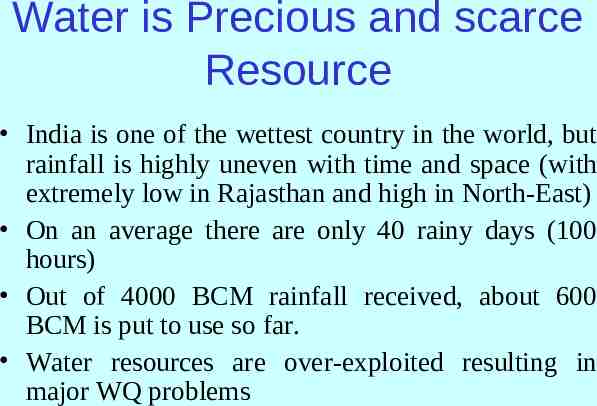
Water is Precious and scarce Resource India is one of the wettest country in the world, but rainfall is highly uneven with time and space (with extremely low in Rajasthan and high in North-East) On an average there are only 40 rainy days (100 hours) Out of 4000 BCM rainfall received, about 600 BCM is put to use so far. Water resources are over-exploited resulting in major WQ problems
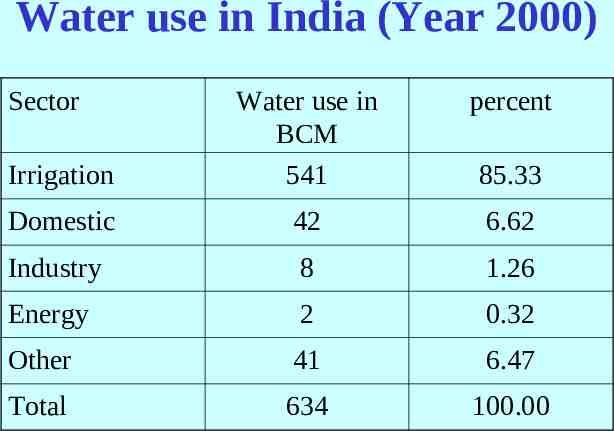
Water use in India (Year 2000) Sector percent Irrigation Water use in BCM 541 Domestic 42 6.62 Industry 8 1.26 Energy 2 0.32 Other 41 6.47 Total 634 100.00 85.33
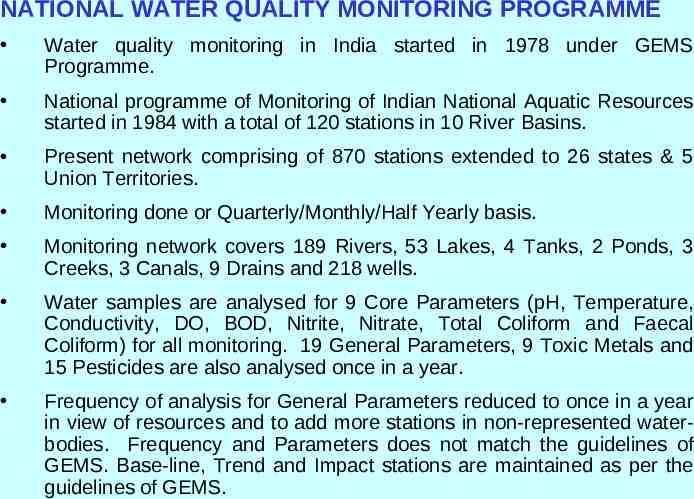
NATIONAL WATER QUALITY MONITORING PROGRAMME Water quality monitoring in India started in 1978 under GEMS Programme. National programme of Monitoring of Indian National Aquatic Resources started in 1984 with a total of 120 stations in 10 River Basins. Present network comprising of 870 stations extended to 26 states & 5 Union Territories. Monitoring done or Quarterly/Monthly/Half Yearly basis. Monitoring network covers 189 Rivers, 53 Lakes, 4 Tanks, 2 Ponds, 3 Creeks, 3 Canals, 9 Drains and 218 wells. Water samples are analysed for 9 Core Parameters (pH, Temperature, Conductivity, DO, BOD, Nitrite, Nitrate, Total Coliform and Faecal Coliform) for all monitoring. 19 General Parameters, 9 Toxic Metals and 15 Pesticides are also analysed once in a year. Frequency of analysis for General Parameters reduced to once in a year in view of resources and to add more stations in non-represented waterbodies. Frequency and Parameters does not match the guidelines of GEMS. Base-line, Trend and Impact stations are maintained as per the guidelines of GEMS.
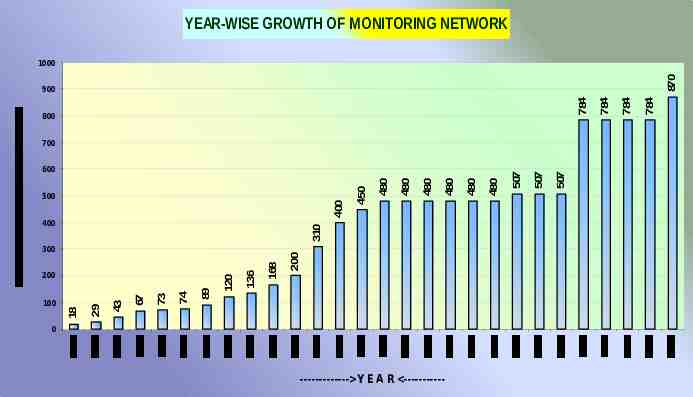
YEAR-WISE GROWTH OF MONITORING NETWORK 870 1000 400 168 136 89 74 73 67 43 29 100 18 200 120 300 0 ------------- Y E A R ----------- 507 507 480 480 480 480 480 200 310 400 480 500 450 600 507 700 784 784 800 784 784 900
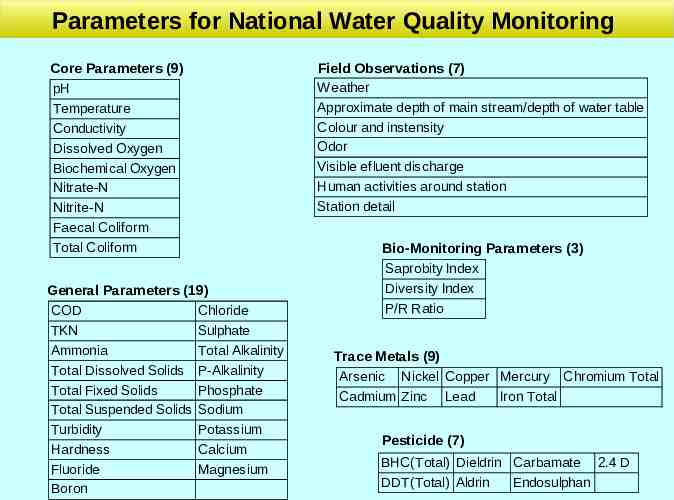
Parameters for National Water Quality Monitoring Core Parameters (9) pH Temperature Conductivity Dissolved Oxygen Biochemical Oxygen Demand Nitrate-N Nitrite-N Faecal Coliform Total Coliform General Parameters (19) COD Chloride TKN Sulphate Ammonia Total Alkalinity Total Dissolved Solids P-Alkalinity Total Fixed Solids Phosphate Total Suspended Solids Sodium Turbidity Potassium Hardness Calcium Fluoride Magnesium Boron Field Observations (7) Weather Approximate depth of main stream/depth of water table Colour and instensity Odor Visible efluent discharge Human activities around station Station detail Bio-Monitoring Parameters (3) Saprobity Index Diversity Index P/R Ratio Trace Metals (9) Arsenic Nickel Copper Mercury Chromium Total Cadmium Zinc Lead Iron Total Pesticide (7) BHC(Total) Dieldrin Carbamate 2.4 D DDT(Total) Aldrin Endosulphan
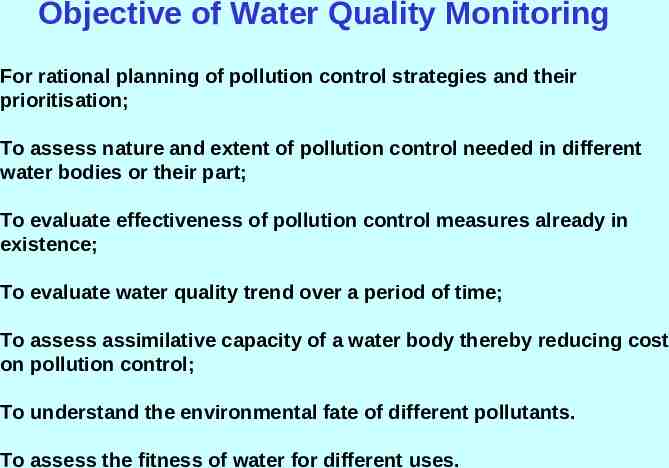
Objective of Water Quality Monitoring For rational planning of pollution control strategies and their prioritisation; To assess nature and extent of pollution control needed in different water bodies or their part; To evaluate effectiveness of pollution control measures already in existence; To evaluate water quality trend over a period of time; To assess assimilative capacity of a water body thereby reducing cost on pollution control; To understand the environmental fate of different pollutants. To assess the fitness of water for different uses.
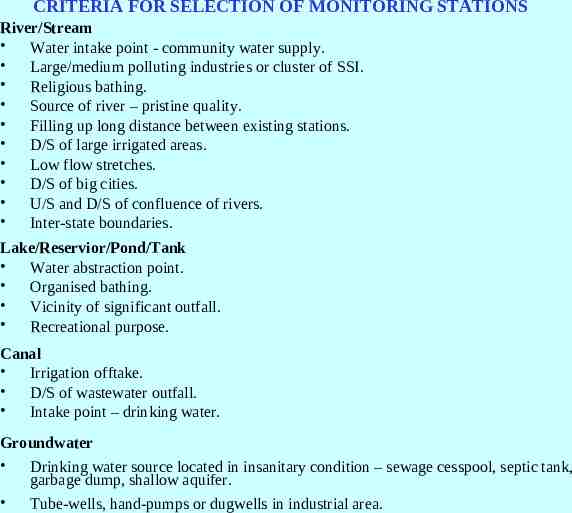
CRITERIA FOR SELECTION OF MONITORING STATIONS River/Stream Water intake point - community water supply. Large/medium polluting industries or cluster of SSI. Religious bathing. Source of river – pristine quality. Filling up long distance between existing stations. D/S of large irrigated areas. Low flow stretches. D/S of big cities. U/S and D/S of confluence of rivers. Inter-state boundaries. Lake/Reservior/Pond/Tank Water abstraction point. Organised bathing. Vicinity of significant outfall. Recreational purpose. Canal Irrigation offtake. D/S of wastewater outfall. Intake point – drinking water. Groundwater Drinking water source located in insanitary condition – sewage cesspool, septic tank, garbage dump, shallow aquifer. Tube-wells, hand-pumps or dugwells in industrial area.
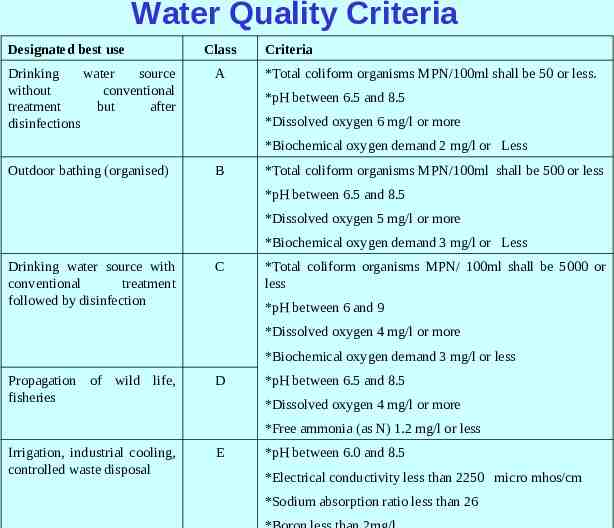
Water Quality Criteria Designated best use Drinking water source without conventional treatment but after disinfections Class A Criteria *Total coliform organisms MPN/100ml shall be 50 or less. *pH between 6.5 and 8.5 *Dissolved oxygen 6 mg/l or more *Biochemical oxygen demand 2 mg/l or Less Outdoor bathing (organised) B *Total coliform organisms MPN/100ml shall be 500 or less *pH between 6.5 and 8.5 *Dissolved oxygen 5 mg/l or more *Biochemical oxygen demand 3 mg/l or Less Drinking water source with conventional treatment followed by disinfection C *Total coliform organisms MPN/ 100ml shall be 5000 or less *pH between 6 and 9 *Dissolved oxygen 4 mg/l or more *Biochemical oxygen demand 3 mg/l or less Propagation of wild life, fisheries D *pH between 6.5 and 8.5 *Dissolved oxygen 4 mg/l or more *Free ammonia (as N) 1.2 mg/l or less Irrigation, industrial cooling, controlled waste disposal E *pH between 6.0 and 8.5 *Electrical conductivity less than 2250 micro mhos/cm *Sodium absorption ratio less than 26
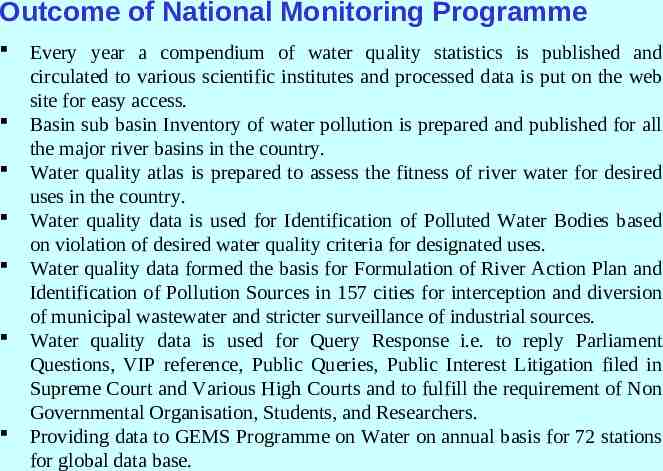
Outcome of National Monitoring Programme Every year a compendium of water quality statistics is published and circulated to various scientific institutes and processed data is put on the web site for easy access. Basin sub basin Inventory of water pollution is prepared and published for all the major river basins in the country. Water quality atlas is prepared to assess the fitness of river water for desired uses in the country. Water quality data is used for Identification of Polluted Water Bodies based on violation of desired water quality criteria for designated uses. Water quality data formed the basis for Formulation of River Action Plan and Identification of Pollution Sources in 157 cities for interception and diversion of municipal wastewater and stricter surveillance of industrial sources. Water quality data is used for Query Response i.e. to reply Parliament Questions, VIP reference, Public Queries, Public Interest Litigation filed in Supreme Court and Various High Courts and to fulfill the requirement of Non Governmental Organisation, Students, and Researchers. Providing data to GEMS Programme on Water on annual basis for 72 stations for global data base.
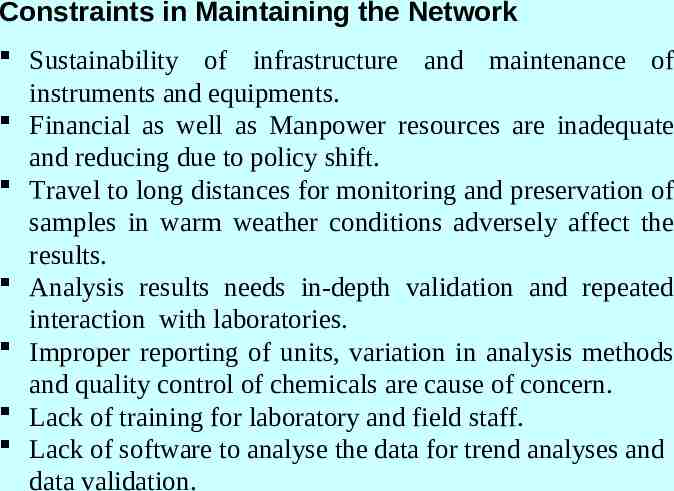
Constraints in Maintaining the Network Sustainability of infrastructure and maintenance of instruments and equipments. Financial as well as Manpower resources are inadequate and reducing due to policy shift. Travel to long distances for monitoring and preservation of samples in warm weather conditions adversely affect the results. Analysis results needs in-depth validation and repeated interaction with laboratories. Improper reporting of units, variation in analysis methods and quality control of chemicals are cause of concern. Lack of training for laboratory and field staff. Lack of software to analyse the data for trend analyses and data validation.
Limitations of Monitoring Programme Problems in data validation due to fluctuation in water quality. Flow in many rivers dwindles due to short period of monsoon. Environmental flows are not maintained, hence only urban wastewater flows in the rivers after major abstraction points. Removal of outliers during validation of data may devoid valuable information related to flushing of Industrial effluents responsible for episodal pollution and fish kill. Need of software for processing, validation/trend analyses and format data storage. Priorities for water quality management varies widely from developed countries to developing countries.
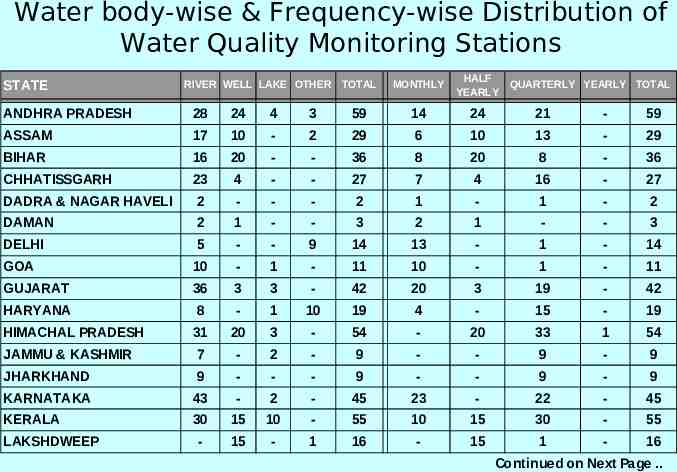
Water body-wise & Frequency-wise Distribution of Water Quality Monitoring Stations STATE RIVER WELL LAKE OTHER TOTAL MONTHLY HALF YEARLY QUARTERLY YEARLY TOTAL ANDHRA PRADESH 28 24 4 3 59 14 24 21 - 59 ASSAM 17 10 - 2 29 6 10 13 - 29 BIHAR 16 20 - - 36 8 20 8 - 36 CHHATISSGARH 23 4 - - 27 7 4 16 - 27 DADRA & NAGAR HAVELI 2 - - - 2 1 - 1 - 2 DAMAN 2 1 - - 3 2 1 - - 3 DELHI 5 - - 9 14 13 - 1 - 14 GOA 10 - 1 - 11 10 - 1 - 11 GUJARAT 36 3 3 - 42 20 3 19 - 42 HARYANA 8 - 1 10 19 4 - 15 - 19 HIMACHAL PRADESH 31 20 3 - 54 - 20 33 1 54 JAMMU & KASHMIR 7 - 2 - 9 - - 9 - 9 JHARKHAND 9 - - - 9 - - 9 - 9 KARNATAKA 43 - 2 - 45 23 - 22 - 45 KERALA 30 15 10 - 55 10 15 30 - 55 - 15 - 1 16 - 15 1 - 16 LAKSHDWEEP Continued on Next Page .
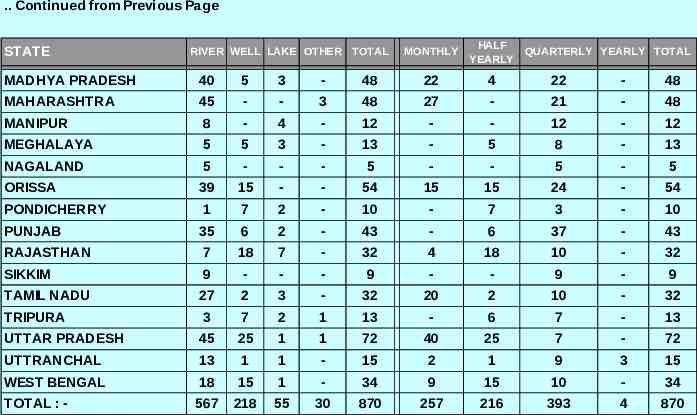
. Continued from Previous Page STATE RIVER WELL LAKE OTHER TOTAL MONTHLY HALF YEARLY QUARTERLY YEARLY TOTAL MADHYA PRADESH 40 5 3 - 48 22 4 22 - 48 MAHARASHTRA 45 - - 3 48 27 - 21 - 48 MANIPUR 8 - 4 - 12 - - 12 - 12 MEGHALAYA 5 5 3 - 13 - 5 8 - 13 NAGALAND 5 - - - 5 - - 5 - 5 39 15 - - 54 15 15 24 - 54 1 7 2 - 10 - 7 3 - 10 35 6 2 - 43 - 6 37 - 43 RAJASTHAN 7 18 7 - 32 4 18 10 - 32 SIKKIM 9 - - - 9 - - 9 - 9 27 2 3 - 32 20 2 10 - 32 3 7 2 1 13 - 6 7 - 13 UTTAR PRADESH 45 25 1 1 72 40 25 7 - 72 UTTRANCHAL 13 1 1 - 15 2 1 9 3 15 WEST BENGAL 18 15 1 - 34 9 15 10 - 34 TOTAL : - 567 218 55 30 870 257 216 393 4 870 ORISSA PONDICHERRY PUNJAB TAMIL NADU TRIPURA
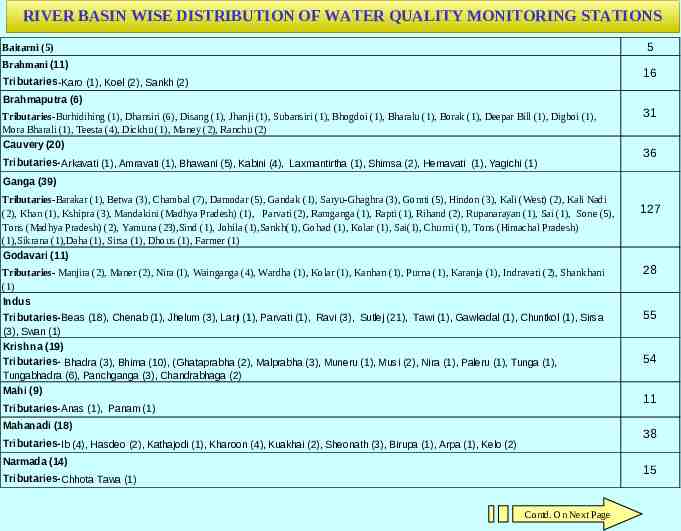
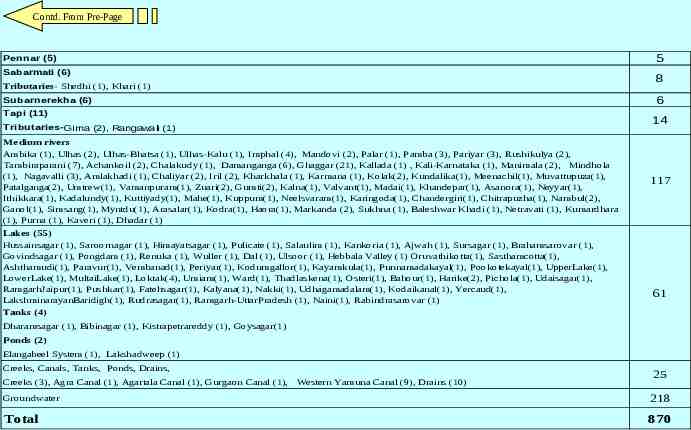
RIVER BASIN WISE DISTRIBUTION OF WATER QUALITY MONITORING STATIONS 5 Baitarni (5) Brahmani (11) 16 Tributaries-Karo (1), Koel (2), Sankh (2) Brahmaputra (6) Tributaries-Burhidihing (1), Dhansiri (6), Disang (1), Jhanji (1), Subansiri (1), Bhogdoi (1), Bharalu (1), Borak (1), Deepar Bill (1), Digboi (1), Mora Bharali (1), Teesta (4), Dickhu (1), Maney (2), Ranchu (2) Cauvery (20) Tributaries-Arkavati (1), Amravati (1), Bhawani (5), Kabini (4), Laxmantirtha (1), Shimsa (2), Hemavati (1), Yagichi (1) 31 36 Ganga (39) Tributaries-Barakar (1), Betwa (3), Chambal (7), Damodar (5), Gandak (1), Saryu-Ghaghra (3), Gomti (5), Hindon (3), Kali (West) (2), Kali Nadi (2), Khan (1), Kshipra (3), Mandakini (Madhya Pradesh) (1), Parvati (2), Ramganga (1), Rapti (1), Rihand (2), Rupanarayan (1), Sai (1), Sone (5), Tons (Madhya Pradesh) (2), Yamuna (23),Sind (1), Johila (1),Sankh(1), Gohad (1), Kolar (1), Sai(1), Churni (1), Tons (Himachal Pradesh) (1),Sikrana (1),Daha (1), Sirsa (1), Dhous (1), Farmer (1) Godavari (11) Tributaries- Manjira (2), Maner (2), Nira (I), Wainganga (4), Wardha (1), Kolar (1), Kanhan (1), Purna (1), Karanja (1), Indravati (2), Shankhani (1) Indus Tributaries-Beas (18), Chenab (1), Jhelum (3), Larji (1), Parvati (1), Ravi (3), Sutlej (21), Tawi (1), Gawkadal (1), Chuntkol (1), Sirsa (3), Swan (1) Krishna (19) Tributaries- Bhadra (3), Bhima (10), (Ghataprabha (2), Malprabha (3), Muneru (1), Musi (2), Nira (1), Paleru (1), Tunga (1), Tungabhadra (6), Panchganga (3), Chandrabhaga (2) Mahi (9) Tributaries-Anas (1), Panam (1) Mahanadi (18) 127 28 55 54 11 38 Tributaries- Ib (4), Hasdeo (2), Kathajodi (1), Kharoon (4), Kuakhai (2), Sheonath (3), Birupa (1), Arpa (1), Kelo (2) Narmada (14) 15 Tributaries-Chhota Tawa (1) Contd. On Next Page
Contd. From Pre-Page 5 Pennar (5) Sabarmati (6) 8 Tributaries- Shedhi (1), Khari (1) 6 Subarnerekha (6) Tapi (11) 14 Tributaries-Girna (2), Rangawali (1) Medium rivers Ambika (1), Ulhas (2), Ulhas-Bhatsa (1), Ulhas-Kalu (1), Imphal (4), Mandovi (2), Palar (1), Pamba (3), Pariyar (3), Rushikulya (2), Tambiraparani (7), Achankoil (2), Chalakudy (1), Damanganga (6), Ghaggar (21), Kallada (1) , Kali-Karnataka (1), Manimala (2), Mindhola (1), Nagavalli (3), Amlakhadi (1), Chaliyar (2), Iril (2), Kharkhala (1), Karmana (1), Kolak(2), Kundalika(1), Meenachil(1), Muvattupuza(1), Patalganga(2), Umtrew(1), Vamanpuram(1), Zuari(2), Gumti(2), Kalna(1), Valvant(1), Madai(1), Khandepar(1), Asanora(1), Neyyar(1), Ithikkara(1), Kadalundy(1), Kuttiyady(1), Mahe(1), Kuppum(1), Neelsvaram(1), Karingoda(1), Chandergiri(1), Chitrapuzha(1), Nambul(2), Ganol(1), Simsang(1), Myntdu(1), Arasalar(1), Kodra(1), Haora(1), Markanda (2), Sukhna (1), Baleshwar Khadi (1), Netravati (1), Kumardhara (1), Purna (1), Kaveri (1), Dhadar (1) Lakes (55) Hussainsagar (1), Saroornagar (1), Himayatsagar (1), Pulicate (1), Salaulim (1), Kankoria (1), Ajwah (1), Sursagar (1), Brahamsarovar (1), Govindsagar (1), Pongdam (1), Renuka (1), Wuller (1), Dal (1), Ulsoor (1), Hebbala Valley (1) Oruvathikotta(1), Sasthamcotta(1), Ashthamudi(1), Paravur(1), Vembanad(1), Periyar(1), Kodumgallor(1), Kayamkula(1), Punnamadakayal(1), Pookotekayal(1), UpperLake(1), LowerLake(1), MultaiLake(1), Loktak(4), Umiam(1), Ward(1), Thadlaskena(1), Osteri(1), Bahour(1), Harike(2), Pichola(1), Udaisagar(1), RamgarhJaipur(1), Pushkar(1), Fatehsagar(1), Kalyana(1), Nakki(1), Udhagamadalam(1), Kodaikanal(1), Yercaud(1), LakshminarayanBaridigh(1), Rudrasagar(1), Ramgarh-UttarPradesh (1), Naini(1), Rabindrasarovar (1) Tanks (4) 117 61 Dharamsagar (1), Bibinagar (1), Kistrapetrareddy (1), Goysagar(1) Ponds (2) Elangabeel System (1), Lakshadweep (1) Creeks, Canals, Tanks, Ponds, Drains, Creeks (3), Agra Canal (1), Agartala Canal (1), Gurgaon Canal (1), Western Yamuna Canal (9), Drains (10) 25 Groundwater 218 Total 870
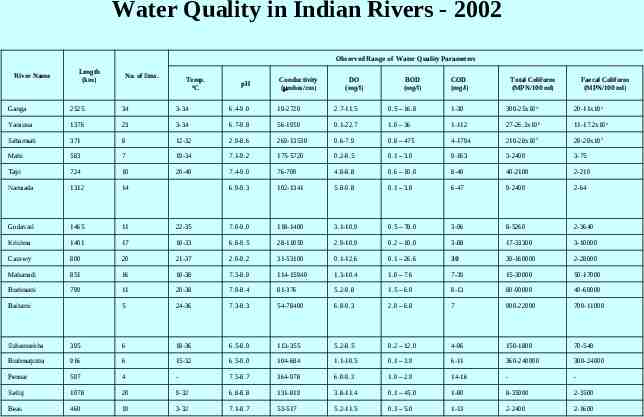
Water Quality in Indian Rivers - 2002 Observed Range of Water Quality Parameters River Name Length (km) No. of Stns. Temp. 0 C pH Conductivity ( mhos/cm) DO (mg/l) BOD (mg/l) COD (mg/l) Total Coliform (MPN/100 ml) Faecal Coliform (MPN/100 ml) Ganga 2525 34 3-34 6.4-9.0 19-2720 2.7-11.5 0.5 – 16.8 1-30 300-25x105 20-11x105 Yamuna 1376 23 3-34 6.7-9.8 56-1959 0.1-22.7 1.0 – 36 1-112 27-26.3x10⁶ 11-17.2x10⁵ Sabarmati 371 8 12-32 2.9-8.6 269-13530 0.6-7.9 0.8 – 475 4-1794 210-28x105 28-28x105 Mahi 583 7 19-34 7.1-9.2 175-5720 0.2-8.5 0.1 – 3.0 9-163 3-2400 3-75 Tapi 724 10 20-40 7.4-9.0 76-700 4.8-8.8 0.6 – 10.0 8-40 40-2100 2-210 Narmada 1312 14 6.9-9.3 102-1341 5.8-9.8 0.1 – 3.8 6-47 9-2400 2-64 Godavari 1465 11 22-35 7.0-9.0 118-1400 3.1-10.9 0.5 – 78.0 3-96 8-5260 2-3640 Krishna 1401 17 18-33 6.8-9.5 28-11050 2.9-10.9 0.2 – 10.0 3-88 17-33300 3-10000 Cauvery 800 20 21-37 2.0-9.2 31-53100 0.1-12.6 0.1 – 26.6 30 39-160000 2-28000 Mahanadi 851 16 18-38 7.3-8.9 114-15940 1.3-10.4 1.0 – 7.6 7-39 15-30000 50-17000 Brahmani 799 11 20-38 7.0-8.4 81-376 5.2-9.8 1.5 – 6.0 8-13 80-90000 40-60000 5 24-36 7.3-8.3 54-78400 6.8-9.3 2.0 – 6.8 7 900-22000 700-11000 Baitarni Subarnrekha 395 6 18-36 6.5-8.0 113-355 5.2-8.5 0.2 – 12.0 4-96 150-1800 70-540 Brahmaputra 916 6 15-32 6.5-9.0 104-684 1.1-10.5 0.1 – 3.9 6-11 360-240000 300-24000 Pennar 597 4 - 7.5-8.7 364-978 6.0-9.3 1.0 – 2.9 14-16 - - Satluj 1078 20 9-32 6.8-8.8 131-819 3.8-11.4 0.1 – 45.0 1-80 8-35000 2-3500 Beas 460 19 3-32 7.1-8.7 53-517 5.2-11.5 0.3 – 5.0 1-13 2-2400 2-1600
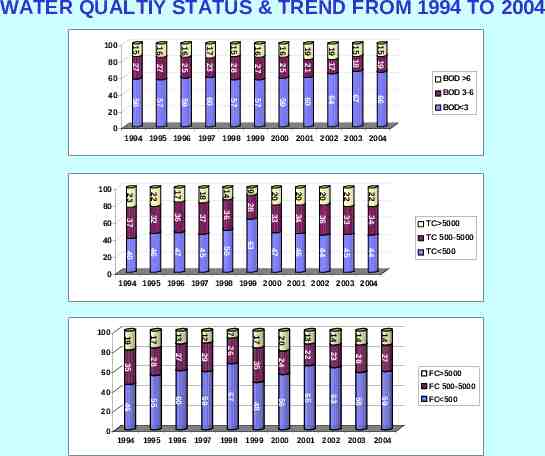
WATER QUALTIY STATUS & TREND FROM 1994 TO 2004 15 19 15 18 19 17 19 21 27 16 25 16 28 25 15 16 27 17 23 16 80 15 27 100 66 67 64 60 59 57 20 57 60 BOD 3-6 59 40 57 BOD 6 58 60 BOD 3 0 1994 1995 1996 1997 1998 1999 2000 2001 2002 2003 2004 20 20 22 22 34 36 33 34 36 33 14 37 20 18 36 TC 5000 TC 500-5000 TC 500 44 45 44 46 47 63 50 45 47 46 40 20 28 17 32 40 9 22 60 37 80 23 100 0 1994 1995 1996 1997 1998 1999 2000 2001 2002 2003 2004 14 14 14 22 23 28 27 24 13 20 35 26 17 7 29 59 58 63 1994 1995 1996 1997 1998 1999 2000 65 48 56 67 59 60 55 46 0 FC 5000 FC 500-5000 40 20 12 28 35 60 27 80 13 17 19 100 2001 2002 2003 2004 FC 500
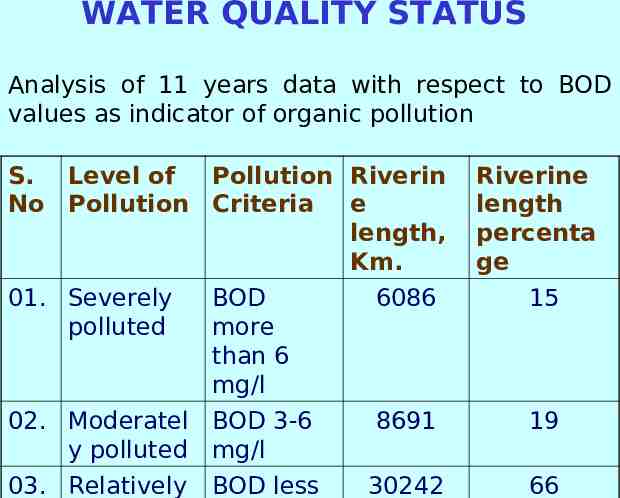
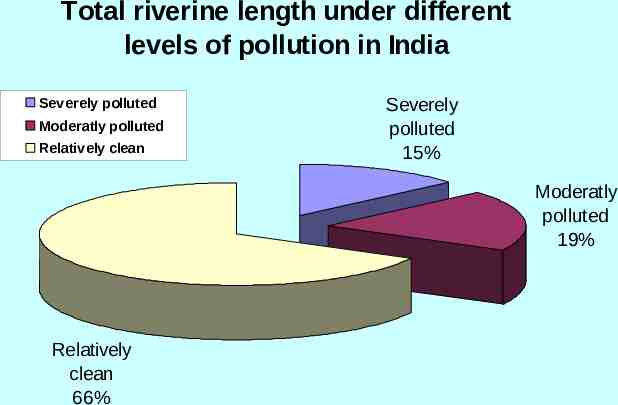
WATER QUALITY STATUS Analysis of 11 years data with respect to BOD values as indicator of organic pollution S. Level of Pollution Riverin No Pollution Criteria e length, Km. 01. Severely polluted BOD more than 6 mg/l 02. Moderatel BOD 3-6 y polluted mg/l 03. Relatively BOD less Riverine length percenta ge 6086 15 8691 19 30242 66
Total riverine length under different levels of pollution in India Severely polluted Moderatly polluted Relatively clean Severely polluted 15% Moderatly polluted 19% Relatively clean 66%
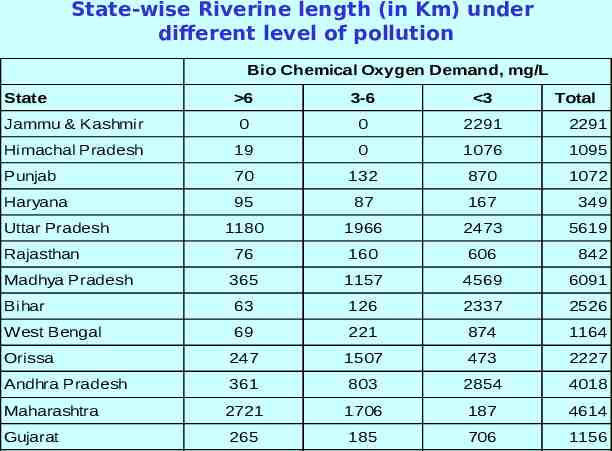
State-wise Riverine length (in Km) under different level of pollution Bio Chemical Oxygen Demand, mg/L State 6 3-6 3 Jammu & Kashmir 0 0 2291 2291 Himachal Pradesh 19 0 1076 1095 Punjab 70 132 870 1072 Haryana 95 87 167 349 1180 1966 2473 76 160 606 365 1157 4569 6091 Bihar 63 126 2337 2526 West Bengal 69 221 874 1164 Orissa 247 1507 473 2227 Andhra Pradesh 361 803 2854 4018 2721 1706 187 4614 265 185 706 1156 Uttar Pradesh Rajasthan Madhya Pradesh Maharashtra Gujarat Total 5619 842
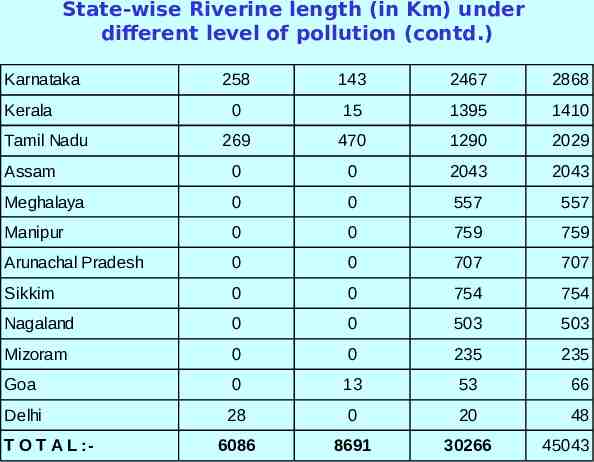
State-wise Riverine length (in Km) under different level of pollution (contd.) Karnataka 258 143 2467 2868 0 15 1395 1410 269 470 1290 2029 Assam 0 0 2043 2043 Meghalaya 0 0 557 557 Manipur 0 0 759 759 Arunachal Pradesh 0 0 707 707 Sikkim 0 0 754 754 Nagaland 0 0 503 503 Mizoram 0 0 235 235 Goa 0 13 53 66 Delhi 28 0 20 48 6086 8691 30266 Kerala Tamil Nadu T O T A L :- 45043
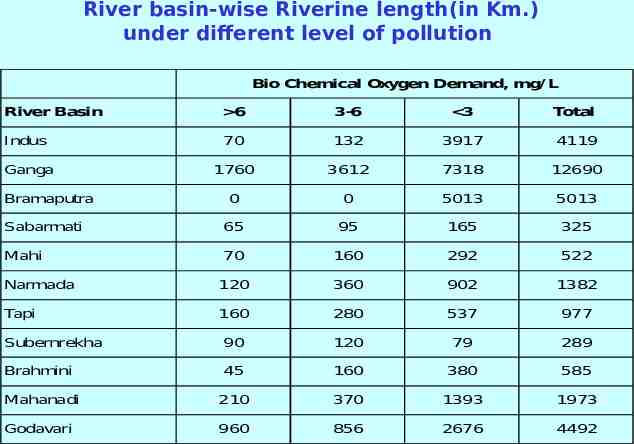
River basin-wise Riverine length(in Km.) under different level of pollution Bio Chemical Oxygen Demand, mg/ L River Basin 6 3-6 3 Total Indus 70 132 3917 4119 1760 3612 7318 12690 0 0 5013 5013 Sabarmati 65 95 165 325 Mahi 70 160 292 522 Narmada 120 360 902 1382 Tapi 160 280 537 977 Subernrekha 90 120 79 289 Brahmini 45 160 380 585 Mahanadi 210 370 1393 1973 Godavari 960 856 2676 4492 Ganga Bramaputra
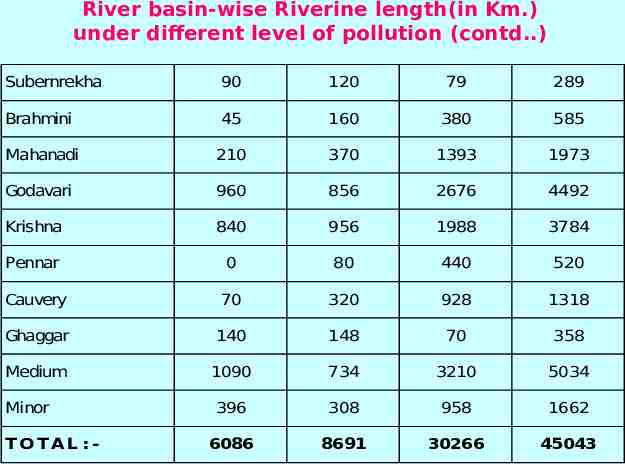
River basin-wise Riverine length(in Km.) under different level of pollution (contd.) Subernrekha 90 120 79 289 Brahmini 45 160 380 585 Mahanadi 210 370 1393 1973 Godavari 960 856 2676 4492 Krishna 840 956 1988 3784 Pennar 0 80 440 520 Cauvery 70 320 928 1318 Ghaggar 140 148 70 358 Medium 1090 734 3210 5034 396 308 958 1662 6086 8691 30266 45043 Minor TOTAL : -
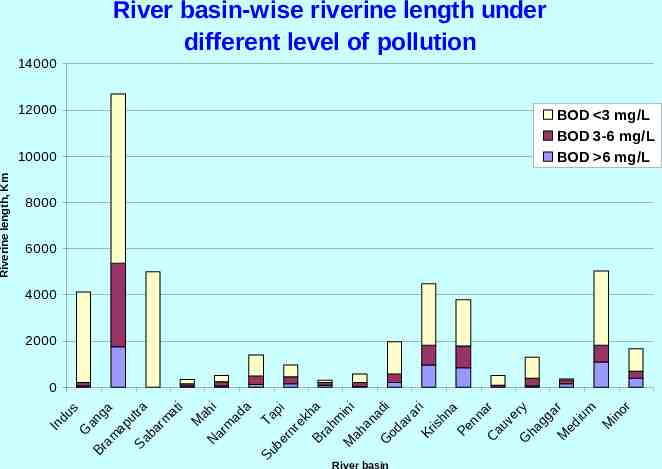
River basin-wise riverine length under different level of pollution 14000 12000 BOD 3 mg/L BOD 3-6 mg/L BOD 6 mg/L 8000 6000 4000 2000 Su T be api rn re kh a Br ah m in M i ah an ad G od i av ar i Kr is hn a Pe nn ar C au ve ry G ha gg ar M ed iu m M in or 0 In du s G Br ang a am ap ut ra Sa ba rm at i M ah N i ar m ad a Riverine length, Km 10000 River basin
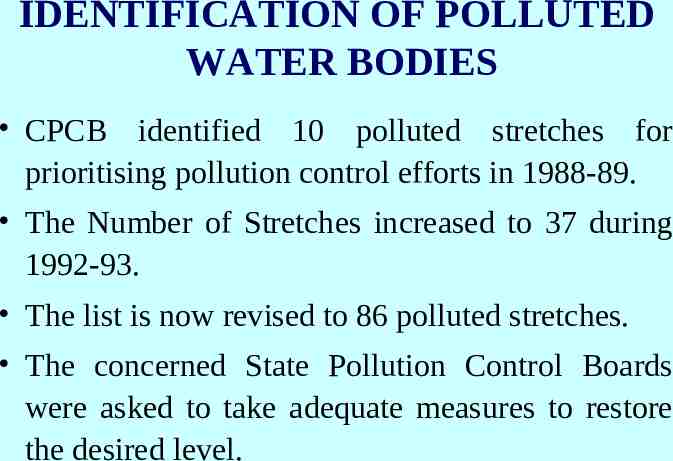
IDENTIFICATION OF POLLUTED WATER BODIES CPCB identified 10 polluted stretches for prioritising pollution control efforts in 1988-89. The Number of Stretches increased to 37 during 1992-93. The list is now revised to 86 polluted stretches. The concerned State Pollution Control Boards were asked to take adequate measures to restore the desired level.
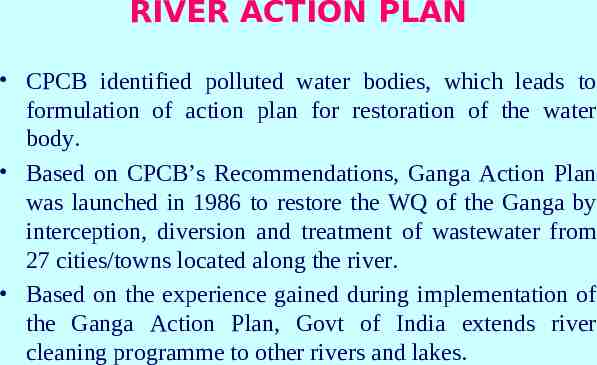
RIVER ACTION PLAN CPCB identified polluted water bodies, which leads to formulation of action plan for restoration of the water body. Based on CPCB’s Recommendations, Ganga Action Plan was launched in 1986 to restore the WQ of the Ganga by interception, diversion and treatment of wastewater from 27 cities/towns located along the river. Based on the experience gained during implementation of the Ganga Action Plan, Govt of India extends river cleaning programme to other rivers and lakes.
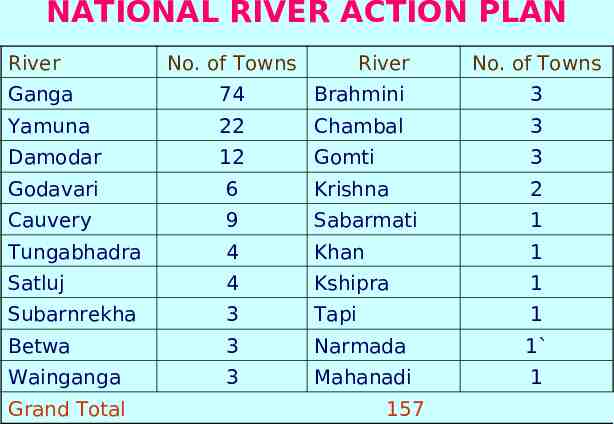
NATIONAL RIVER ACTION PLAN River No. of Towns River No. of Towns Ganga 74 Brahmini 3 Yamuna 22 Chambal 3 Damodar 12 Gomti 3 Godavari 6 Krishna 2 Cauvery 9 Sabarmati 1 Tungabhadra 4 Khan 1 Satluj 4 Kshipra 1 Subarnrekha 3 Tapi 1 Betwa 3 Narmada 1 Wainganga 3 Mahanadi 1 Grand Total 157