Software Project Management Lecture 8 Software Project


42 Slides387.00 KB
Software Project Management Lecture 8 Software Project Performance Tracking and Monitoring
Overview Importance of tracking and monitoring Creating a management framework Tracking the performance Monitoring the progress and resource Getting project on the right track Software Project Management 2
Importance of tracking and monitoring Make sure the project Can be delivered on time and within budget Is of good quality Meets client’s needs Software Project Management 3
What can go wrong in product? Inadequate functionality of a product Poor quality of a product Related to software requirements specification Related to quality management Late delivery of the product Overly exceeding the budget Software Project Management 4
Planning, Tracking and Monitoring Planning Tracking Know where we want to go Know where we are Monitoring How to go from where we are to where we want to go Software Project Management 5
Tracking Finding out what is happening Need a plan and schedule To collect data Software Project Management 6
Monitoring Comparing the current status with the targets Need a plan, a schedule, collected data To exercise control over the project To ensure the targets are met To devise contingency plans Software Project Management 7
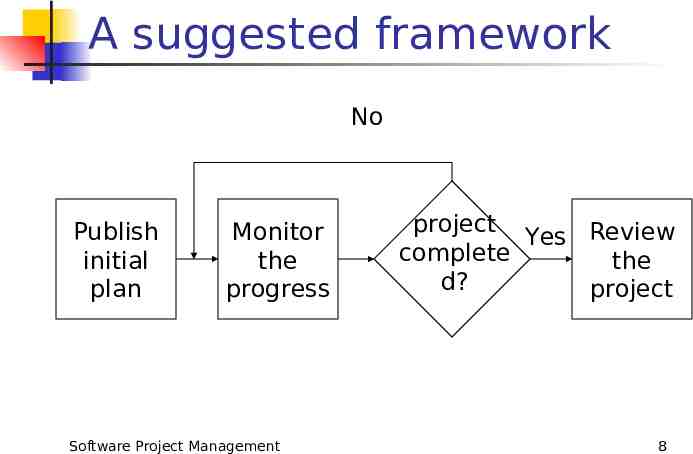
A suggested framework No Publish initial plan Monitor the progress Software Project Management project Yes Review complete the d? project 8
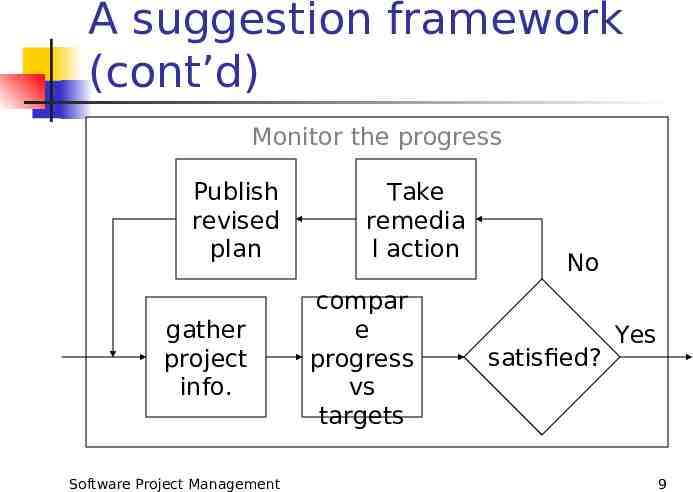
A suggestion framework (cont’d) Monitor the progress Publish revised plan gather project info. Software Project Management Take remedia l action compar e progress vs targets No satisfied? Yes 9
Tracking the performance Setting check points Collecting data Software Project Management 10
Check Point Based on regular time intervals Can be weekly or monthly or quarterly Depend on what to check and how to Based on a particular event At the end of each activity In the middle of a critical activity Software Project Management 11
Check Point (cont’d) Should be set before the plan was published Make sure everyone knows when and what the check points are Software Project Management 12
Collecting data Partial completion report Risk report Software Project Management 13
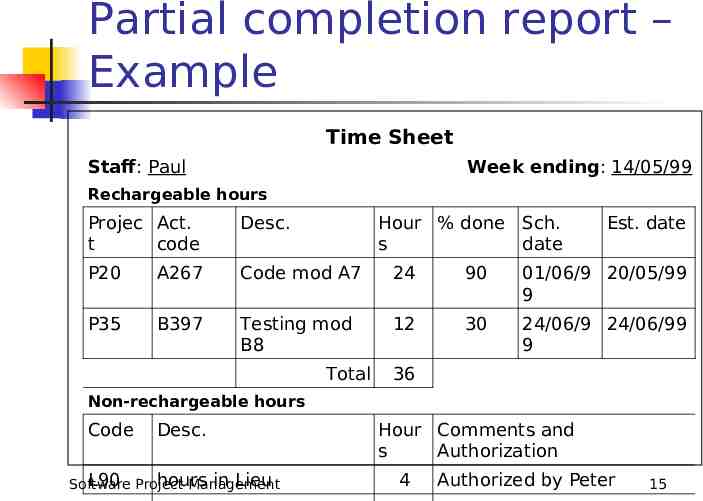
Partial completion report Indicate the work done by the personnel and the time spent on the work Optional items likelihood of failing to complete the task by the scheduled date Estimated time of completion Software Project Management 14
Partial completion report – Example Time Sheet Staff: Paul Week ending: 14/05/99 Rechargeable hours Projec Act. t code Desc. Hour % done Sch. s date P20 A267 Code mod A7 24 90 01/06/9 20/05/99 9 P35 B397 Testing mod B8 12 30 24/06/9 24/06/99 9 Total Est. date 36 Non-rechargeable hours Code Desc. L90 Project hours in Lieu Software Management Hour Comments and s Authorization 4 Authorized by Peter 15
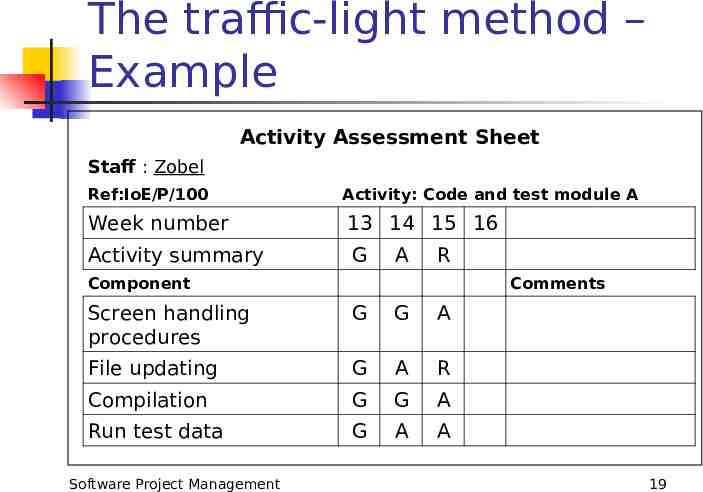
Risk reporting Indicate the likelihood of meeting the scheduled target date Instead of asking the estimated completion date Use the traffic-light method Software Project Management 16
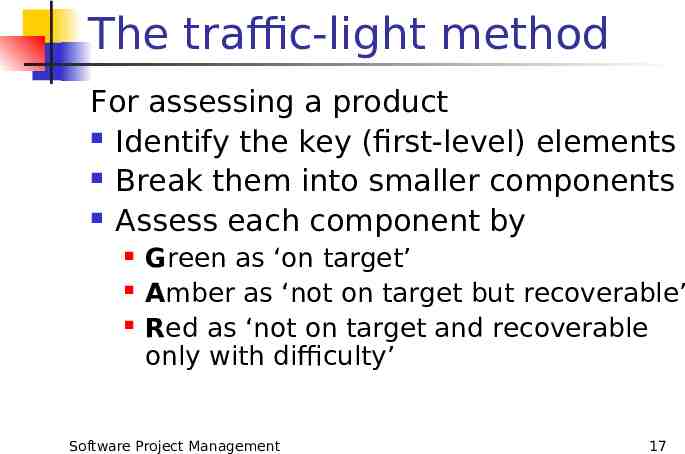
The traffic-light method For assessing a product Identify the key (first-level) elements Break them into smaller components Assess each component by Green as ‘on target’ Amber as ‘not on target but recoverable’ Red as ‘not on target and recoverable only with difficulty’ Software Project Management 17
The traffic-light method (Cont’d) Assess the key-level element based on the assessments of their components Assess the overall product based on all the assessments (key elements and their components) Software Project Management 18
The traffic-light method – Example Activity Assessment Sheet Staff : Zobel Ref:IoE/P/100 Activity: Code and test module A Week number 13 14 15 16 Activity summary G A R Component Comments Screen handling procedures G G A File updating G A R Compilation G G A Run test data G A A Software Project Management 19
Monitoring the progress Need to monitor time Need to monitor cost Software Project Management 20
Monitoring the time Tools for visualizing the progress Presenting the collected data in a way that is easy to understand Help to easily identify the problem activities or areas that need to be taken care of Software Project Management 21
Visualizing Techniques The Gantt chart A static picture showing the current progress of the project The Timeline A dynamic picture showing the progress of the project and how the project has changed through time Software Project Management 22
The Gantt Chart An activity bar chart showing the activities, their scheduled dates and duration the reported progress of the activities; ‘today cursor’ Software Project Management 23
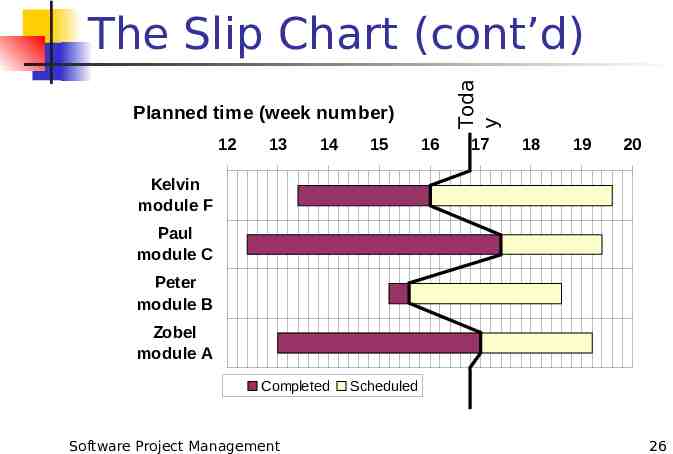
Toda y The Gantt Chart (cont’d) Planned time (week number) 12 13 14 15 16 17 18 19 20 Kelvin module F Paul module C Peter module B Zobel module A Completed Software Project Management Scheduled 24
Toda y The Slip Chart (cont’d) Planned time (week number) 12 13 14 15 16 17 18 19 20 Kelvin module F Paul module C Peter module B Zobel module A Completed Software Project Management Scheduled 26
The Timeline A plot of the elapsed time against the planned time of the activities indicating the actual progress of the activities; and the rescheduled activities by the end of each week show where and when the targets have changed through the life of a project Software Project Management 27
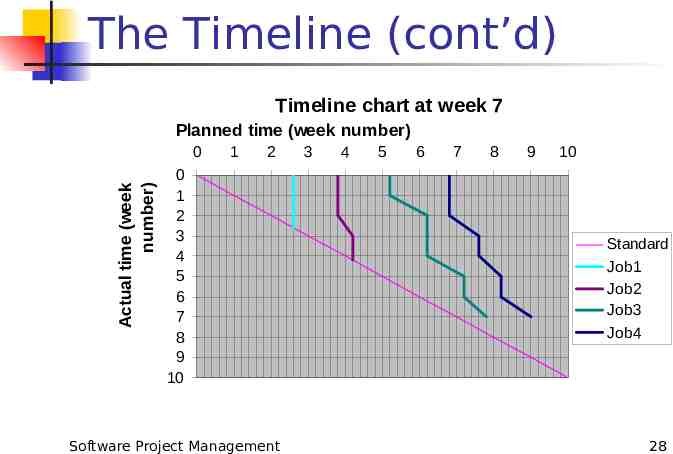
The Timeline (cont’d) Timeline chart at week 7 Planned time (week number) Actual time (week number) 0 1 2 0 1 2 3 4 5 6 7 8 9 10 Software Project Management 3 4 5 6 7 8 9 10 Standard Job1 Job2 Job3 Job4 28
The Timeline (cont’d) Can show the slippage of the activities through the life of the project The Gantt chart cannot Help to analyze and understand the trends and reason for changes to avoid slippage in future projects Software Project Management 29
Monitoring the Cost Earned Value Analysis A cost monitoring technique recommended by DoD of US and Australia Software Project Management 30
Earned Value Analysis Produce a baseline budget from the project plan Calculate the earned value of each activity Earned value time for an activity / total time for the project E.g. earned value number of days for an activity / number of days for the project Software Project Management 31
Earned Value Analysis (cont’d) Monitor the earned value Once an activity is completed, its elapsed time is recorded and its earned value (EV) is accumulated to the cumulative EV Software Project Management 32
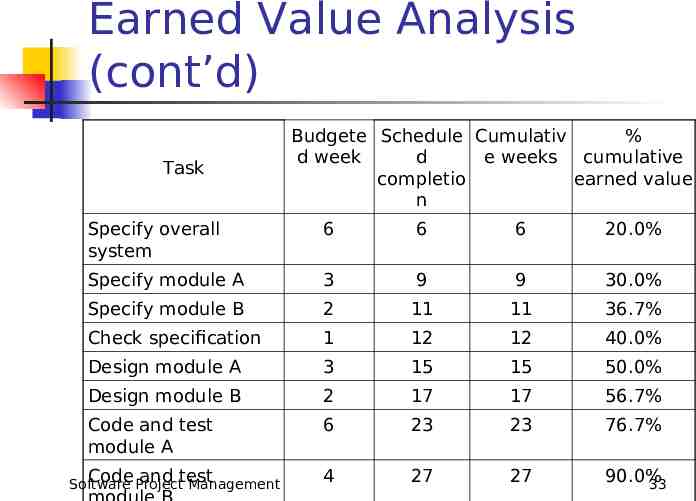
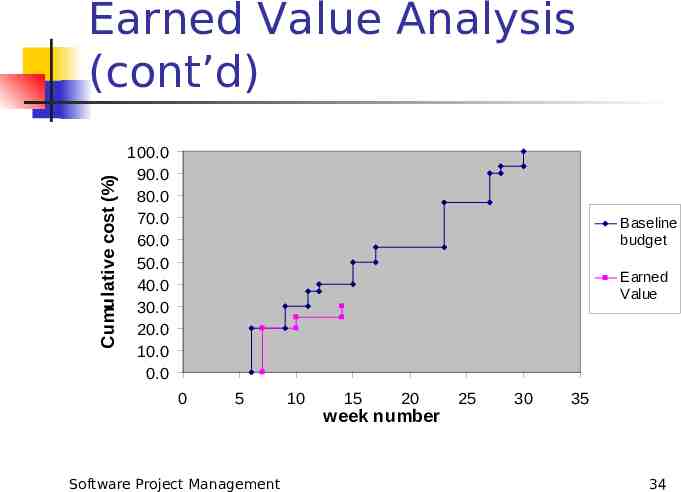
Earned Value Analysis (cont’d) Task Budgete Schedule Cumulativ % d week d e weeks cumulative completio earned value n Specify overall system 6 6 6 20.0% Specify module A 3 9 9 30.0% Specify module B 2 11 11 36.7% Check specification 1 12 12 40.0% Design module A 3 15 15 50.0% Design module B 2 17 17 56.7% Code and test module A 6 23 23 76.7% 4 27 27 90.0% 33 Code Project and test Software Management
Cumulative cost (%) Earned Value Analysis (cont’d) 100.0 90.0 80.0 70.0 60.0 50.0 40.0 30.0 20.0 10.0 0.0 Baseline budget Earned Value 0 5 Software Project Management 10 15 20 week number 25 30 35 34
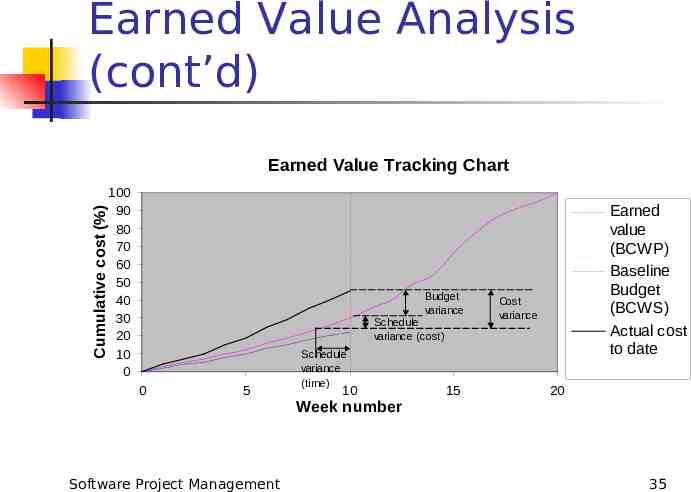
Earned Value Analysis (cont’d) Earned Value Tracking Chart Cumulative cost (%) 100 90 80 70 60 50 40 30 20 10 0 Budget variance Schedule variance (cost) 0 5 Software Project Management Schedule variance (time) 10 Week number 15 Earned value (BCWP) Baseline Budget (BCWS) Actual cost to date Cost variance 20 35
Earned Value Analysis (cont’d) Budget variance Actual cost to date - Baseline budget Indicates how actual cost differs from the planned cost Software Project Management 36
Earned Value Analysis (cont’d) Schedule variance Earned Value – Baseline budget Indicates how the actual schedule differs from the planned schedule Schedule performance index Earned Value / Baseline budget SPI 1 means “better than planned” SPI 1 means “slower than planned” Software Project Management 37
Earned Value Analysis (cont’d) Cost variance Earned Value – Actual cost to date Indicates how the planned cost differs from actual cost Cost Performance index, CPI Earned Value / Actual cost to date CPI 1 means “better than planned” CPI 1 means “slower than planned” Software Project Management 38
Prioritizing Monitoring Priority list of activity to monitor Critical activities Non-critical activities with no free float Non-critical activities with less than a specified float High risk activities Activities with critical resources Software Project Management 39
Bringing the Project Back to Target You are now behind the schedule Possible actions: Reschedule the target date Reschedule other activities with shorter duration Reorder the activities Software Project Management 40
Shorten the Critical Activities Putting pressure on the personnel Increasing the resources Personnel work longer hours Additional analysts to interview users Competent programmer to code modules in the critical activity Software Project Management 41
Reorder the activities Relax the constraints on the start of an activity before the completion of the previous one Subdivide the components of an activity so that they can be done in parallel Software Project Management 42
References Hughes, B., and Cotterell, M. (1999) Software Project Management, 2nd ed., McGraw Hill. Down, A., Coleman, M., and Absolon, P. (1994) Risk Management for Software projects, McGraw Hill. Software Project Management 43