Sight Distances CE 453 Lecture 8


39 Slides1.40 MB
Sight Distances CE 453 Lecture 8
Objectives 1. Know 5 types of sight distance and important determinants
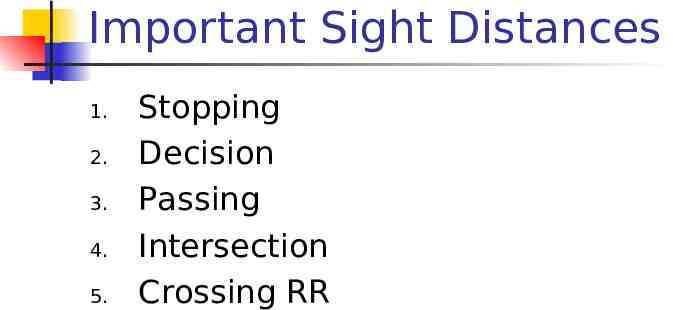
Important Sight Distances 1. 2. 3. 4. 5. Stopping Decision Passing Intersection Crossing RR
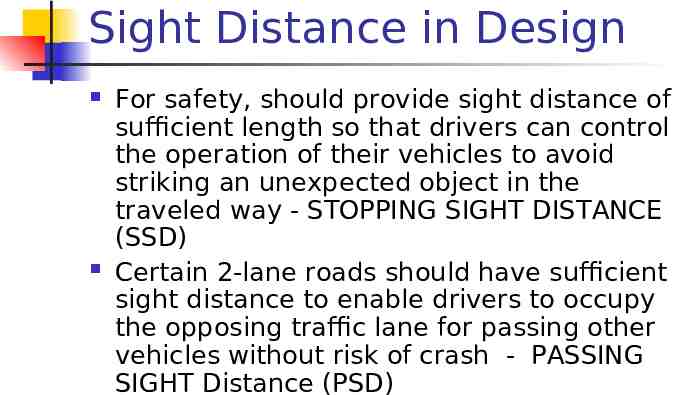
Sight Distance in Design For safety, should provide sight distance of sufficient length so that drivers can control the operation of their vehicles to avoid striking an unexpected object in the traveled way - STOPPING SIGHT DISTANCE (SSD) Certain 2-lane roads should have sufficient sight distance to enable drivers to occupy the opposing traffic lane for passing other vehicles without risk of crash - PASSING SIGHT Distance (PSD)
Green Book (AASHTO) Policy Question Sight distance assumes drivers are traveling at: A. The posted speed limit B. 10 mph above the speed limit C. The 85% percentile spot speed of the facility D. The design speed of the facility
Design Policy - Response Sight distance assumes drivers are traveling at: A. The posted speed limit B. 10 mph above the speed limit C. The 85% percentile spot speed of the facility D. The design speed of the facility
GB Question Stopping sight distance is composed of two distances, what are they?
GB Question with response Stopping sight distance is composed of two distances, what are they? Distance traveled during perception/reaction time Distance required to physically brake vehicle
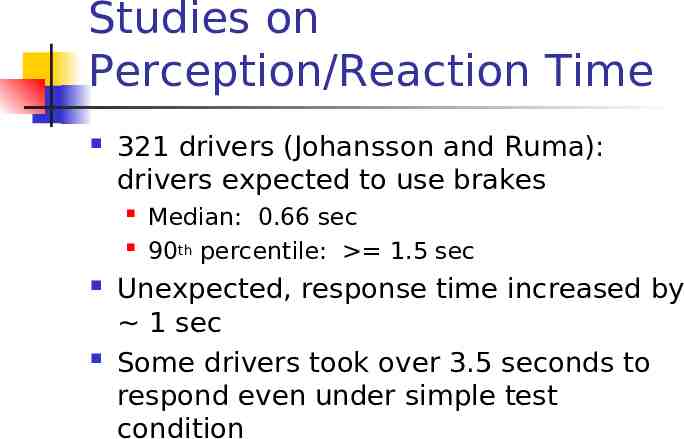
Studies on Perception/Reaction Time 321 drivers (Johansson and Ruma): drivers expected to use brakes Median: 0.66 sec 90th percentile: 1.5 sec Unexpected, response time increased by 1 sec Some drivers took over 3.5 seconds to respond even under simple test condition
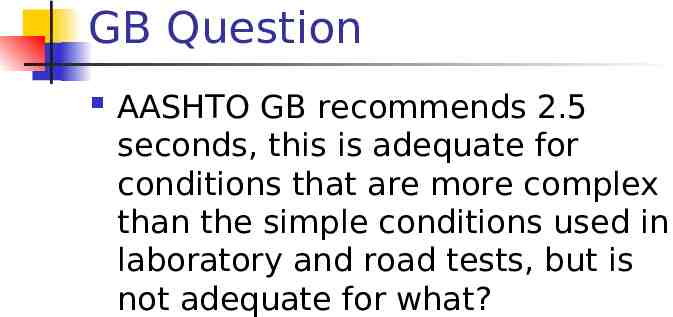
GB Question AASHTO GB recommends 2.5 seconds, this is adequate for conditions that are more complex than the simple conditions used in laboratory and road tests, but is not adequate for what?
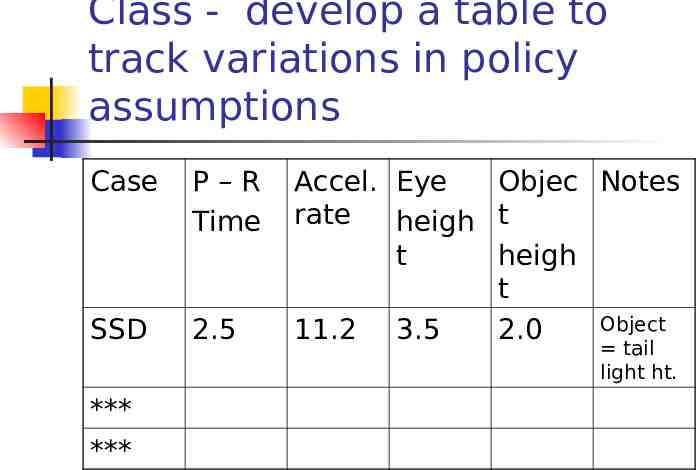
Class - develop a table to track variations in policy assumptions Case P–R Time SSD 2.5 *** *** Accel. Eye Objec Notes rate heigh t t heigh t Object 11.2 3.5 2.0 tail light ht.
Sight distance Distance a driver can see ahead at any specific time Must allow sufficient distance for a driver to perceive/react and stop, swerve etc when necessary
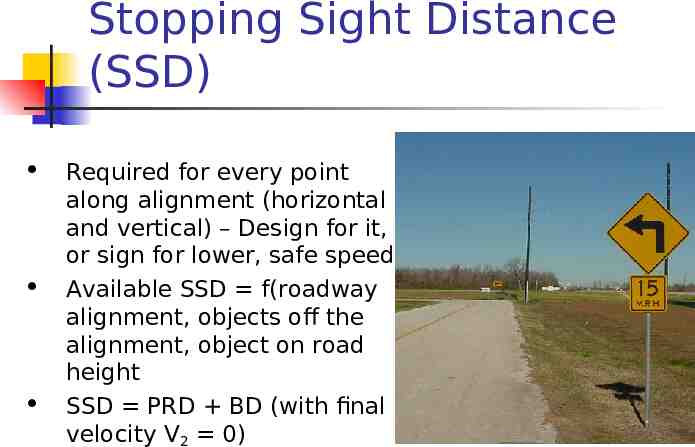
Stopping Sight Distance (SSD) Required for every point along alignment (horizontal and vertical) – Design for it, or sign for lower, safe speed Available SSD f(roadway alignment, objects off the alignment, object on road height SSD PRD BD (with final velocity V2 0)
Criteria for Sight Distance Driver eye height: for passenger vehicle’s 3.5 ft above surface Height of object in roadway 2 feet (SSD) – why? Height of opposing vehicle 3.5 feet (PSD)
Deceleration rate: AASHTO: 11.2 ft/s2 Deceleration is within capability of drivers to stay within their lane and control the vehicle when braking on wet surfaces and is comfortable for most drivers AASHTO represents friction as a/g which is a function of the roadway, tires, etc Can use when deceleration is known (usually not)
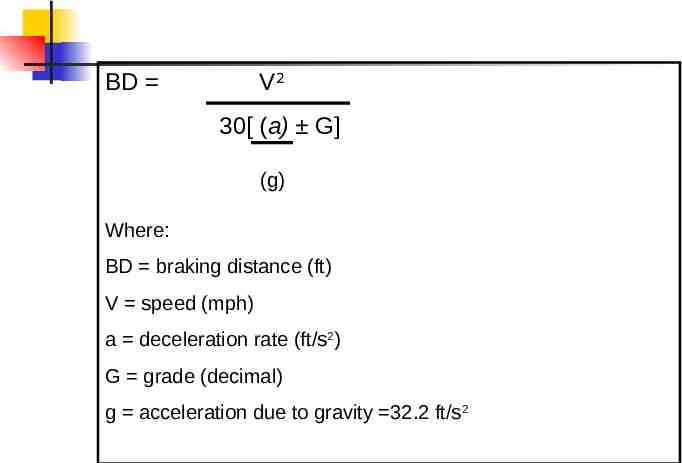
BD V2 30[ (a) G] (g) Where: BD braking distance (ft) V speed (mph) a deceleration rate (ft/s2) G grade (decimal) g acceleration due to gravity 32.2 ft/s2
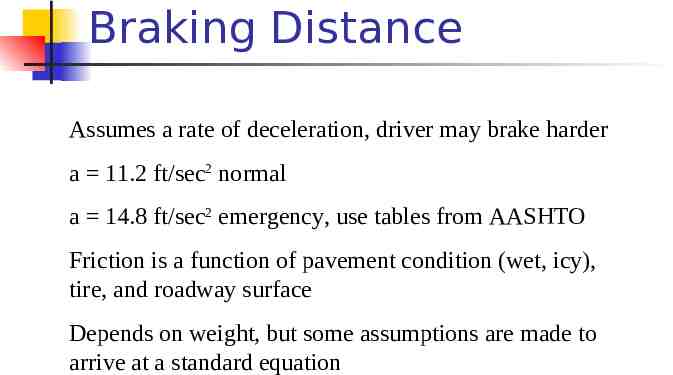
Braking Distance Assumes a rate of deceleration, driver may brake harder a 11.2 ft/sec2 normal a 14.8 ft/sec2 emergency, use tables from AASHTO Friction is a function of pavement condition (wet, icy), tire, and roadway surface Depends on weight, but some assumptions are made to arrive at a standard equation
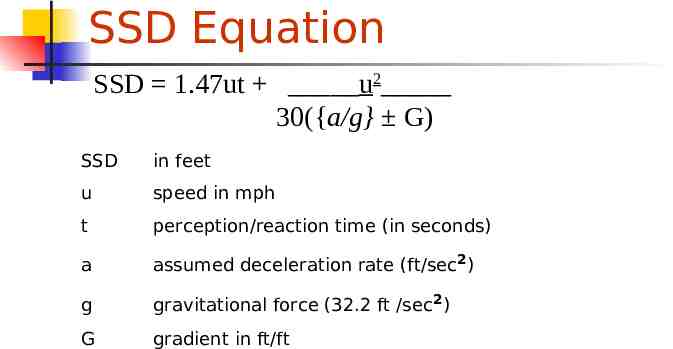
SSD Equation SSD 1.47ut u2 30({a/g} G) SSD in feet u speed in mph t perception/reaction time (in seconds) a assumed deceleration rate (ft/sec2) g gravitational force (32.2 ft /sec2) G gradient in ft/ft
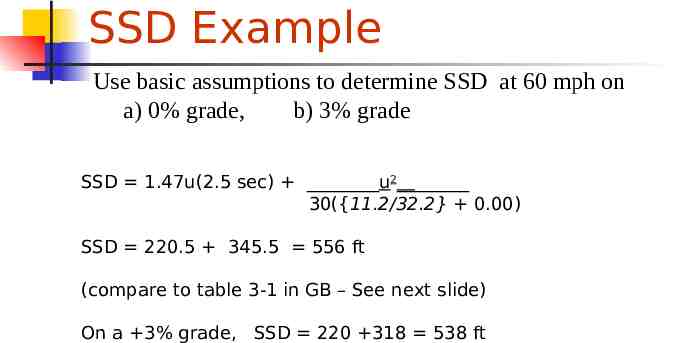
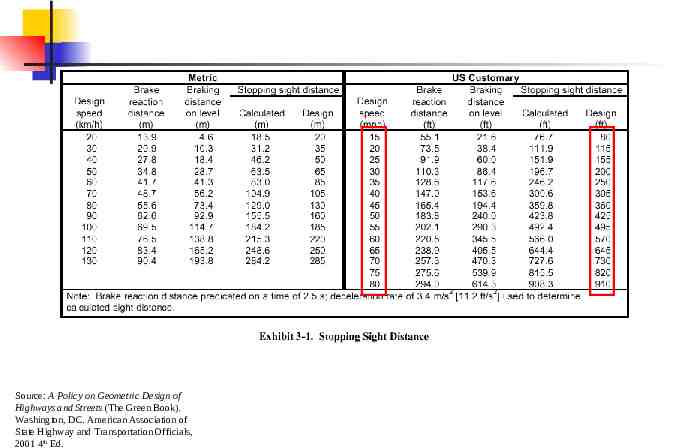
SSD Example Use basic assumptions to determine SSD at 60 mph on a) 0% grade, b) 3% grade SSD 1.47u(2.5 sec) u2 30({11.2/32.2} 0.00) SSD 220.5 345.5 556 ft (compare to table 3-1 in GB – See next slide) On a 3% grade, SSD 220 318 538 ft
Stopping (emergency) – SSD (Table 3-1) Source: A Policy on Geometric Design of Highways and Streets (The Green Book). Washington, DC. American Association of State Highway and Transportation Officials, 2001 4th Ed.
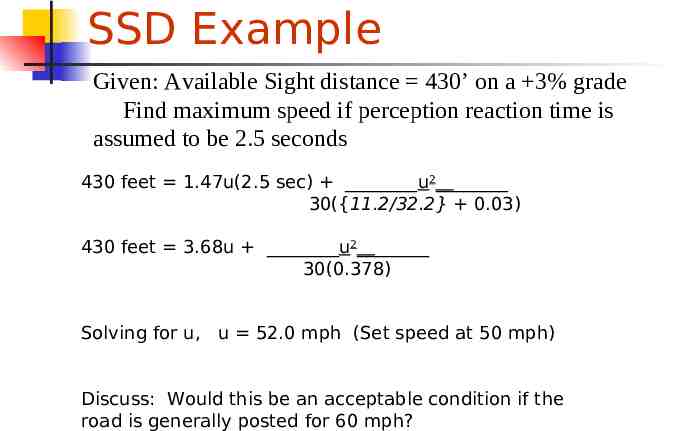
SSD Example Given: Available Sight distance 430’ on a 3% grade Find maximum speed if perception reaction time is assumed to be 2.5 seconds 430 feet 1.47u(2.5 sec) u2 30({11.2/32.2} 0.03) 430 feet 3.68u u2 30(0.378) Solving for u, u 52.0 mph (Set speed at 50 mph) Discuss: Would this be an acceptable condition if the road is generally posted for 60 mph?
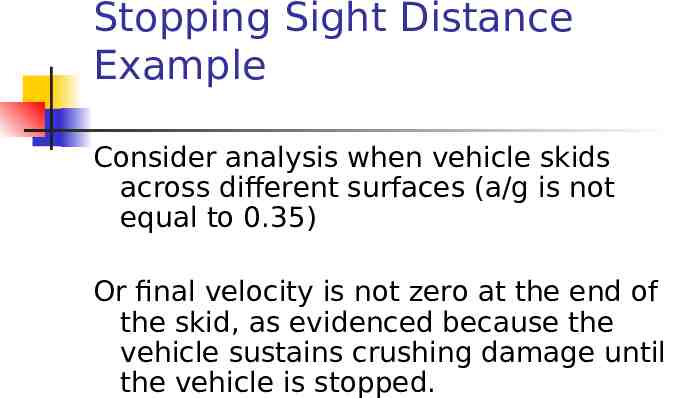
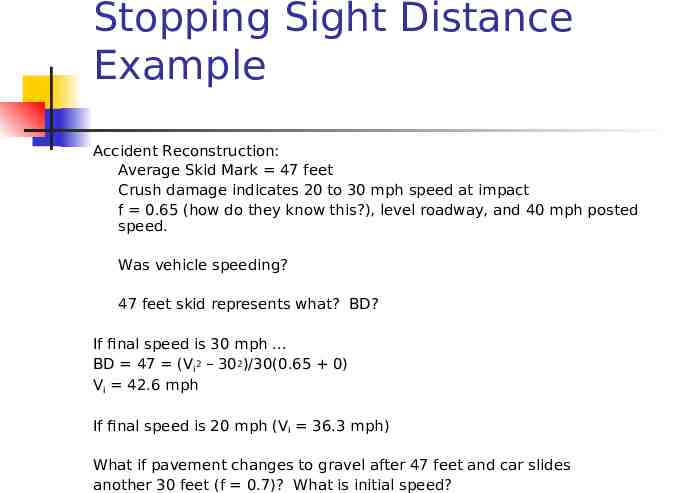
Stopping Sight Distance Example Consider analysis when vehicle skids across different surfaces (a/g is not equal to 0.35) Or final velocity is not zero at the end of the skid, as evidenced because the vehicle sustains crushing damage until the vehicle is stopped.
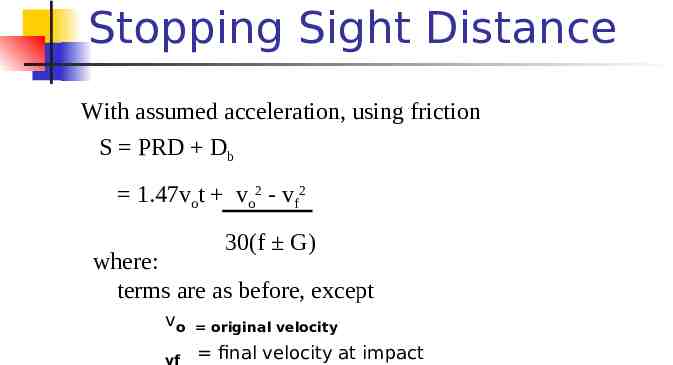
Stopping Sight Distance With assumed acceleration, using friction S PRD Db 1.47vot vo2 - vf2 30(f G) where: terms are as before, except vo original velocity vf final velocity at impact
Stopping Sight Distance Example Accident Reconstruction: Average Skid Mark 47 feet Crush damage indicates 20 to 30 mph speed at impact f 0.65 (how do they know this?), level roadway, and 40 mph posted speed. Was vehicle speeding? 47 feet skid represents what? BD? If final speed is 30 mph BD 47 (Vi2 – 302)/30(0.65 0) Vi 42.6 mph If final speed is 20 mph (Vi 36.3 mph) What if pavement changes to gravel after 47 feet and car slides another 30 feet (f 0.7)? What is initial speed?
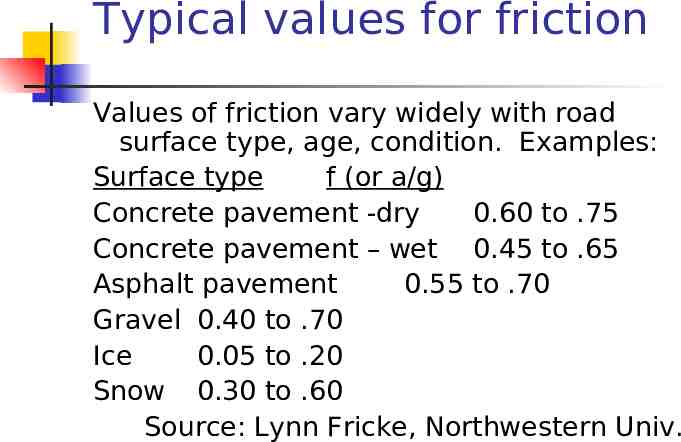
Typical values for friction Values of friction vary widely with road surface type, age, condition. Examples: Surface type f (or a/g) Concrete pavement -dry 0.60 to .75 Concrete pavement – wet 0.45 to .65 Asphalt pavement 0.55 to .70 Gravel 0.40 to .70 Ice 0.05 to .20 Snow 0.30 to .60 Source: Lynn Fricke, Northwestern Univ.
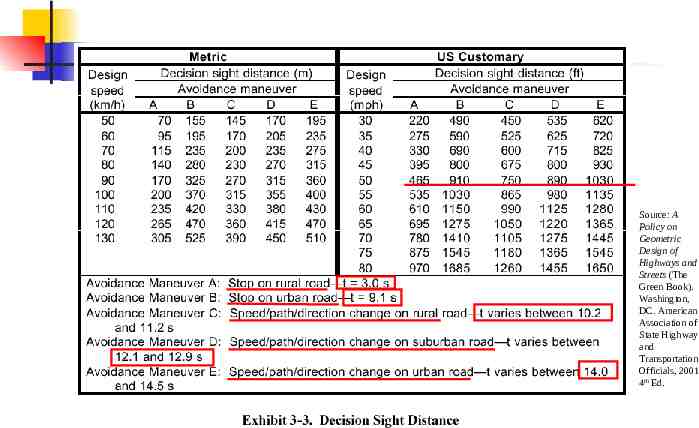
Decision Sight Distance SSD are sufficient to allow reasonably competent and alert drivers to come to a hurried stop under ordinary circumstances May be inadequate when drivers must make complex or instantaneous decisions, when information is difficult to perceive or when unexpected or unusual maneuvers are required Equations in book, use tables
Decision Sight Distance When situation is unexpected or driver makes unusual maneuvers or under difficult to perceive situations Requires higher P/R time Depends on type of maneuver made and roadway setting (urban vs. rural) Use table 3.5 from Text, page 75
Decision (controlled stop, speed/path/route change) – DSD (Table 3-3) Source: A Policy on Geometric Design of Highways and Streets (The Green Book). Washington, DC. American Association of State Highway and Transportation Officials, 2001 4th Ed.
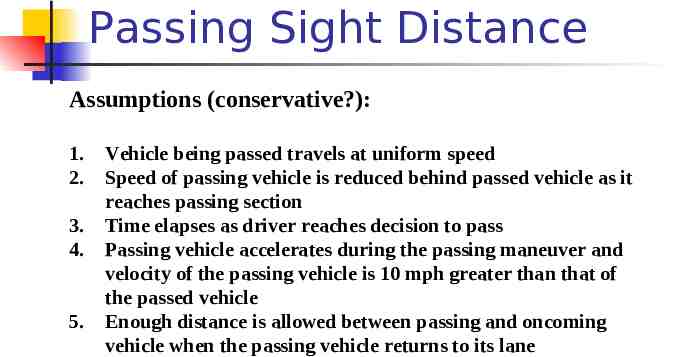
Passing Sight Distance Assumptions (conservative?): 1. 2. 3. 4. 5. Vehicle being passed travels at uniform speed Speed of passing vehicle is reduced behind passed vehicle as it reaches passing section Time elapses as driver reaches decision to pass Passing vehicle accelerates during the passing maneuver and velocity of the passing vehicle is 10 mph greater than that of the passed vehicle Enough distance is allowed between passing and oncoming vehicle when the passing vehicle returns to its lane
Source: A Policy on Geometric Design of Highways and Streets (The Green Book). Washington, DC. American Association of State Highway and Transportation Officials, 2001 4th Ed.
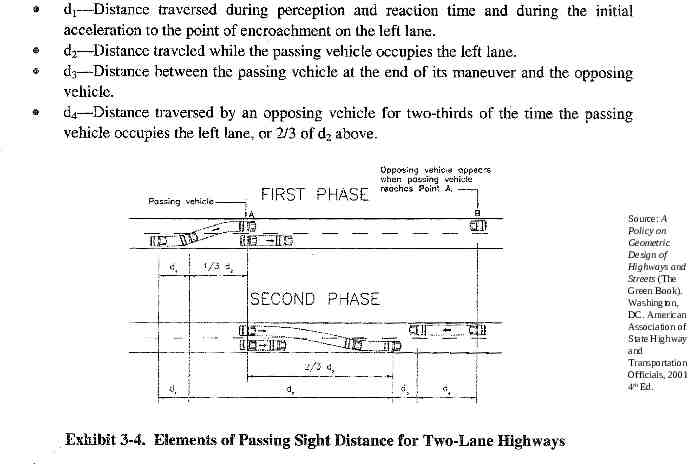
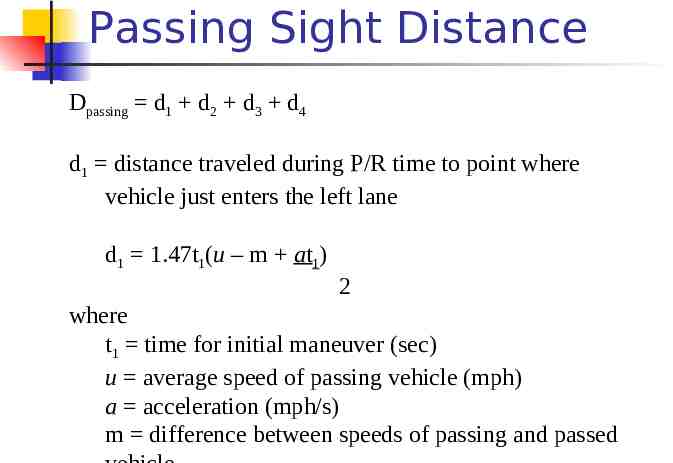
Passing Sight Distance Dpassing d1 d2 d3 d4 d1 distance traveled during P/R time to point where vehicle just enters the left lane d1 1.47t1(u – m at1) 2 where t1 time for initial maneuver (sec) u average speed of passing vehicle (mph) a acceleration (mph/s) m difference between speeds of passing and passed
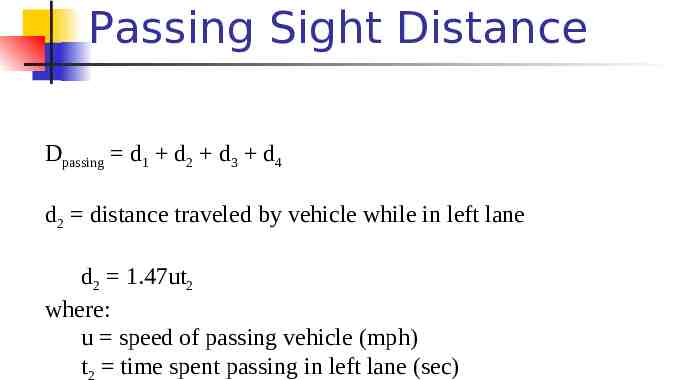
Passing Sight Distance Dpassing d1 d2 d3 d4 d2 distance traveled by vehicle while in left lane d2 1.47ut2 where: u speed of passing vehicle (mph) t2 time spent passing in left lane (sec)
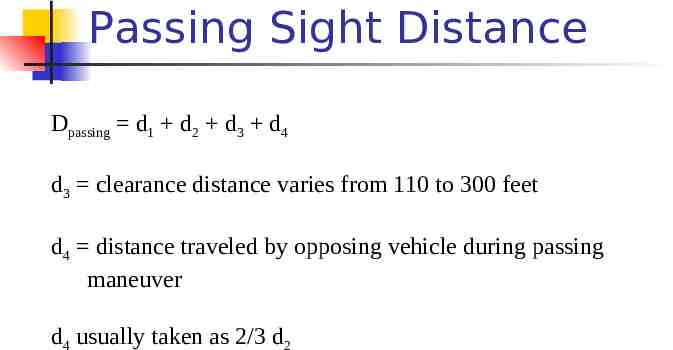
Passing Sight Distance Dpassing d1 d2 d3 d4 d3 clearance distance varies from 110 to 300 feet d4 distance traveled by opposing vehicle during passing maneuver d4 usually taken as 2/3 d2
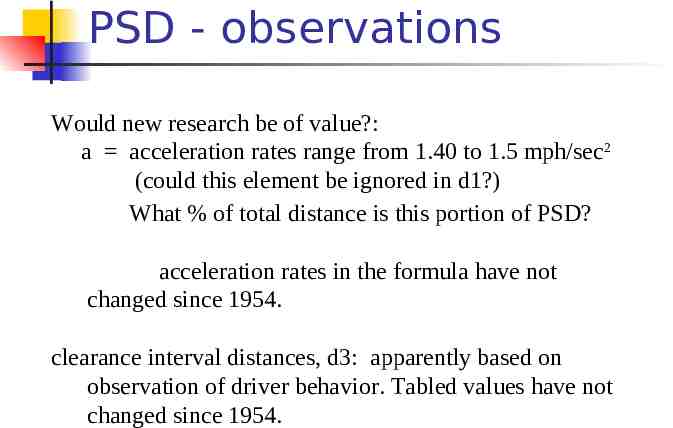
PSD - observations Would new research be of value?: a acceleration rates range from 1.40 to 1.5 mph/sec2 (could this element be ignored in d1?) What % of total distance is this portion of PSD? acceleration rates in the formula have not changed since 1954. clearance interval distances, d3: apparently based on observation of driver behavior. Tabled values have not changed since 1954.
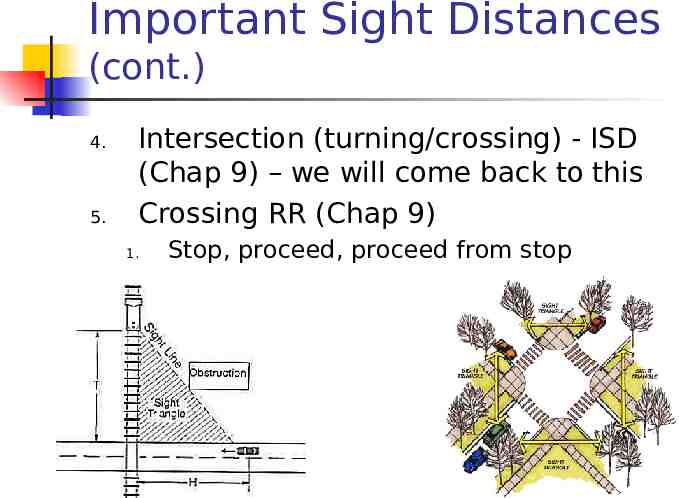
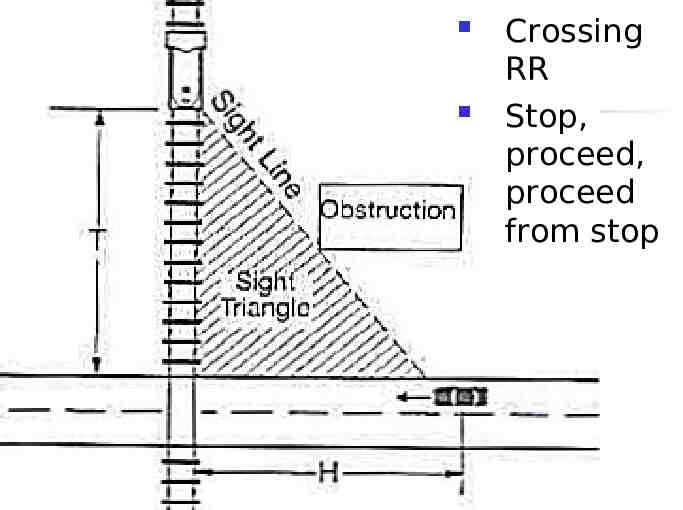
Important Sight Distances (cont.) 4. 5. Intersection (turning/crossing) - ISD (Chap 9) – we will come back to this Crossing RR (Chap 9) 1. Stop, proceed, proceed from stop
Crossing RR Stop, proceed, proceed from stop
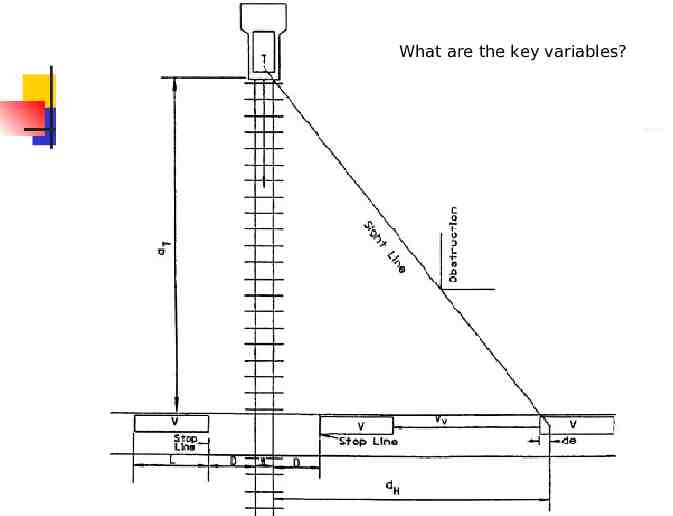
What are the key variables?
Key issues in safe crossing Speeds Distance from front of vehicle to driver’s eye Distance from rail to front of vehicle Assumptions about PR time and braking distance Width of crossing Distance from end of vehicle after crossing Length of vehicle Acceleration capability of road vehicle Offset of obstruction from the road and the rail line
Question for Next Class Be prepared to report on the acceleration rates used in passing sight distance in 1954, with the acceleration rates for trucks accelerating from a railroad crossing in 2005