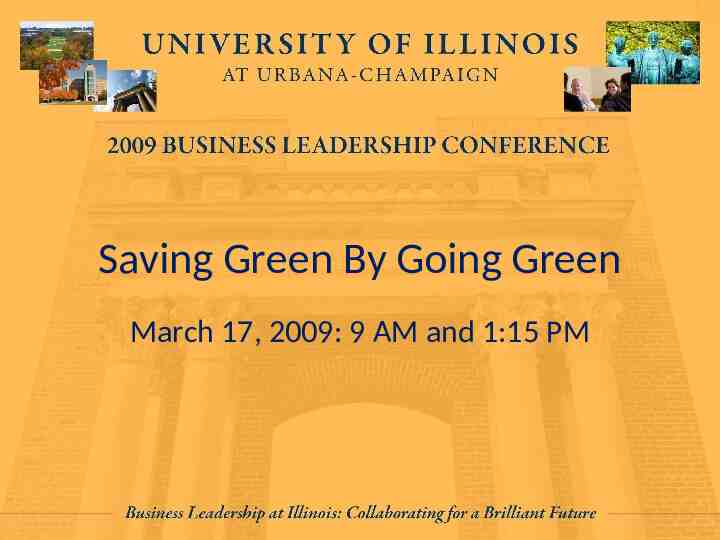
Saving Green By Going Green March 17, 2009: 9 AM and 1:15 PM
53 Slides3.32 MB
Saving Green By Going Green March 17, 2009: 9 AM and 1:15 PM
Workshop Presenters Name: Terry Ruprecht Title: Director of Energy Conservation Contact Information: [email protected] Name: Tom Abram Title: F&S Sustainability Coordinator Contact Information: [email protected] 2
Please Turn off cell phones. Avoid side conversations. Feel free to ask questions as they arise – discussion is encouraged Sign the attendance roster. Complete the evaluation at the end of the workshop. 3
Workshop Objectives Understand the current energy situation and benefits of energy conservation Learn basic strategies to reduce campus energy consumption Explore methods to fund these efforts 4
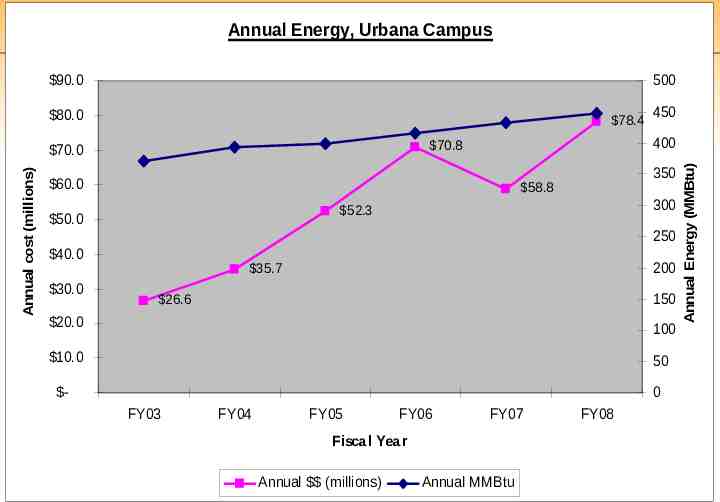
What’s been the campus energy usage and energy cost picture over the past few years?
Annual Energy, Urbana Campus 90.0 500 80.0 78.4 60.0 350 58.8 300 52.3 50.0 250 40.0 30.0 200 35.7 150 26.6 20.0 100 10.0 50 - 0 FY03 FY04 FY05 FY06 FY07 Fiscal Year Annual (millions) Annual MMBtu FY08 Annual Energy (MMBtu) Annual cost (millions) 400 70.8 70.0 450
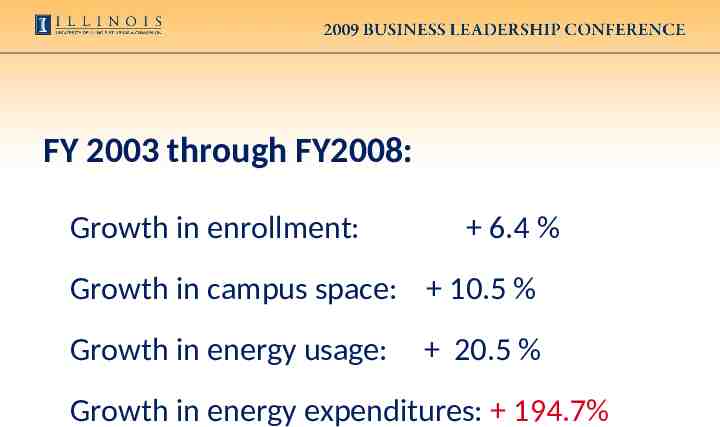
FY 2003 through FY2008: Growth in enrollment: 6.4 % Growth in campus space: 10.5 % Growth in energy usage: 20.5 % Growth in energy expenditures: 194.7%
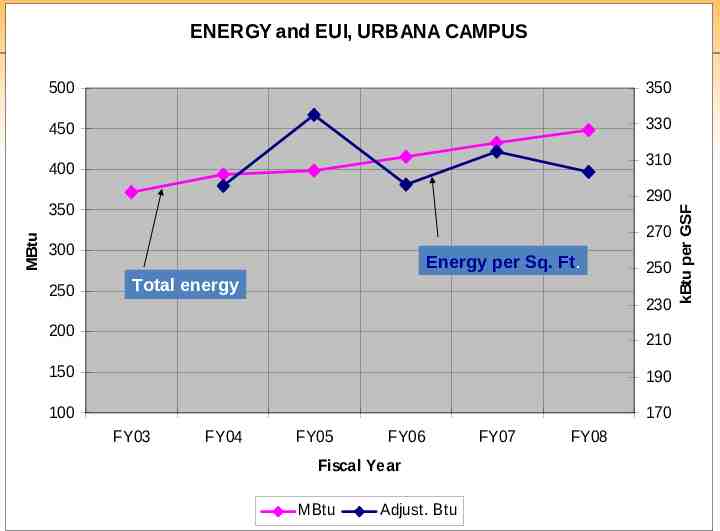
ENERGY and EUI, URBANA CAMPUS 500 350 450 330 290 MBtu 350 270 300 250 Energy per Sq. Ft. Total energy 250 230 200 210 150 190 100 170 FY03 FY04 FY05 FY06 Fiscal Year MBtu Adjust. Btu FY07 FY08 kBtu per GSF 310 400
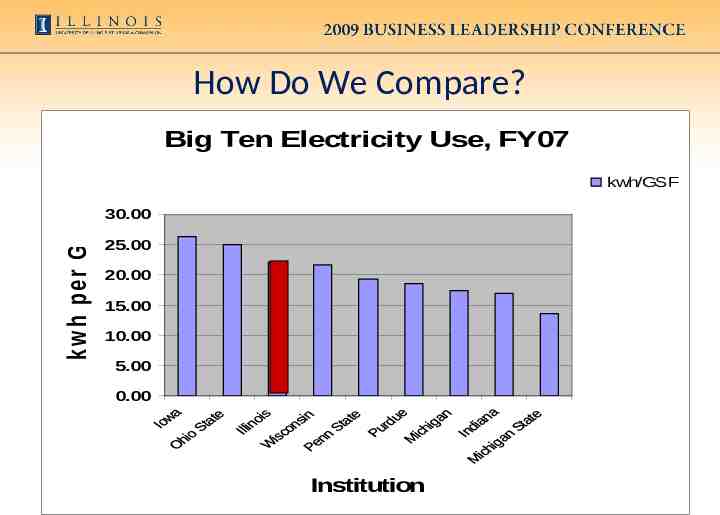
How Do We Compare? Big Ten Electricity Use, FY07 kw h per G S F kwh/GSF 30.00 25.00 20.00 15.00 10.00 5.00 0.00 Institution
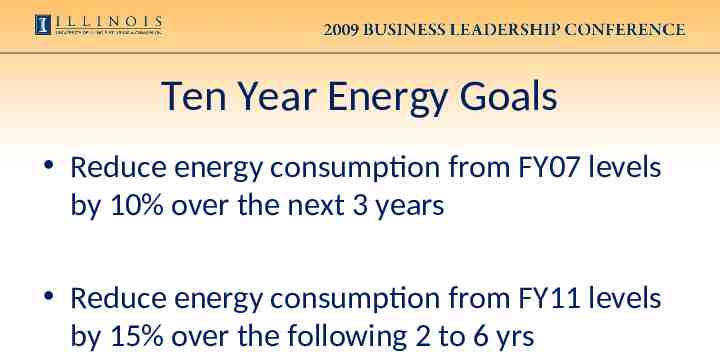
Ten Year Energy Goals Reduce energy consumption from FY07 levels by 10% over the next 3 years Reduce energy consumption from FY11 levels by 15% over the following 2 to 6 yrs
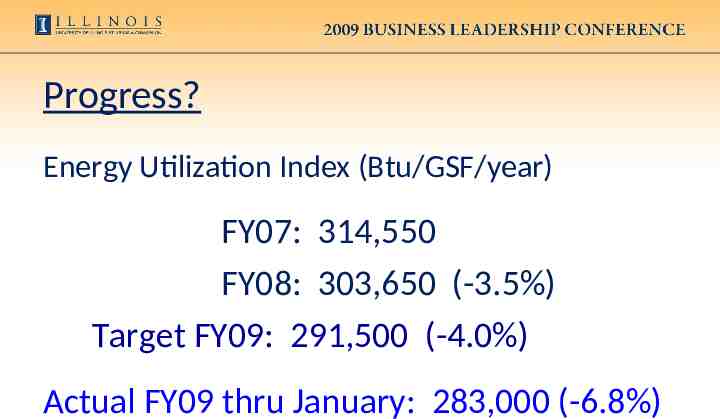
Progress? Energy Utilization Index (Btu/GSF/year) FY07: 314,550 FY08: 303,650 (-3.5%) Target FY09: 291,500 (-4.0%) Actual FY09 thru January: 283,000 (-6.8%)
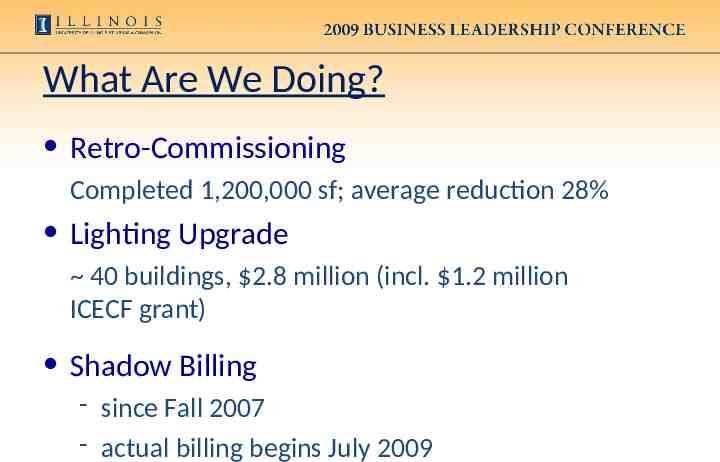
What Are We Doing? Retro-Commissioning Completed 1,200,000 sf; average reduction 28% Lighting Upgrade 40 buildings, 2.8 million (incl. 1.2 million ICECF grant) Shadow Billing - since Fall 2007 - actual billing begins July 2009
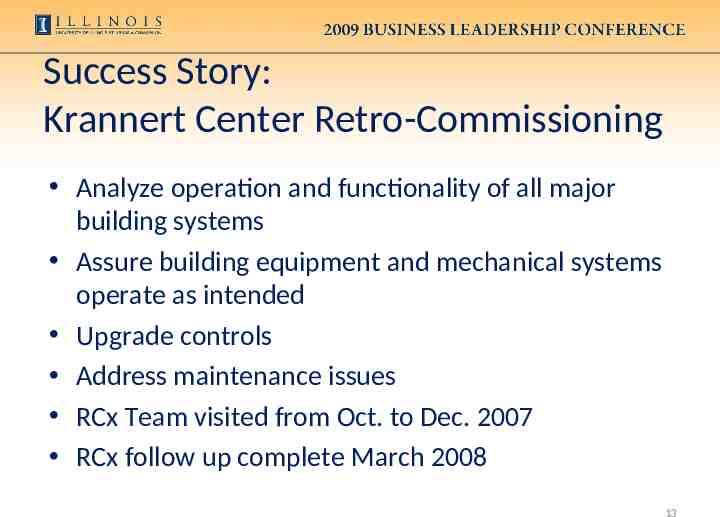
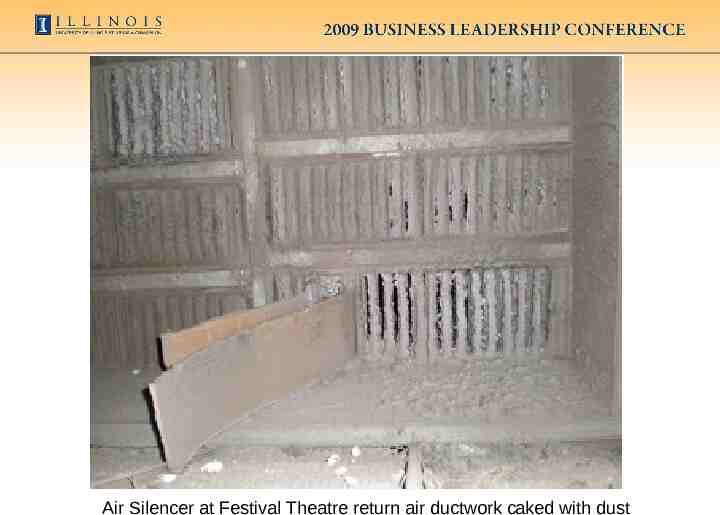
Success Story: Krannert Center Retro-Commissioning Analyze operation and functionality of all major building systems Assure building equipment and mechanical systems operate as intended Upgrade controls Address maintenance issues RCx Team visited from Oct. to Dec. 2007 RCx follow up complete March 2008 13
Air Silencer at Festival Theatre return air ductwork caked with dust
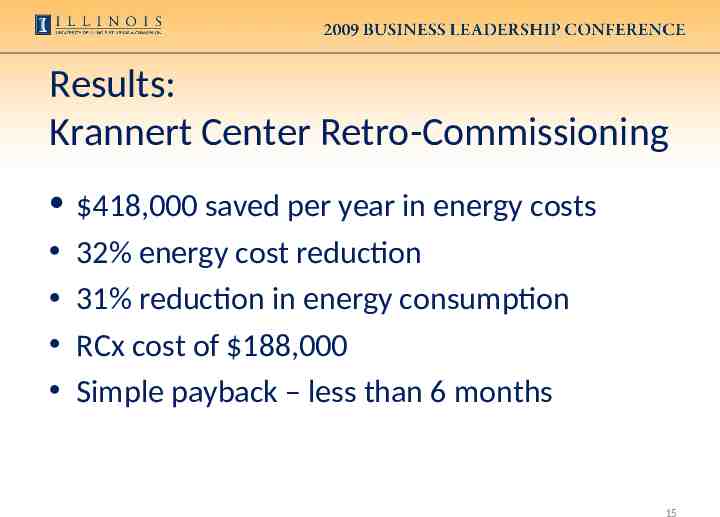
Results: Krannert Center Retro-Commissioning 418,000 saved per year in energy costs 32% energy cost reduction 31% reduction in energy consumption RCx cost of 188,000 Simple payback – less than 6 months 15
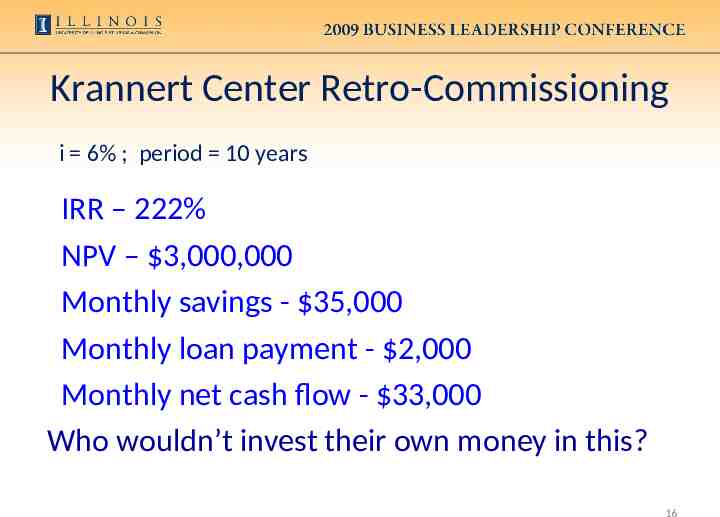
Krannert Center Retro-Commissioning i 6% ; period 10 years IRR – 222% NPV – 3,000,000 Monthly savings - 35,000 Monthly loan payment - 2,000 Monthly net cash flow - 33,000 Who wouldn’t invest their own money in this? 16
Krannert Center Retro-Commissioning Projects like this available all over campus Hundreds lack funding; a lesser number lack identification Past budget structure did not reward those who implement/fund energy savings projects “Reward desired behavior ! ”
What Are We Doing? (contin.) Working with colleges and department energy liaisons - Energy “Toolkit” Improving campus-wide awareness Finalizing a system-wide utility/energy study Finalizing a Vision Statement for campus-wide sustainability
Changing the Culture: Alert the campus to its usage Shadow Billing Increase awareness of conservation efforts celebrate successes Engage students, faculty and staff Communicate solutions Department/College Tool Kit Comprehensive Communication and Action Plan
Opportunities for Improvement Primary areas for reduction: Air Conditioning and Ventilation Usage and Operating Schedules Fume Hood Usage Space Usage Computer Policies and Practices Equipment Procurement Practices Laboratory Equipment Usage
Opportunities for Improvement Examples of Short-term Goals: Establish policy for turning off computer work stations; turn off at night and change power settings to Standby or Hibernate Enact monitor power settings; screen savers are not energy conservation – can increase energy consumption! All faculty, students and staff turn off lighting and equipment not in use. Unplug/switch off power strips to defeat energy vampires.
Opportunities for Improvement Examples of Short-term Goals: Create awareness across your department/college Require purchases of Energy Star rated equipment (computers/thin clients, monitors, lab equipment, audio/visual, refrigerators, etc) Close fume hoods when not in use; turn hoods off if equipped with start/stop switch Replace incandescents in personal lamps with CFLs
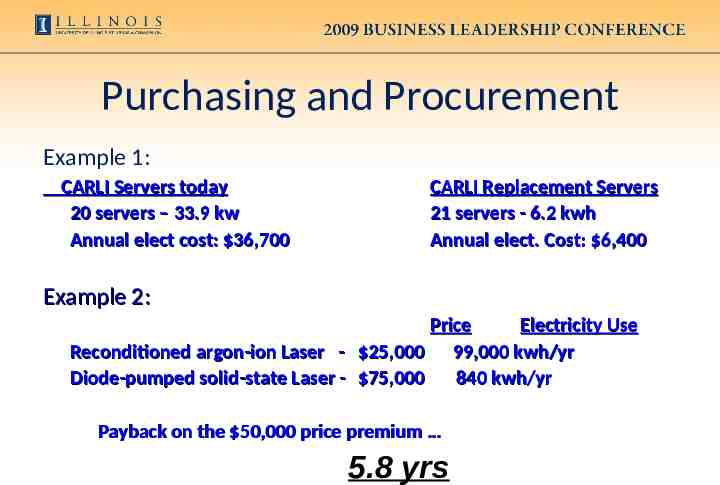
Purchasing and Procurement Example 1: CARLI Servers today 20 servers – 33.9 kw Annual elect cost: 36,700 CARLI Replacement Servers 21 servers - 6.2 kwh Annual elect. Cost: 6,400 Example 2: Price Electricity Use Reconditioned argon-ion Laser - 25,000 99,000 kwh/yr Diode-pumped solid-state Laser - 75,000 840 kwh/yr Payback on the 50,000 price premium 5.8 yrs
Goals Examples of Long-term Goals: Identify areas of high energy usage and develop a plan for reduction Consolidation of fume hoods and equipment Facilitate systems retrofitting with F&S Retro-commissioning Team Develop a plan for more efficient space and classroom usage Investigate the consolidation of climate-sensitive projects/equipment Develop a plan and timetable for reaching the 17 percent reduction in five years
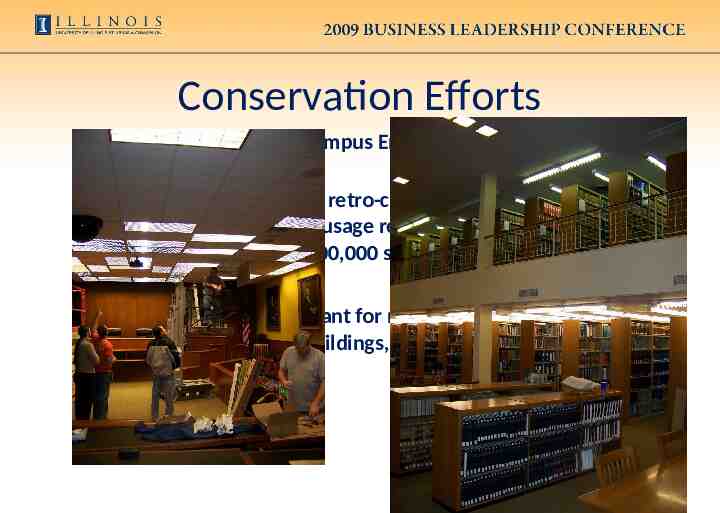
Conservation Efforts Developed a campus Energy Use Policy Implemented a retro-commissioning program, averaging 28% usage reduction in completed buildings ( 1,200,000 sq. ft.) 1.2M ICECF grant for major lighting retrofit/upgrade program (40 buildings, 84,500 fixtures)
Conservation Efforts Implemented comprehensive steam trap maintenance program Adopted LEED Silver standards for all major construction Developed ESCO Request for Qualifications USEPA “Energy Star” partner Signed the Presidents’ Climate Commitment
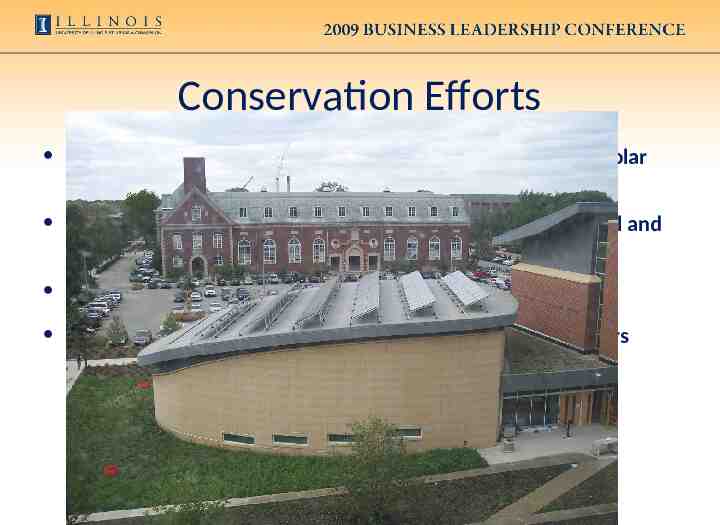
Conservation Efforts Business Instructional Facility reduced 46% via green roof, solar panels, energy recovery wheel Energy recovery wheels at Conference Center, RAL, ARC Pool and Memorial Stadium Begin night set-backs 29M of 88M deferred maintenance spending in last 2 years focused on energy components
Energy Conservation As An Investment Many projects have incredible rates of return Combined with financing, energy conservation can make a tremendous financial investment Can even achieve higher yields than our endowment Especially in current economic climate, it makes financial sense to invest in our own infrastructure When departmental energy billing takes effect, individual units can take advantage of these investments
Economic Terms Installation Cost – First cost investment University Contribution – Installation cost minus any grants or rebates Annual Cost Savings – Estimated annual energy (and/or maintenance) cost reduction Simple Payback – Amount of time for the initial contribution to be paid back in future savings (oversimplified indicator)
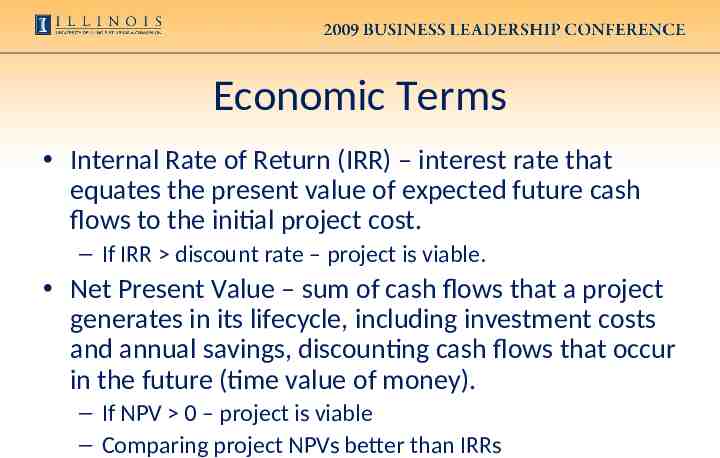
Economic Terms Internal Rate of Return (IRR) – interest rate that equates the present value of expected future cash flows to the initial project cost. – If IRR discount rate – project is viable. Net Present Value – sum of cash flows that a project generates in its lifecycle, including investment costs and annual savings, discounting cash flows that occur in the future (time value of money). – If NPV 0 – project is viable – Comparing project NPVs better than IRRs
Economic Terms Monthly Savings – Estimated monthly energy and/or maintenance savings Monthly Loan Payment – Monthly payment for loan on the projects investment cost. Based on interest rate and loan period Monthly Net Cash Flow – Monthly savings minus the monthly loan payment. Positive cash flow indicates a strong project that instantly pays for itself.
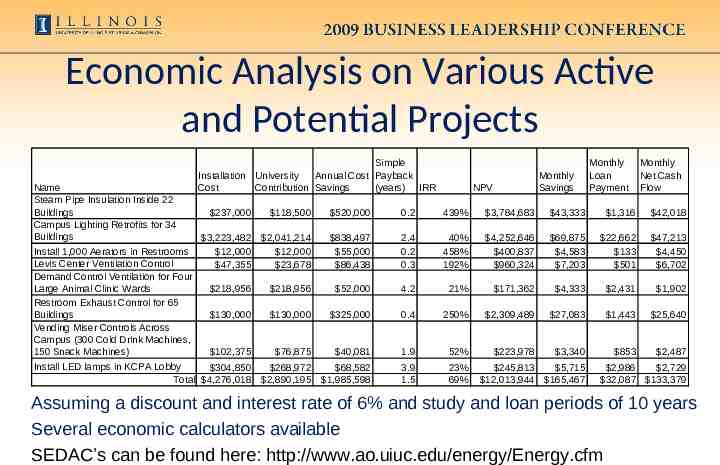
Economic Analysis on Various Active and Potential Projects Simple Installation University Annual Cost Payback Cost Contribution Savings (years) IRR Name Steam Pipe Insulation Inside 22 Buildings 237,000 Campus Lighting Retrofits for 34 Buildings 3,223,482 Install 1,000 Aerators in Restrooms 12,000 Levis Center Ventilation Control 47,355 Demand Control Ventilation for Four Large Animal Clinic Wards 218,956 Restroom Exhaust Control for 65 Buildings 130,000 Vending Miser Controls Across Campus (300 Cold Drink Machines, 150 Snack Machines) 102,375 Install LED lamps in KCPA Lobby 304,850 Total 4,276,018 Monthly Savings NPV Monthly Loan Payment Monthly Net Cash Flow 118,500 520,000 0.2 439% 3,784,683 43,333 1,316 42,018 2,041,214 12,000 23,678 838,497 55,000 86,438 2.4 0.2 0.3 40% 458% 192% 4,252,646 400,837 960,324 69,875 4,583 7,203 22,662 133 501 47,213 4,450 6,702 218,956 52,000 4.2 21% 171,362 4,333 2,431 1,902 130,000 325,000 0.4 250% 2,309,489 27,083 1,443 25,640 76,875 40,081 1.9 52% 223,978 3,340 853 2,487 268,972 2,890,195 68,582 1,985,598 3.9 1.5 23% 69% 245,813 5,715 12,013,944 165,467 2,986 2,729 32,087 133,379 Assuming a discount and interest rate of 6% and study and loan periods of 10 years Several economic calculators available SEDAC’s can be found here: http://www.ao.uiuc.edu/energy/Energy.cfm
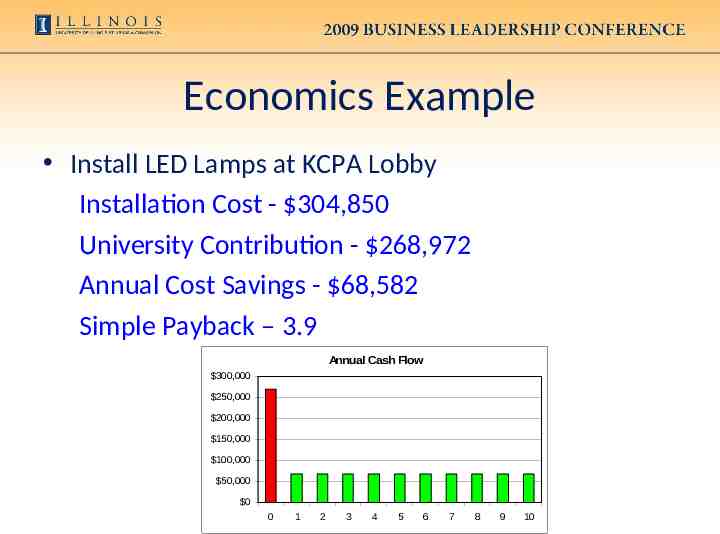
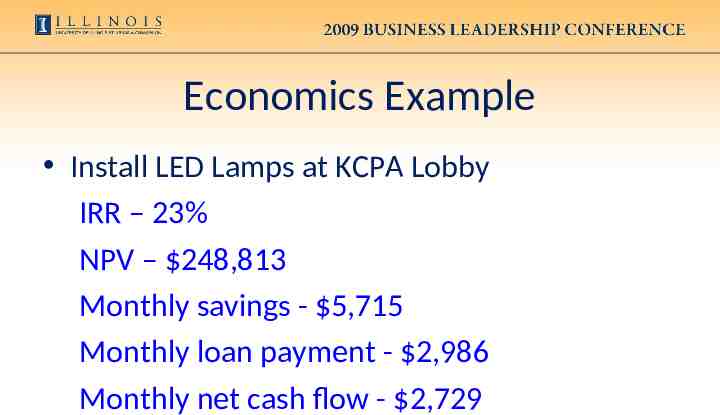
Economics Example Install LED Lamps at KCPA Lobby Installation Cost - 304,850 University Contribution - 268,972 Annual Cost Savings - 68,582 Simple Payback – 3.9 Annual Cash Flow 300,000 250,000 200,000 150,000 100,000 50,000 0 0 1 2 3 4 5 6 7 8 9 10
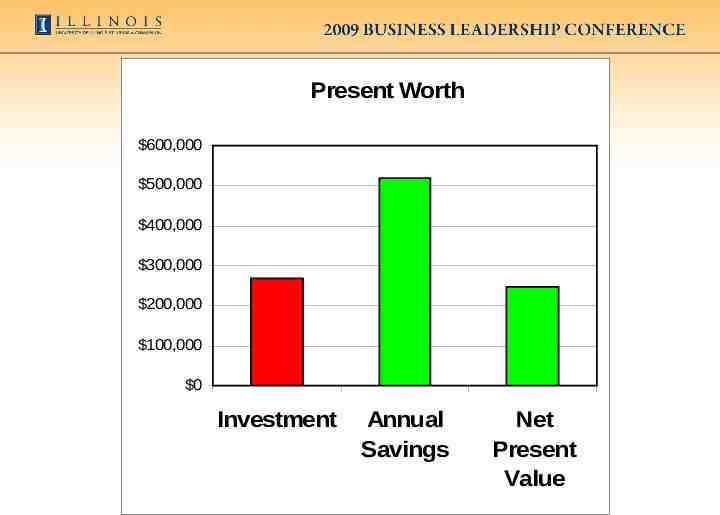
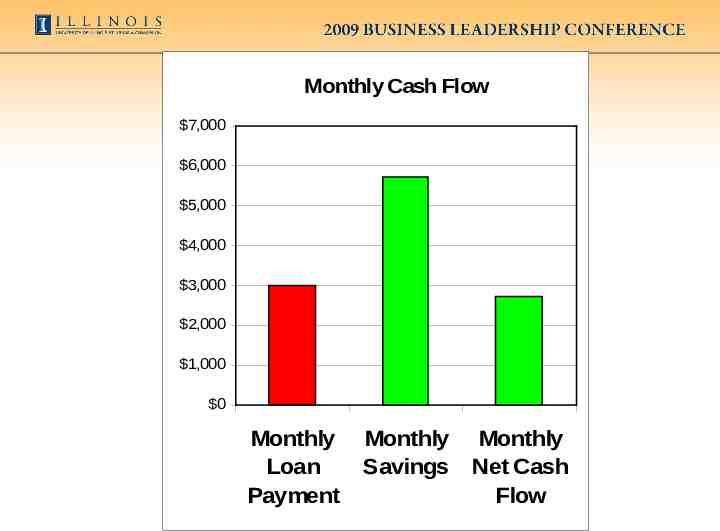
Economics Example Install LED Lamps at KCPA Lobby IRR – 23% NPV – 248,813 Monthly savings - 5,715 Monthly loan payment - 2,986 Monthly net cash flow - 2,729
Present Worth 600,000 500,000 400,000 300,000 200,000 100,000 0 Investment Annual Savings Net Present Value
Monthly Cash Flow 7,000 6,000 5,000 4,000 3,000 2,000 1,000 0 Monthly Loan Payment Monthly Savings Monthly Net Cash Flow
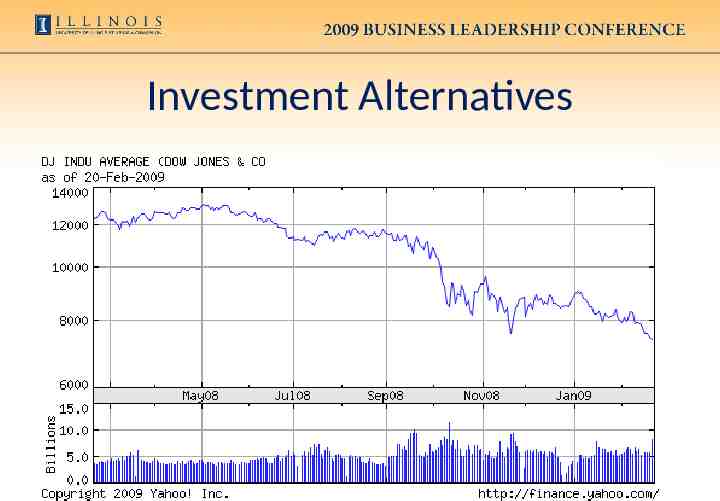
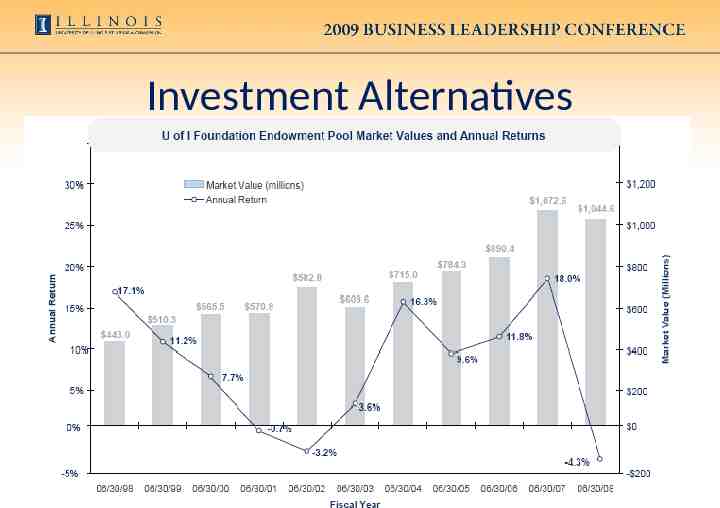
Investment Alternatives
Investment Alternatives
Energy Conservation As An Investment Projects like these are all over campus Investing in conservation just makes sense Energy prices on the rise, increasing returns More stable than investment alternatives Loans can provide positive cash flow
Funding Sources Student Sustainability Committee AFMFA for Deferred Maintenance Projects Illinois Department of Commerce and Economic Opportunity - Public Sector Electric Efficiency Programs Illinois Clean Energy Community Foundation Departmental Central Campus/University Possibly in the future: revolving loan fund, donors
Student Sustainability Committee Two fees passed by students unto themselves 2/sem. Cleaner Energy Technologies – Renewable energy and energy efficiency 5/sem. Sustainable Campus Environment – Broader: includes above categories plus additional initiatives, including education, sustainable resource purchasing, green buildings, sustainable campus development
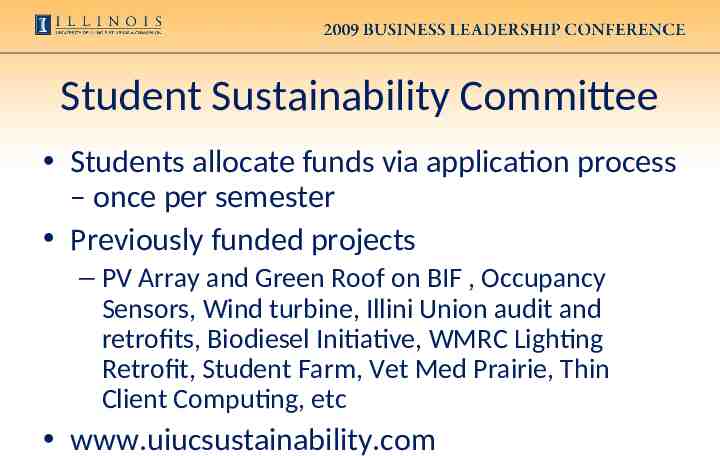
Student Sustainability Committee Students allocate funds via application process – once per semester Previously funded projects – PV Array and Green Roof on BIF , Occupancy Sensors, Wind turbine, Illini Union audit and retrofits, Biodiesel Initiative, WMRC Lighting Retrofit, Student Farm, Vet Med Prairie, Thin Client Computing, etc www.uiucsustainability.com
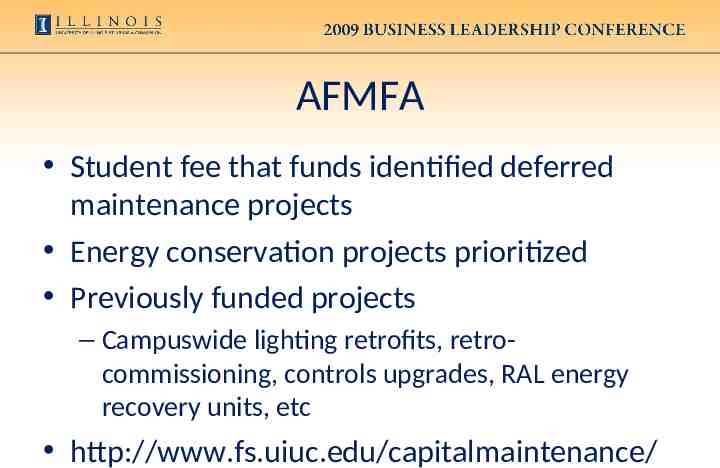
AFMFA Student fee that funds identified deferred maintenance projects Energy conservation projects prioritized Previously funded projects – Campuswide lighting retrofits, retrocommissioning, controls upgrades, RAL energy recovery units, etc http://www.fs.uiuc.edu/capitalmaintenance/
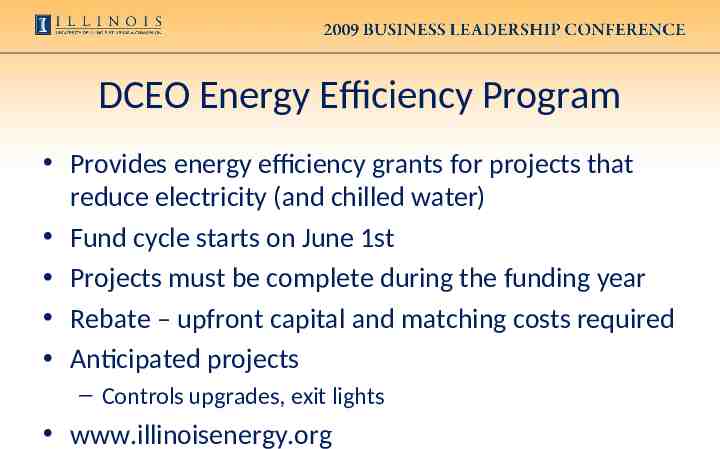
DCEO Energy Efficiency Program Provides energy efficiency grants for projects that reduce electricity (and chilled water) Fund cycle starts on June 1st Projects must be complete during the funding year Rebate – upfront capital and matching costs required Anticipated projects – Controls upgrades, exit lights www.illinoisenergy.org
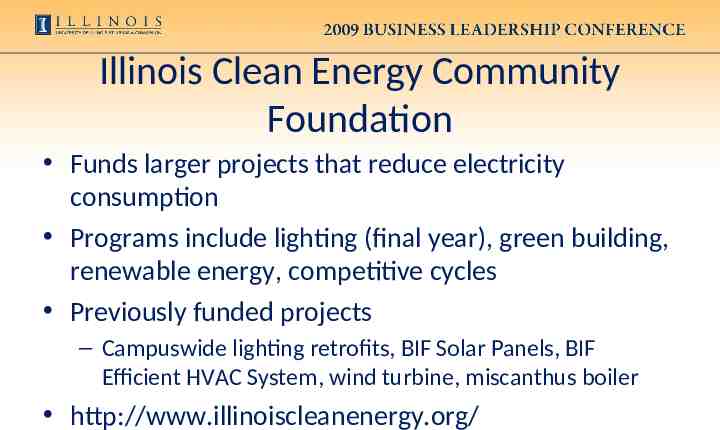
Illinois Clean Energy Community Foundation Funds larger projects that reduce electricity consumption Programs include lighting (final year), green building, renewable energy, competitive cycles Previously funded projects – Campuswide lighting retrofits, BIF Solar Panels, BIF Efficient HVAC System, wind turbine, miscanthus boiler http://www.illinoiscleanenergy.org/
Future Funding Sources When departments pay their own energy bills, they will have an incentive to invest in energy conservation Will need access to capital for projects Revolving loan fund would address this issue Revolving loan fund would pay for project costs and would be reimbursed through energy savings Allows us to reinvest in energy conservation Like an internal ESCO
Other Sustainability Efforts Reduce bottled water consumption Costs 1,000 times more than tap water! Separate recyclables Use recycled paper – 100% post-consumer Double-sided defaults Departmental bike share – Kinesiology and DURP already have programs Encourage bicycling, MTD, car share, walking, etc Encourage rail, bus, carpooling for trips
Workshop Summary Energy costs are rising and putting pressure on University budgets Although efforts are being made across campus, there needs to be a stronger commitment to energy conservation Energy conservation projects make economic sense New departmental billing system will allow units to take advantage of these investments We need champions among the business leaders to push for these projects and mechanisms to adequately fund them 48
Questions / Concerns? 49
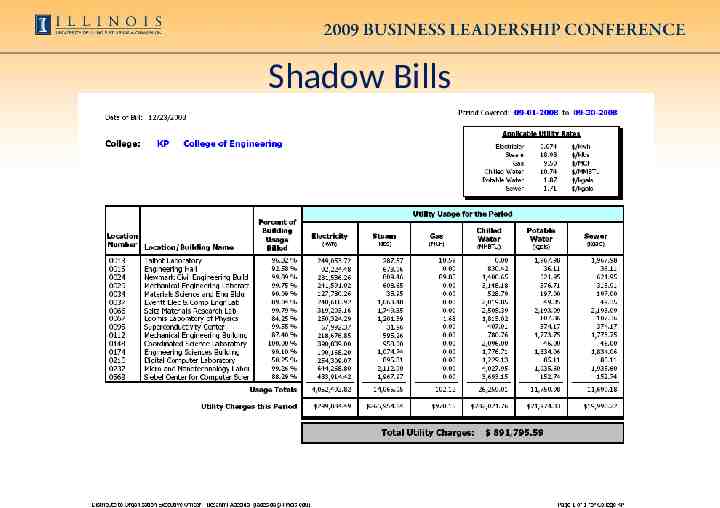
Shadow Bills
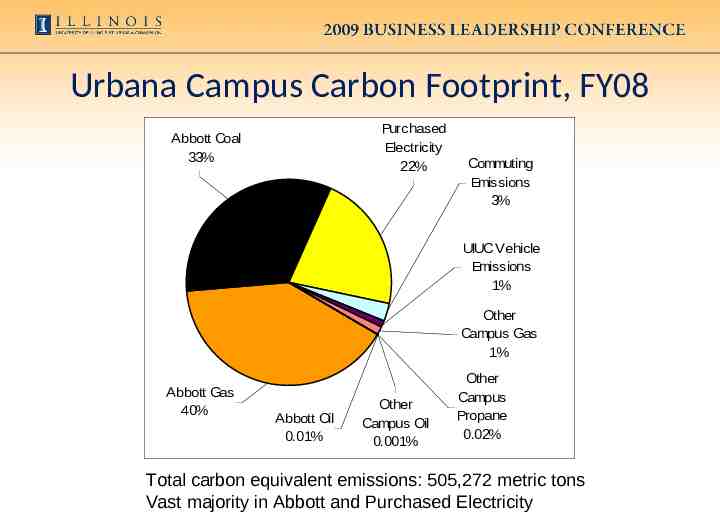
Urbana Campus Carbon Footprint, FY08 Purchased Electricity 22% Abbott Coal 33% Commuting Emissions 3% UIUC Vehicle Emissions 1% Other Campus Gas 1% Abbott Gas 40% Abbott Oil 0.01% Other Campus Oil 0.001% Other Campus Propane 0.02% Total carbon equivalent emissions: 505,272 metric tons Vast majority in Abbott and Purchased Electricity
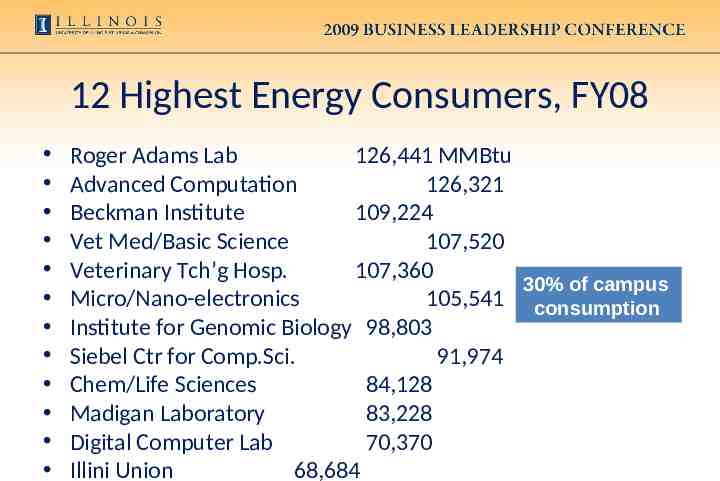
12 Highest Energy Consumers, FY08 Roger Adams Lab 126,441 MMBtu Advanced Computation 126,321 Beckman Institute 109,224 Vet Med/Basic Science 107,520 Veterinary Tch’g Hosp. 107,360 30% of campus Micro/Nano-electronics 105,541 consumption Institute for Genomic Biology 98,803 Siebel Ctr for Comp.Sci. 91,974 Chem/Life Sciences 84,128 Madigan Laboratory 83,228 Digital Computer Lab 70,370 Illini Union 68,684