Process Selection and Facility Layout
72 Slides693.50 KB
Process Selection and Facility Layout
Learning Objectives Explain the strategic importance of process selection. Explain the influence that process selection has on an organization. Describe the basic processing types. Discuss automated approaches to processing.
Learning Objectives List some reasons for redesign of layouts. Describe the basic layout types. List the main advantages and disadvantages of product layouts and process layouts. Solve simple line-balancing problems.
Introduction Process selection Deciding on the way production of goods or services will be organized Major implications Capacity planning Layout of facilities Equipment Design of work systems
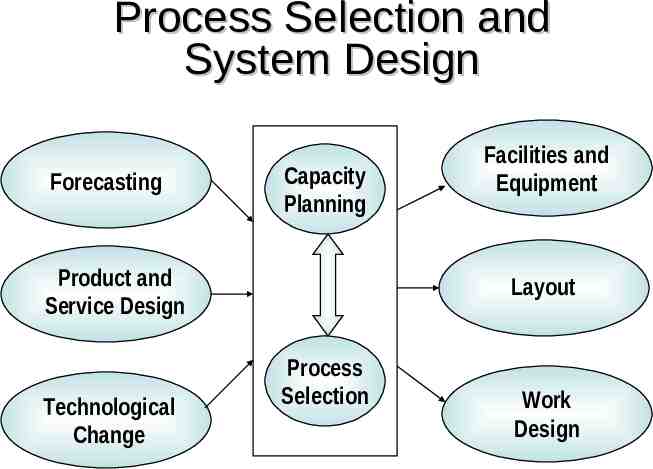
Process Selection and System Design Forecasting Capacity Planning Product and Service Design Technological Change Facilities and Equipment Layout Process Selection Work Design
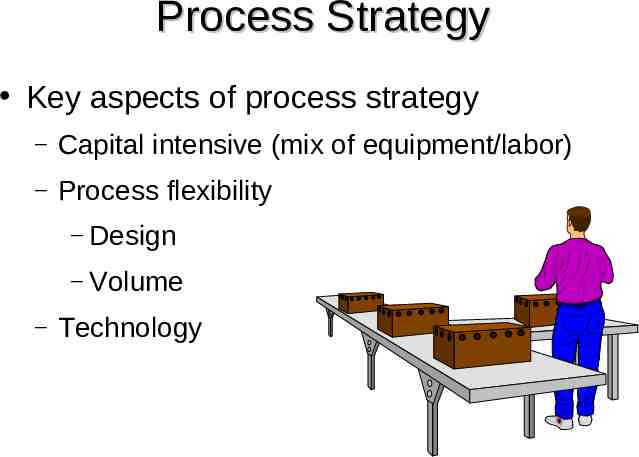
Process Strategy Key aspects of process strategy – Capital intensive (mix of equipment/labor) – Process flexibility – – Design – Volume Technology
Kinds of Technology Operations management is primarily concerned with three kinds of technology: Product and service technology Process technology Information technology All three have a major impact on: Costs Productivity Competitiveness
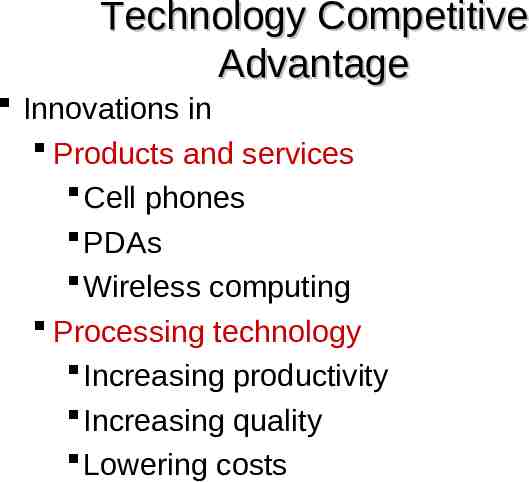
Technology Competitive Advantage Innovations in Products and services Cell phones PDAs Wireless computing Processing technology Increasing productivity Increasing quality Lowering costs
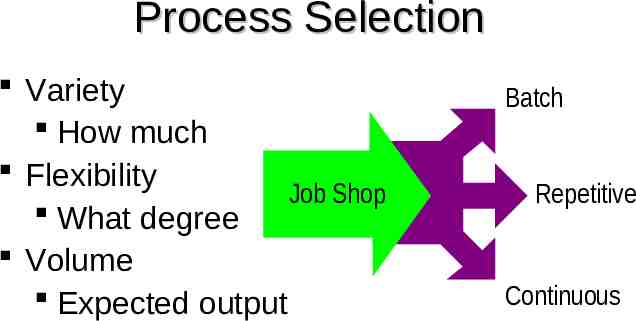
Process Selection Variety How much Flexibility Job Shop What degree Volume Expected output Batch Repetitive Continuous
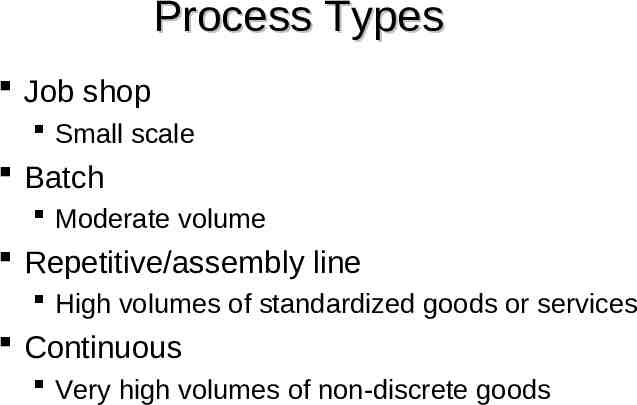
Process Types Job shop Small scale Batch Moderate volume Repetitive/assembly line High volumes of standardized goods or services Continuous Very high volumes of non-discrete goods
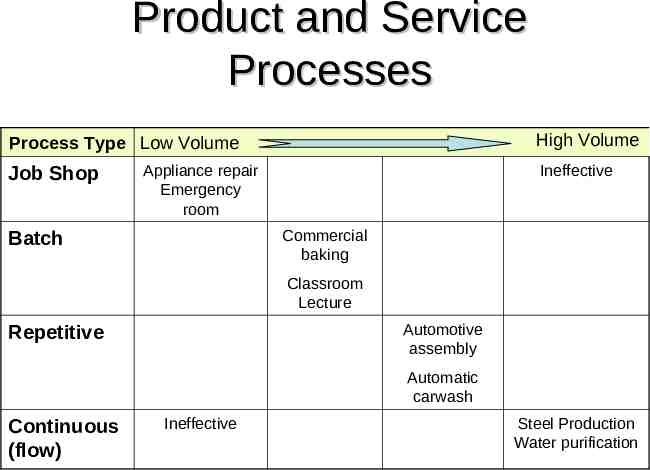
Product and Service Processes High Volume Process Type Low Volume Job Shop Appliance repair Emergency room Ineffective Commercial baking Batch Classroom Lecture Automotive assembly Repetitive Automatic carwash Continuous (flow) Ineffective Steel Production Water purification
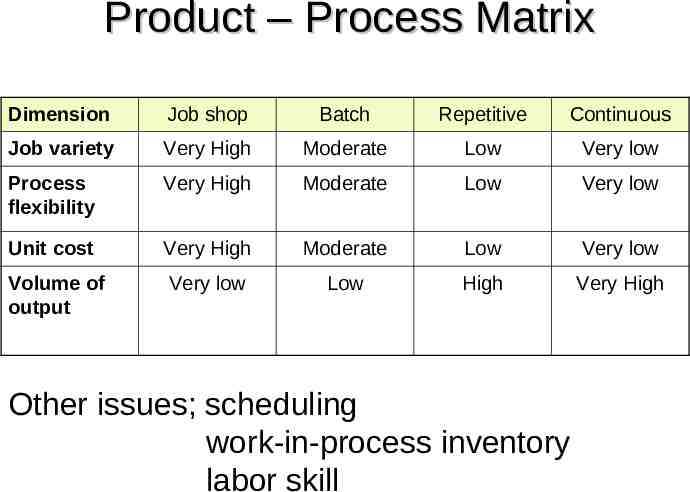
Product – Process Matrix Dimension Job shop Batch Repetitive Continuous Job variety Very High Moderate Low Very low Process flexibility Very High Moderate Low Very low Unit cost Very High Moderate Low Very low Volume of output Very low Low High Very High Other issues; scheduling work-in-process inventory labor skill
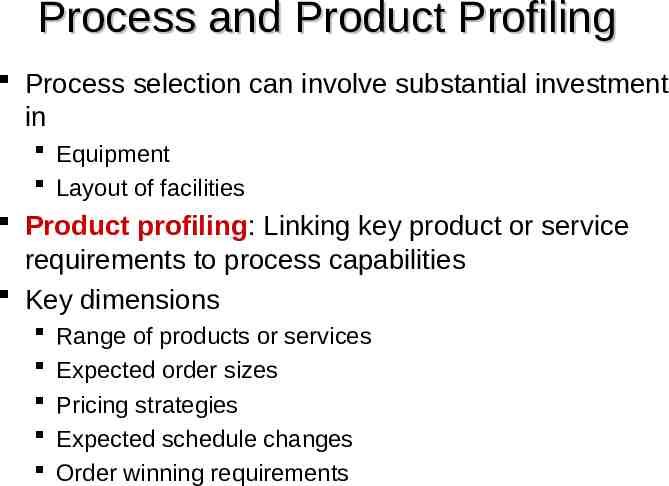
Process and Product Profiling Process selection can involve substantial investment in Equipment Layout of facilities Product profiling: Linking key product or service requirements to process capabilities Key dimensions Range of products or services Expected order sizes Pricing strategies Expected schedule changes Order winning requirements
Automation Automation: Machinery that has sensing and control devices that enables it to operate Fixed automation Programmable automation
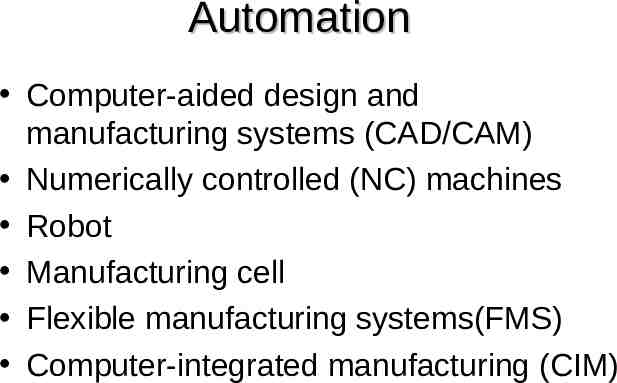
Automation Computer-aided design and manufacturing systems (CAD/CAM) Numerically controlled (NC) machines Robot Manufacturing cell Flexible manufacturing systems(FMS) Computer-integrated manufacturing (CIM)
Facilities Layout Layout: the configuration of departments, work centers, and equipment, with particular emphasis on movement of work (customers or materials) through the system Product layouts Process layouts Fixed-Position layout Combination layouts
Objective of Layout Design 1. 2. 3. 4. Facilitate attainment of product quality Use workers and space efficiently Avoid bottlenecks Minimize unnecessary material handling costs 5. Eliminate unnecessary movement of workers or materials 6. Minimize production time or customer service time 7. Design for safety
Importance of Layout Decisions Requires substantial investments of money and effort Involves long-term commitments Has significant impact on cost and efficiency of short-term operations
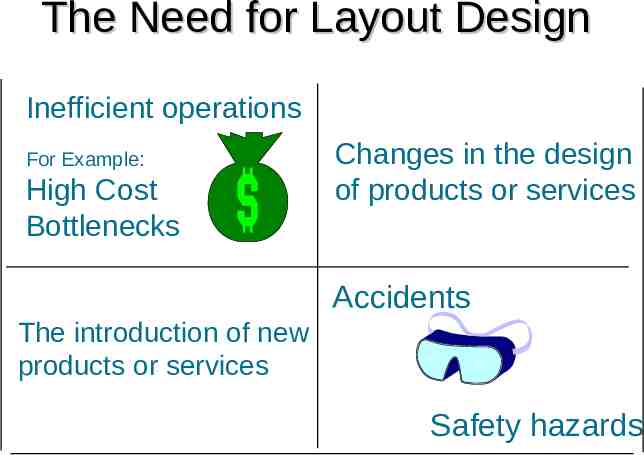
The Need for Layout Design Inefficient operations For Example: High Cost Bottlenecks Changes in the design of products or services Accidents The introduction of new products or services Safety hazards
The Need for Layout Design (Cont’d) Changes in environmental or other legal requirements Changes in volume of output or mix of products Morale problems Changes in methods and equipment
Basic Layout Types Product layouts Process layouts Fixed-Position layout Combination layouts
Basic Layout Types Product layout Layout that uses standardized processing operations to achieve smooth, rapid, highvolume flow Process layout Layout that can handle varied processing requirements Fixed Position layout Layout in which the product or project remains stationary, and workers, materials, and equipment are moved as needed
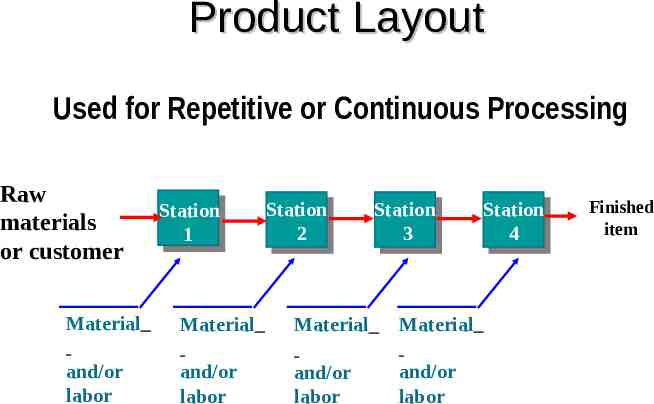
Product Layout Used for Repetitive or Continuous Processing Raw materials or customer Station 1 Station Station 22 Station Station 33 Material Material Material Material and/or labor and/or labor and/or labor and/or labor Station Station 44 Finished item
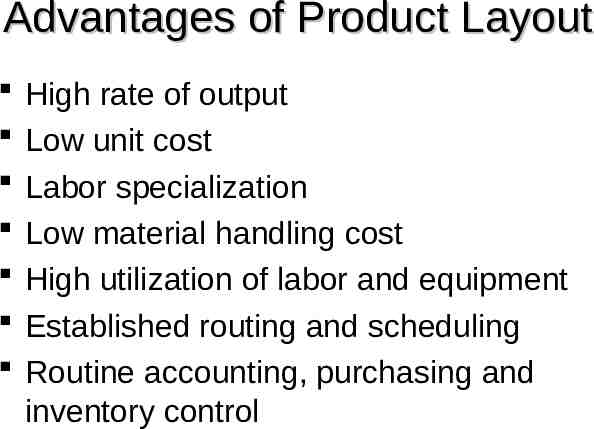
Advantages of Product Layout High rate of output Low unit cost Labor specialization Low material handling cost High utilization of labor and equipment Established routing and scheduling Routine accounting, purchasing and inventory control
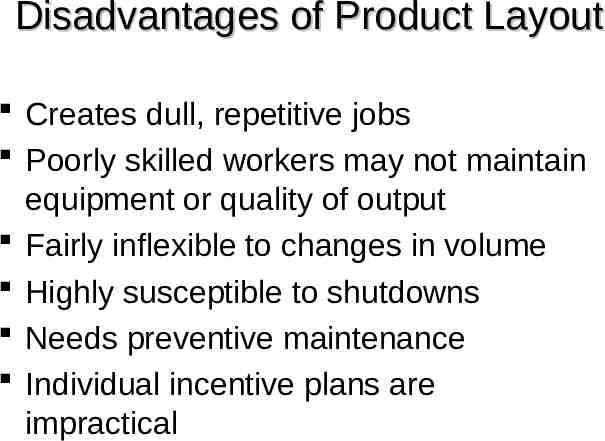
Disadvantages of Product Layout Creates dull, repetitive jobs Poorly skilled workers may not maintain equipment or quality of output Fairly inflexible to changes in volume Highly susceptible to shutdowns Needs preventive maintenance Individual incentive plans are impractical
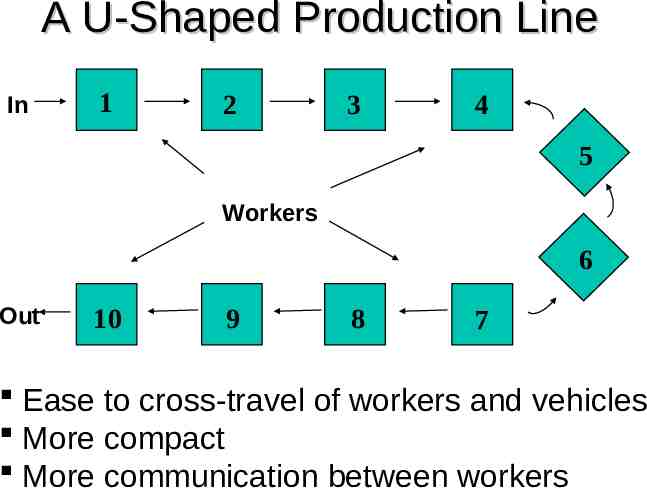
A U-Shaped Production Line In 1 2 3 4 5 Workers 6 Out 10 9 8 7 Ease to cross-travel of workers and vehicles More compact More communication between workers
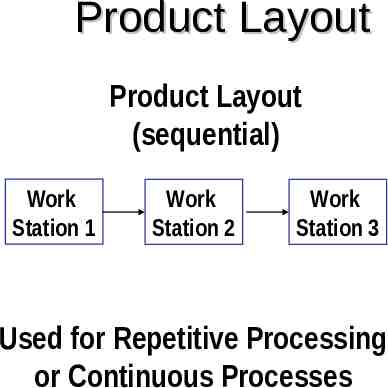
Product Layout Product Layout (sequential) Work Station 1 Work Station 2 Work Station 3 Used for Repetitive Processing or Continuous Processes
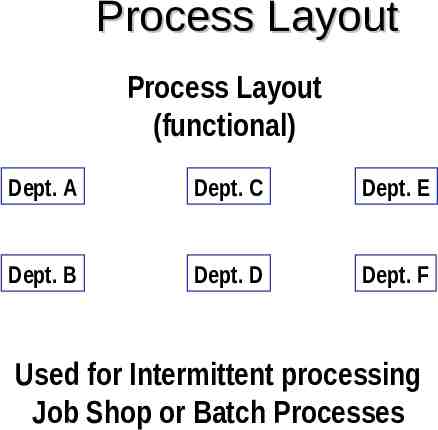
Process Layout Process Layout (functional) Dept. A Dept. C Dept. E Dept. B Dept. D Dept. F Used for Intermittent processing Job Shop or Batch Processes
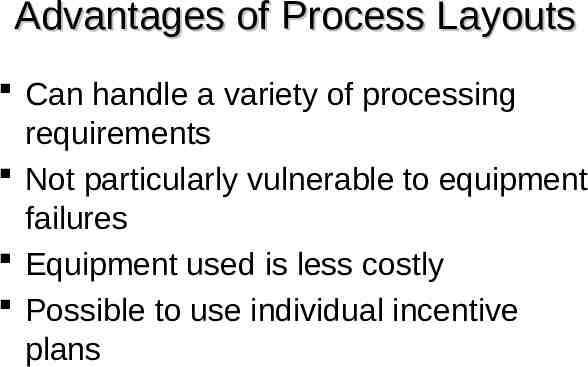
Advantages of Process Layouts Can handle a variety of processing requirements Not particularly vulnerable to equipment failures Equipment used is less costly Possible to use individual incentive plans
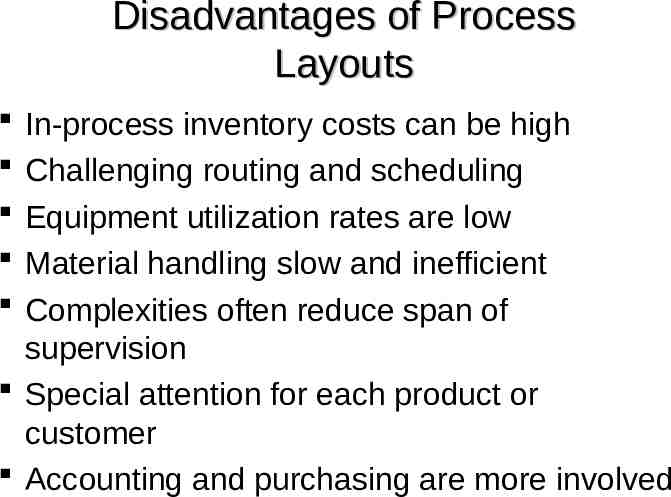
Disadvantages of Process Layouts In-process inventory costs can be high Challenging routing and scheduling Equipment utilization rates are low Material handling slow and inefficient Complexities often reduce span of supervision Special attention for each product or customer Accounting and purchasing are more involved
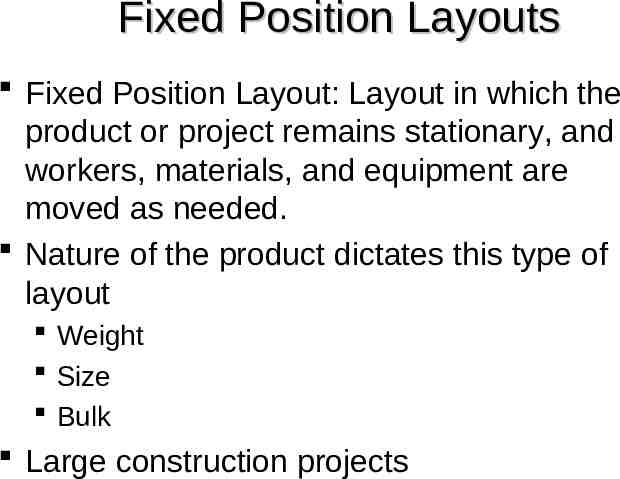
Fixed Position Layouts Fixed Position Layout: Layout in which the product or project remains stationary, and workers, materials, and equipment are moved as needed. Nature of the product dictates this type of layout Weight Size Bulk Large construction projects
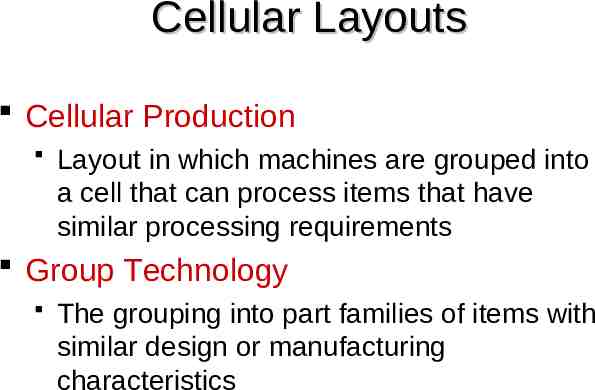
Cellular Layouts Cellular Production Layout in which machines are grouped into a cell that can process items that have similar processing requirements Group Technology The grouping into part families of items with similar design or manufacturing characteristics
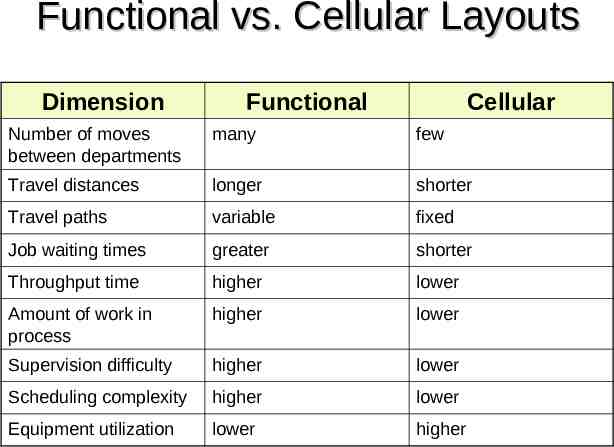
Functional vs. Cellular Layouts Dimension Functional Cellular Number of moves between departments many few Travel distances longer shorter Travel paths variable fixed Job waiting times greater shorter Throughput time higher lower Amount of work in process higher lower Supervision difficulty higher lower Scheduling complexity higher lower Equipment utilization lower higher
Service Layouts Warehouse and storage layouts Retail layouts Office layouts
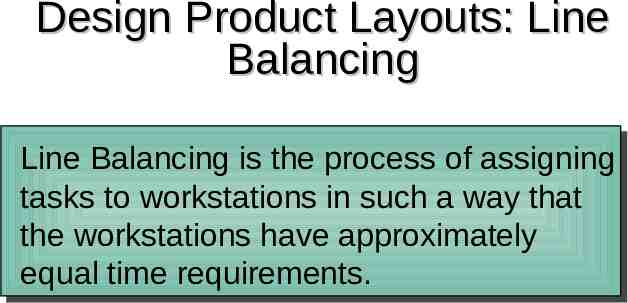
Design Product Layouts: Line Balancing Line Balancing is the process of assigning tasks to workstations in such a way that the workstations have approximately equal time requirements.
Cycle Time Cycle time is the maximum time allowed at each workstation to complete its set of tasks on a unit.
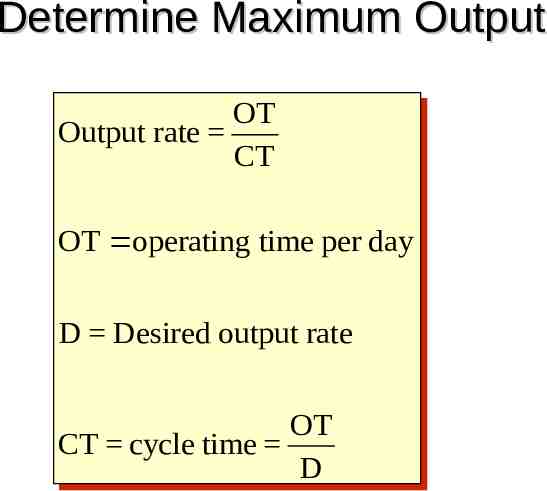
Determine Maximum Output OT OT Output rate Output rate CT CT OT OT operating operating time timeper per day day D D Desired Desired output output rate rate OT OT CT CT cycle cycletime time D D
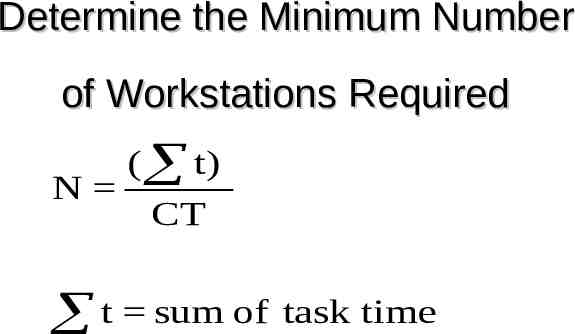
Determine the Minimum Number of Workstations Required N ( t) CT t sum of task time
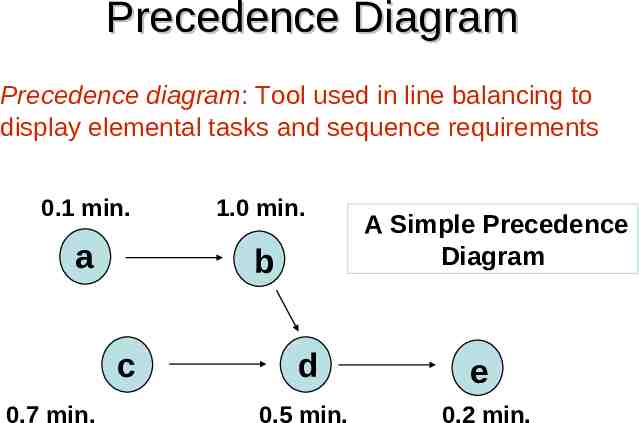
Precedence Diagram Precedence diagram: Tool used in line balancing to display elemental tasks and sequence requirements 0.1 min. 1.0 min. a b c 0.7 min. d 0.5 min. A Simple Precedence Diagram e 0.2 min.
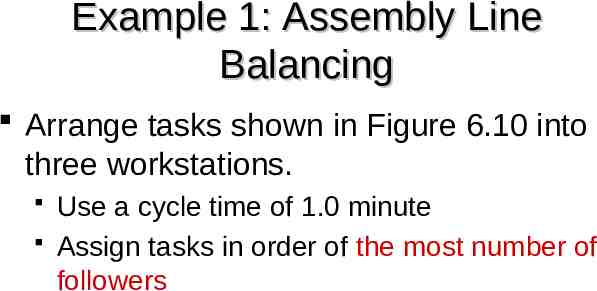
Example 1: Assembly Line Balancing Arrange tasks shown in Figure 6.10 into three workstations. Use a cycle time of 1.0 minute Assign tasks in order of the most number of followers
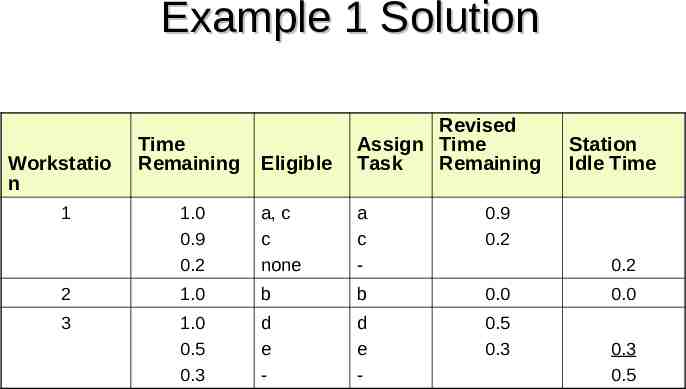
Example 1 Solution Eligible Revised Assign Time Task Remaining 1.0 0.9 0.2 a, c c none a c - 0.9 0.2 2 1.0 b b 0.0 3 1.0 0.5 0.3 d e - d e - 0.5 0.3 Workstatio n 1 Time Remaining Station Idle Time 0.2 0.0 0.3 0.5
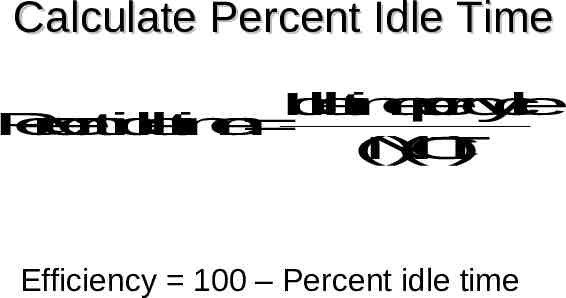
Calculate Percent Idle Time I d l e t i m e p e rc y c l e P e r c e n tid le t im e ( N ) ( C T ) Efficiency 100 – Percent idle time
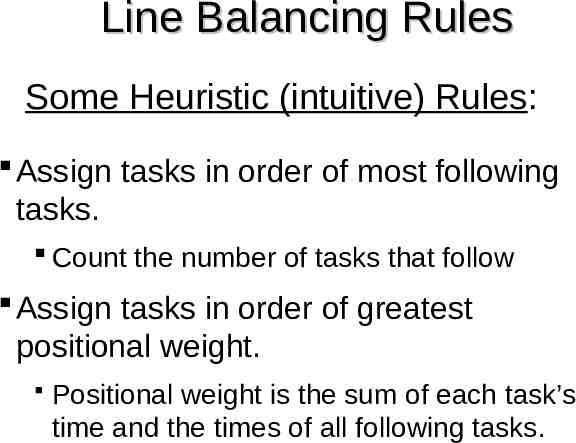
Line Balancing Rules Some Heuristic (intuitive) Rules: Assign tasks in order of most following tasks. Count the number of tasks that follow Assign tasks in order of greatest positional weight. Positional weight is the sum of each task’s time and the times of all following tasks.
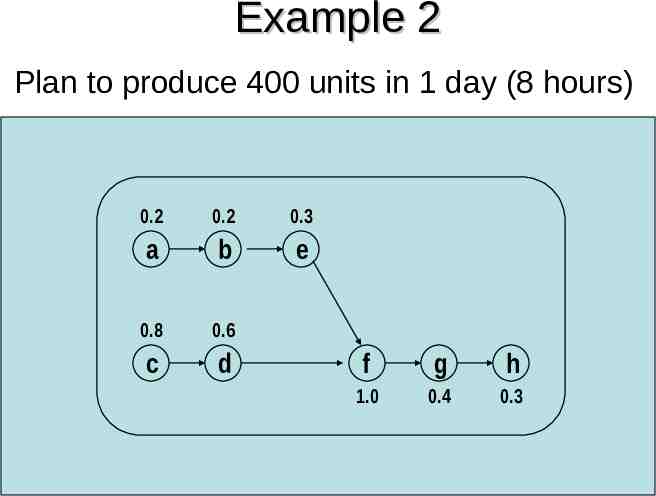
Example 2 Plan to produce 400 units in 1 day (8 hours) Task 0.2 a a b c d 0.8 e c f g h Immediate follower 0.3 b0.2 e eb d f0.6 fd f g 1.0 h end Task time (min) 0.2 0.2 0.8 0.6 0.3 g h 1.0 0.4 0.3 0.4 0.3
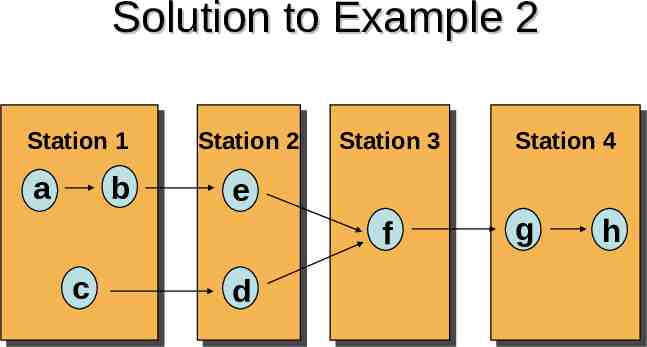
Solution to Example 2 Station 1 a b Station 2 Station 3 e f c Station 4 d g h
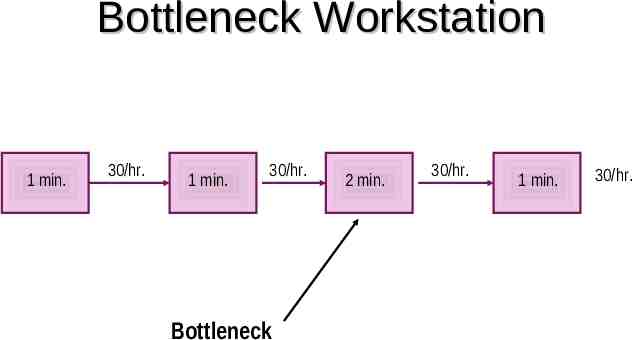
Bottleneck Workstation 1 min. 30/hr. 1 min. 30/hr. Bottleneck 2 min. 30/hr. 1 min. 30/hr.
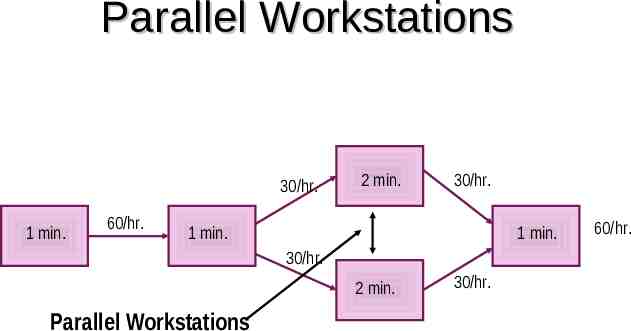
Parallel Workstations 30/hr. 1 min. 60/hr. 2 min. 30/hr. 1 min. 1 min. 30/hr. 2 min. Parallel Workstations 30/hr. 60/hr.
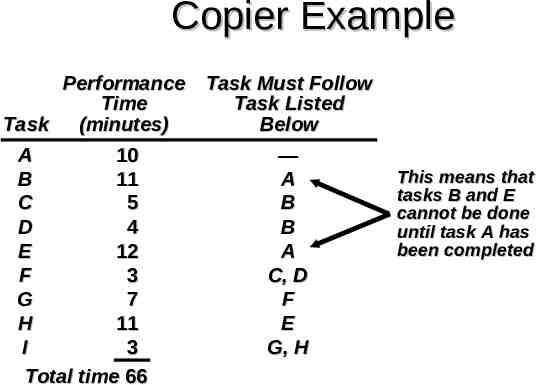
Copier Example Performance Task Must Follow Time Task Listed Task (minutes) Below A 10 — B 11 A C 5 B D 4 B E 12 A F 3 C, D G 7 F H 11 E I 3 G, H Total time 66 This means that tasks B and E cannot be done until task A has been completed
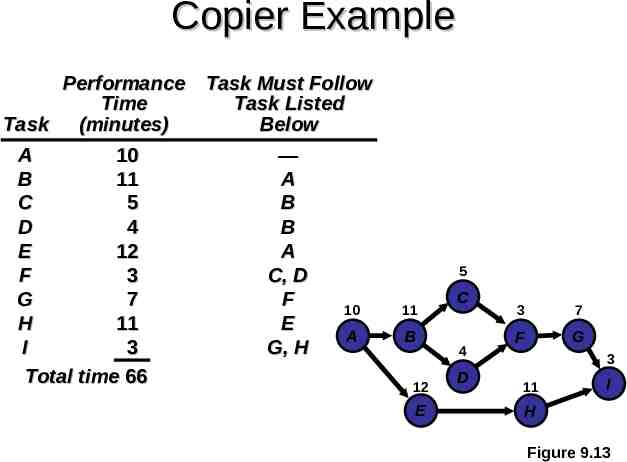
Copier Example Performance Task Must Follow Time Task Listed Task (minutes) Below A 10 — B 11 A C 5 B D 4 B E 12 A F 3 C, D G 7 F 10 H 11 E A I 3 G, H Total time 66 5 11 B 12 E C 4 D 3 7 F G 3 11 I H Figure 9.13
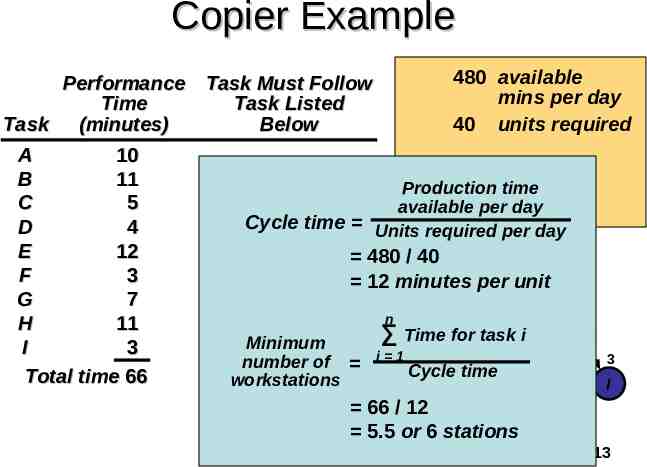
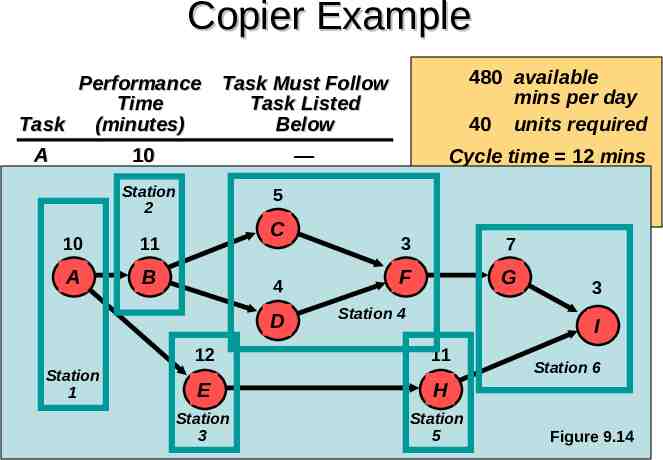
Copier Example 480 available Performance Task Must Follow mins per day Time Task Listed Task (minutes) Below 40 units required A 10 — B 11 A Production time C 5 B available per day Cycle D 4 B time Units required per day E 12 A 480 / 40 5 F 3 C, D 12 minutes per unit C G 7 F 10 11 3 7 n H 11 E for taskFi A Time B G Minimum I 3 G, H 4 3 number of i 1 Cycle Dtime Total time 66 workstations I 12 11 66 / 12 E H 5.5 or 6 stations Figure 9.13
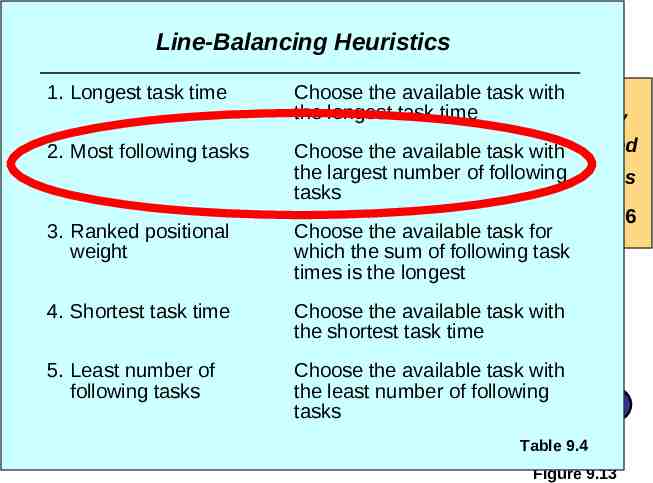
Copier Example Line-Balancing Heuristics 1. Longest task time Choose the available with 480task available Performance Task Must Follow the longest task time mins per day Time Task Listed Task2. Most (minutes) 40 task units following tasks Below Choose the available withrequired of following A 10 —the largest number Cycle time 12 mins B 11 Atasks Minimum 5.5 or 6 C 3. Ranked5 positional BChoose the available workstations task for D Bwhich the sum of following task weight 4 E 12 Atimes is the longest 5 F 3 C, D the available C task with G 4. Shortest 7 task time FChoose 10 11 3 7 the shortest task time H 11 E A B G F I 5. Least number 3 G, H of Choose the available 4 task with 3 the least number ofDfollowing Totalfollowing time 66tasks I 12 11 tasks E H Table 9.4 Figure 9.13
Copier Example 480 available Performance Task Must Follow mins per day Time Task Listed Task (minutes) Below 40 units required A 10 — Cycle time 12 mins B 11 A Minimum Station 5 C 52 B workstations 5.5 or 6 D 4 C B 11 3 7 E 10 12 A F A 3 C, D B F G 4 3 G 7 F D E Station 4 H 11 I I 3 G, H 12 11 Station 6 Stationtime 66 Total E H 1 Station 3 Station 5 Figure 9.14
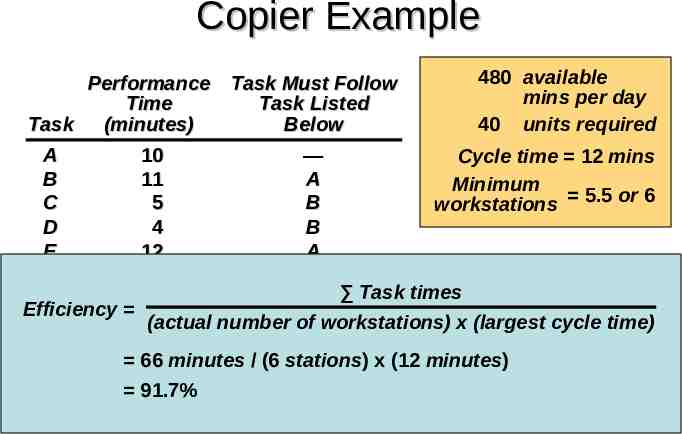
Copier Example 480 available Performance Task Must Follow mins per day Time Task Listed Task (minutes) Below 40 units required A 10 — Cycle time 12 mins B 11 A Minimum C 5 B workstations 5.5 or 6 D 4 B E 12 A F 3 C, D G 7 F Task times Efficiency (actual number ofE workstations) x (largest cycle time) H 11 I 3 G, H 66 minutes / (6 stations) x (12 minutes) Total time 66 91.7%
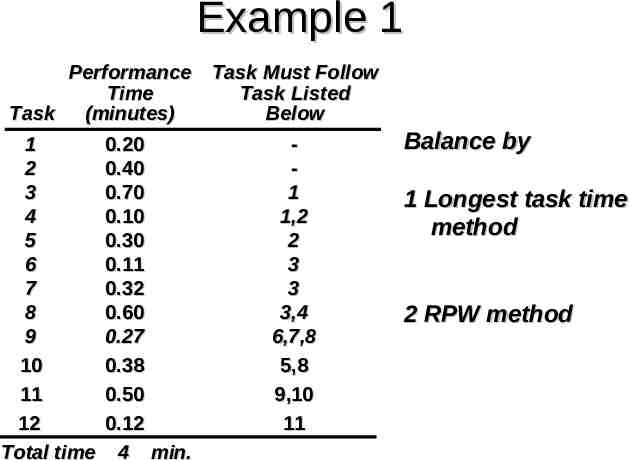
Example 1 Performance Task Must Follow Time Task Listed Task (minutes) Below 1 2 3 4 5 6 7 8 9 10 11 12 Total time 0.20 0.40 0.70 0.10 0.30 0.11 0.32 0.60 0.27 0.38 0.50 0.12 4 min. 1 1,2 2 3 3 3,4 6,7,8 5,8 9,10 11 Balance by 1 Longest task time method 2 RPW method
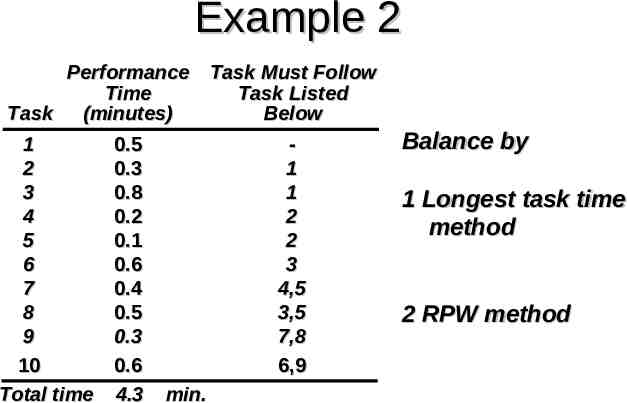
Example 2 Performance Task Must Follow Time Task Listed Task (minutes) Below 1 2 3 4 5 6 7 8 9 10 Total time 0.5 0.3 0.8 0.2 0.1 0.6 0.4 0.5 0.3 0.6 4.3 1 1 2 2 3 4,5 3,5 7,8 6,9 min. Balance by 1 Longest task time method 2 RPW method
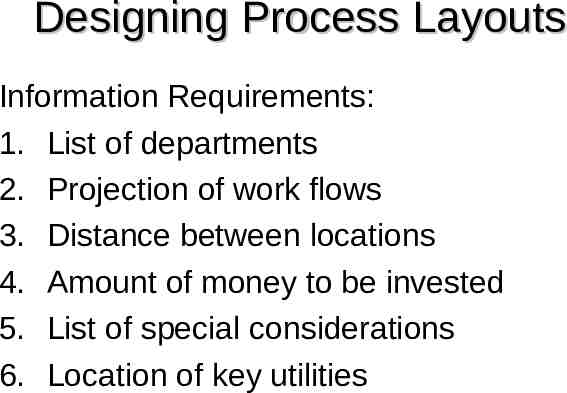
Designing Process Layouts Information Requirements: 1. List of departments 2. Projection of work flows 3. Distance between locations 4. Amount of money to be invested 5. List of special considerations 6. Location of key utilities
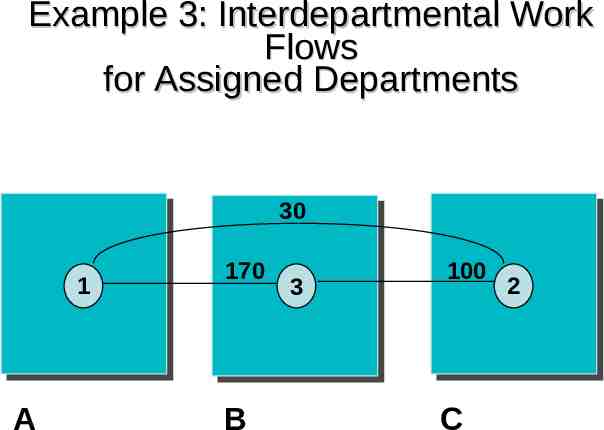
Example 3: Interdepartmental Work Flows for Assigned Departments 30 1 A 170 B 3 100 C 2
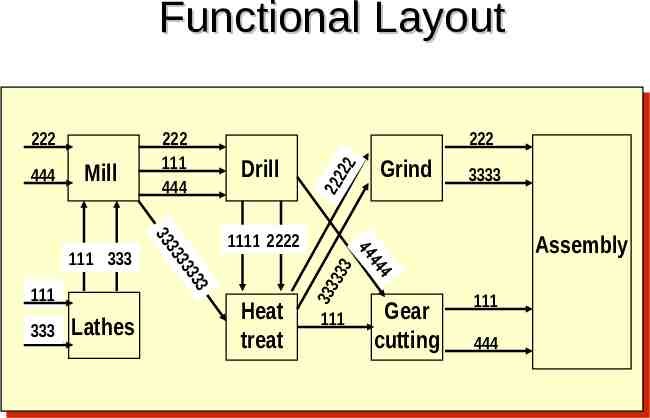
Functional Layout Mill 333 Lathes Drill 1111 2222 Heat treat 111 Grind 3333 Assembly 4 44 44 111 3 33 33 33 33 111 333 222 222 22 444 222 111 444 333 333 222 Gear cutting 111 444
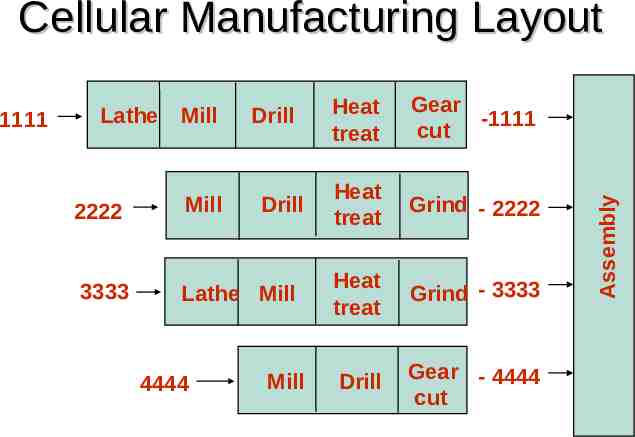
1111 Lathe Mill Drill 2222 Mill 3333 Lathe Mill 4444 Drill Mill Heat treat Gear -1111 cut Heat treat Grind - 2222 Heat treat Grind - 3333 Drill Gear - 4444 cut Assembly Cellular Manufacturing Layout
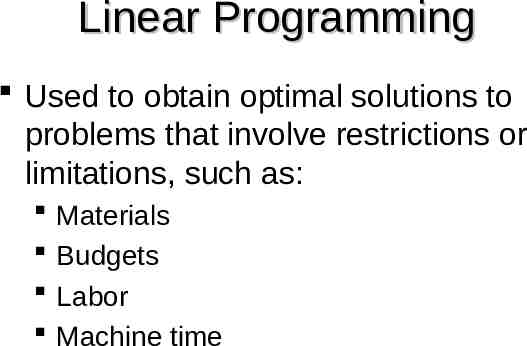
Linear Programming Used to obtain optimal solutions to problems that involve restrictions or limitations, such as: Materials Budgets Labor Machine time
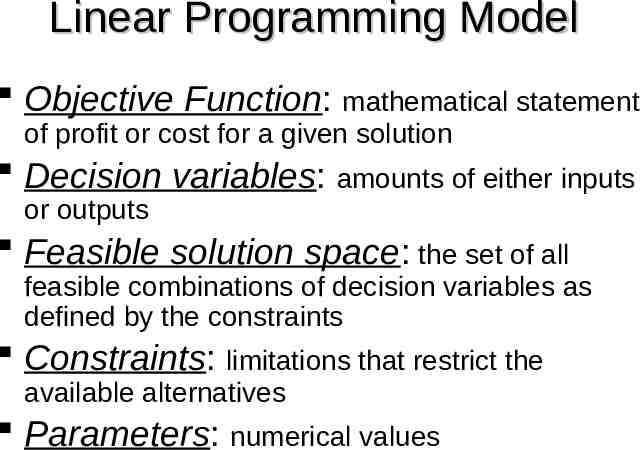
Linear Programming Model Objective Function: mathematical statement of profit or cost for a given solution Decision variables: amounts of either inputs or outputs Feasible solution space: the set of all feasible combinations of decision variables as defined by the constraints Constraints: limitations that restrict the available alternatives Parameters: numerical values
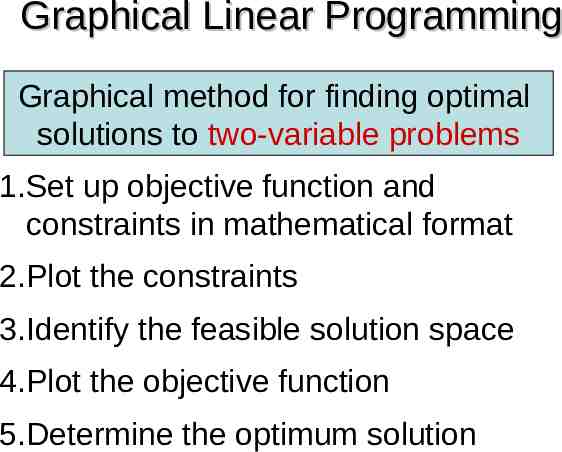
Graphical Linear Programming Graphical method for finding optimal solutions to two-variable problems 1.Set up objective function and constraints in mathematical format 2.Plot the constraints 3.Identify the feasible solution space 4.Plot the objective function 5.Determine the optimum solution
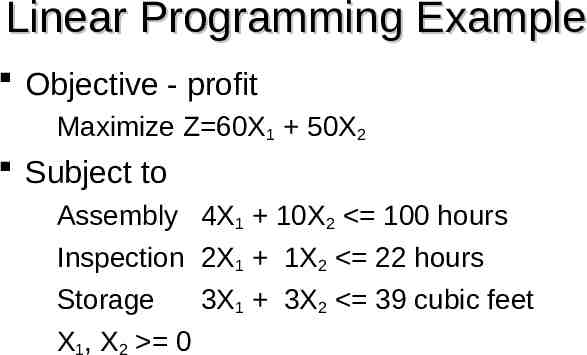
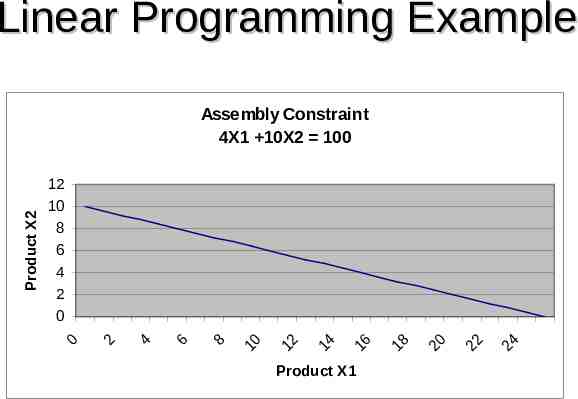
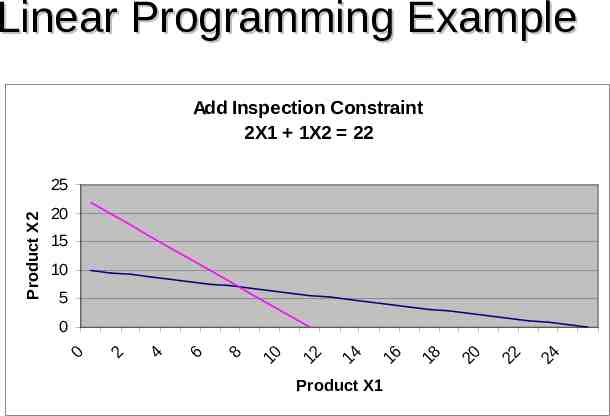
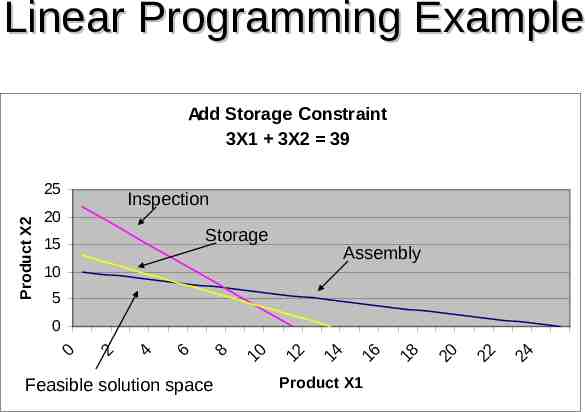
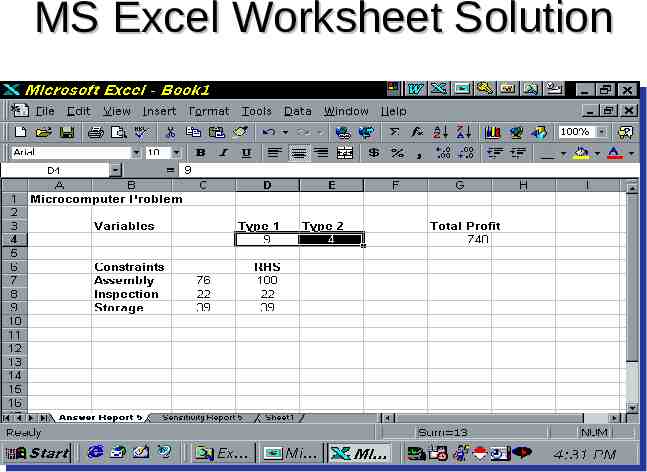
Linear Programming Example Objective - profit Maximize Z 60X1 50X2 Subject to Assembly 4X1 10X2 100 hours Inspection 2X1 1X2 22 hours Storage X1, X2 0 3X1 3X2 39 cubic feet
Linear Programming Example Product X2 Assembly Constraint 4X1 10X2 100 12 10 8 6 4 2 0 0 2 4 6 8 10 12 14 Product X1 16 18 20 22 24
Linear Programming Example Add Inspection Constraint 2X1 1X2 22 Product X2 25 20 15 10 5 0 0 2 4 6 8 10 12 14 Product X1 16 18 20 22 24
Linear Programming Example Add Storage Constraint 3X1 3X2 39 Product X2 25 Inspection 20 Storage 15 Assembly 10 5 0 0 2 4 6 Feasible solution space 8 10 12 14 Product X1 16 18 20 22 24
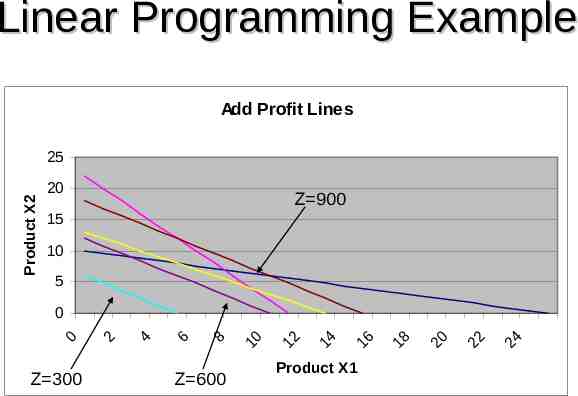
Linear Programming Example Add Profit Lines Product X2 25 20 Z 900 15 10 5 Z 300 Z 600 Product X1 24 22 20 18 16 14 12 10 8 6 4 2 0 0
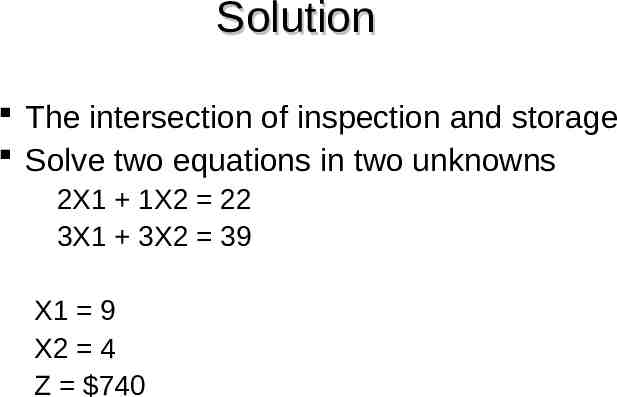
Solution The intersection of inspection and storage Solve two equations in two unknowns 2X1 1X2 22 3X1 3X2 39 X1 9 X2 4 Z 740
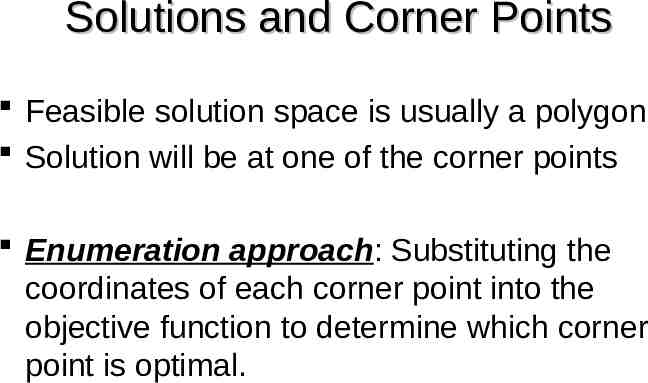
Solutions and Corner Points Feasible solution space is usually a polygon Solution will be at one of the corner points Enumeration approach: Substituting the coordinates of each corner point into the objective function to determine which corner point is optimal.
Simplex Method Simplex: a linear-programming algorithm that can solve problems having more than two decision variables
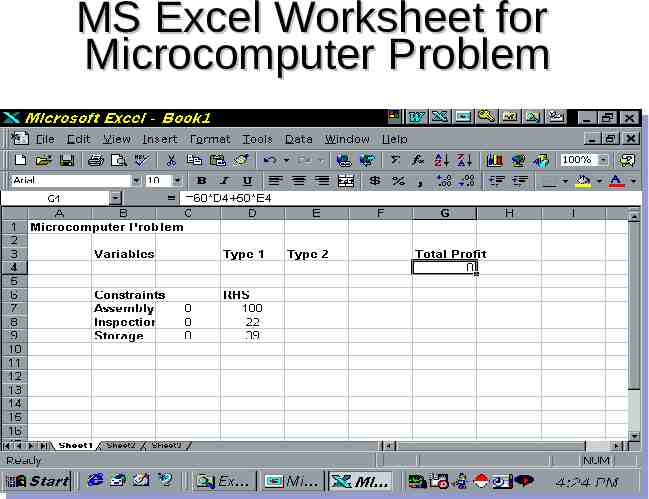
MS Excel Worksheet for Microcomputer Problem
MS Excel Worksheet Solution