OLAP Analysis and Design สอนโดย สุรน ิ ทร์ทิพ ศักดิ์ ภูวดล


40 Slides1.38 MB
OLAP Analysis and Design สอนโดย สุรน ิ ทร์ทิพ ศักดิ์ ภูวดล มหาวิทยาลัยพะเยา 1
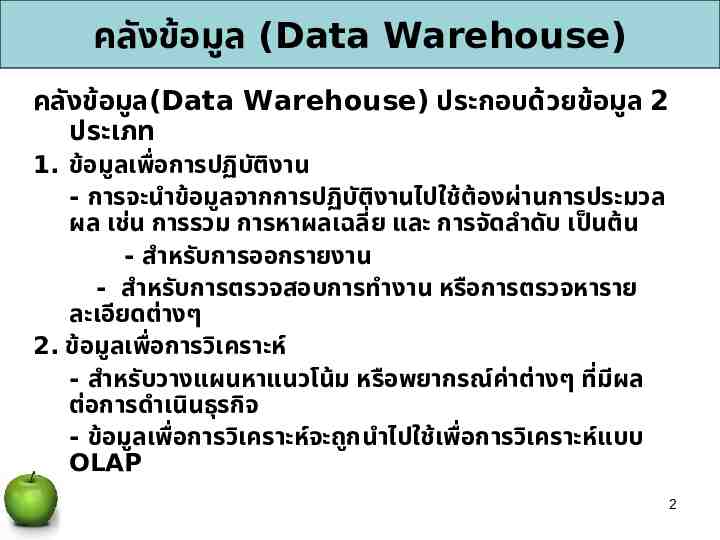
คลังข้อมูล (Data Warehouse) คลังข้อมูล(Data Warehouse) ประกอบด้วยข้อมูล 2 ประเภท 1. ข้อมูลเพื่อการปฏิบต ั ิงาน - การจะนำข้อมูลจากการปฏิบต ั ิงานไปใช้ต้องผ่านการประมวล ผล เช่น การรวม การหาผลเฉลี่ย และ การจัดลำดับ เป็นต้น - สำหรับการออกรายงาน - สำหรับการตรวจสอบการทำงาน หรือการตรวจหาราย ละเอียดต่างๆ 2. ข้อมูลเพื่อการวิเคราะห์ ี ล - สำหรับวางแผนหาแนวโน้ม หรือพยากรณ์ค่าต่างๆ ที่มผ ต่อการดำเนินธุรกิจ - ข้อมูลเพื่อการวิเคราะห์จะถูกนำไปใช้เพื่อการวิเคราะห์แบบ OLAP 2
Dimensional Data Model 3
Dimensional Data Model แบบจำลองข้อมูลเชิงมิติ Measures หมายถึง ข้อมูลที่ต้องการใช้เพื่อการวัด ทัง ้ ใน เชิงปริมาณ (Quantitative) และเชิง คุณภาพ (Qualitative) ของสิง ่ ใดสิง ่ หนึ่ง เช่น ยอดขายรวม กำไร ค่าธรรมเนียม Measure จะเป็นข้อมูลตัวเลขเสมอ 4
Dimensional Data Model แบบจำลองข้อมูลเชิงมิติ Dimensions (มิติ) หมายถึง ข้อมูลที่เป็นมุมมองให้แก่ Measure เพื่อประโยชน์ในการ วิเคราะห์ขอ ้ มูล เช่น จังหวัด อำเภอ วัน ไตรมาส เดือน ปี 5
Dimensional Data Model แบบจำลองข้อมูลเชิงมิติ Facts Fact หมายถึงชุดของค่าที่เกิดจาก การจับคู่กันของ Dimension และ Measure ที่ทำให้เกิดค่าใดค่าหนึ่งที่มี ความหมายสามารถวัดค่าได้ และบอกเล่า ข้อเท็จจริง อย่างใดอย่างหนึ่ง 6
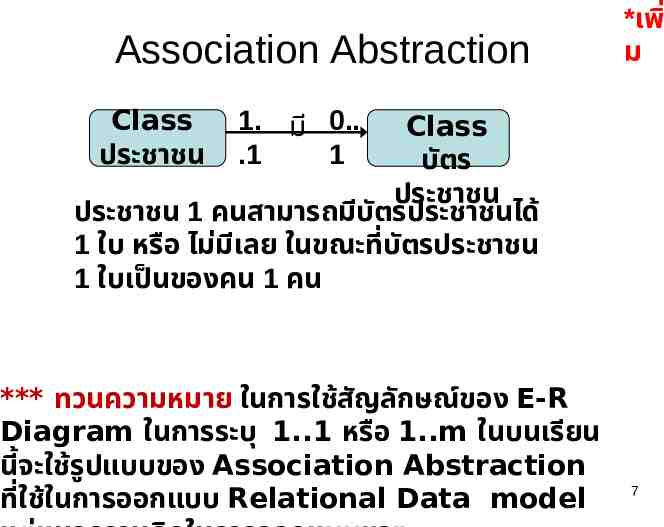
Association Abstraction Class ประชาชน *เพิ่ ม 1. มี 0. .1 1 Class บัตร ประชาชน ประชาชน 1 คนสามารถมีบต ั รประชาชนได้ 1 ใบ หรือ ไม่มเี ลย ในขณะที่บต ั รประชาชน 1 ใบเป็นของคน 1 คน *** ทวนความหมาย ในการใช้สญ ั ลักษณ์ของ E-R Diagram ในการระบุ 1.1 หรือ 1.m ในบนเรียน นี้จะใช้รูปแบบของ Association Abstraction ที่ใช้ในการออกแบบ Relational Data model 7
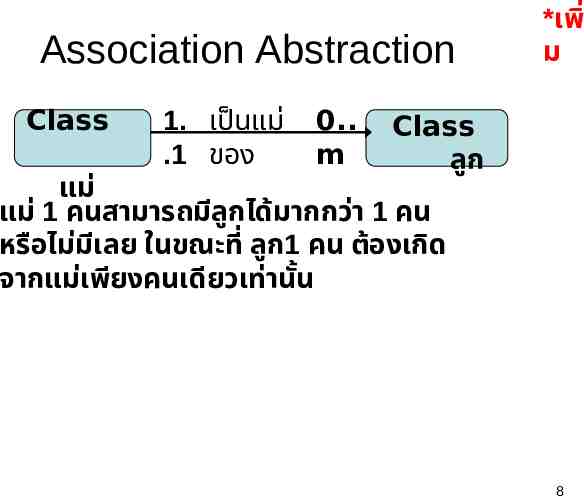
Association Abstraction Class 1. เป็นแม่ .1 ของ 0. m *เพิ่ ม Class ลูก แม่ แม่ 1 คนสามารถมีลก ู ได้มากกว่า 1 คน หรือไม่มเี ลย ในขณะที่ ลูก1 คน ต้องเกิด จากแม่เพียงคนเดียวเท่านัน ้ 8
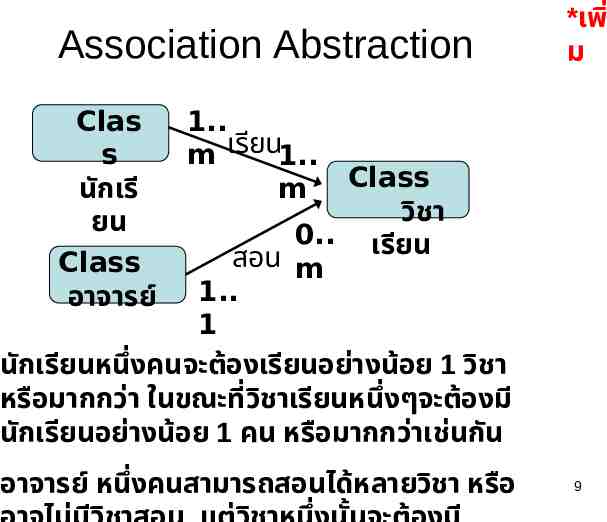
Association Abstraction Clas s นักเรี ยน Class อาจารย์ *เพิ่ ม 1. m เรียน1. m Class วิชา 0. เรียน สอน m 1. 1 นักเรียนหนึ่งคนจะต้องเรียนอย่างน้อย 1 วิชา หรือมากกว่า ในขณะที่วช ิ าเรียนหนึ่งๆจะต้องมี นักเรียนอย่างน้อย 1 คน หรือมากกว่าเช่นกัน อาจารย์ หนึ่งคนสามารถสอนได้หลายวิชา หรือ 9
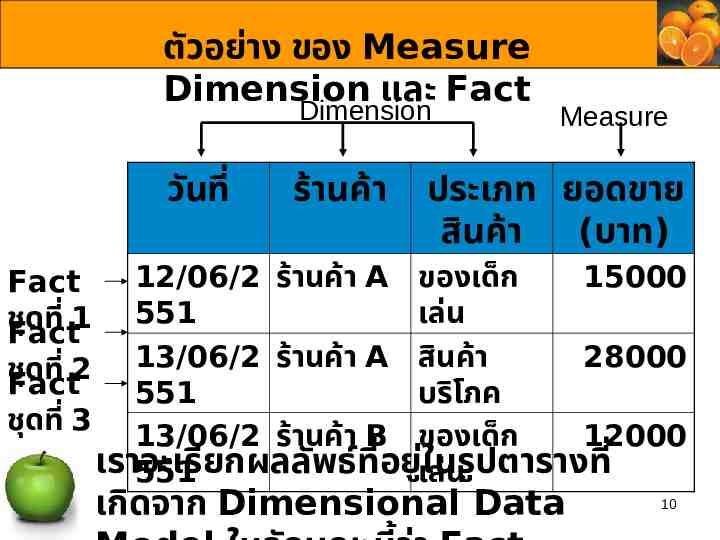
ตัวอย่าง ของ Measure Dimension และ Fact Dimension วันที่ Fact ชุดที่ 1 Fact ชุดที่ 2 Fact ชุดที่ 3 ร้านค้า Measure ประเภท ยอดขาย สินค้า (บาท) 12/06/2 ร้านค้า A ของเด็ก 15000 551 เล่น 13/06/2 ร้านค้า A สินค้า 28000 551 บริโภค 13/06/2 ร้านค้า B ของเด็ก 12000 เราจะเรี ใ่ นรู 551 ยกผลลัพธ์ที่อยูเล่ น ปตารางที่ เกิดจาก Dimensional Data 10
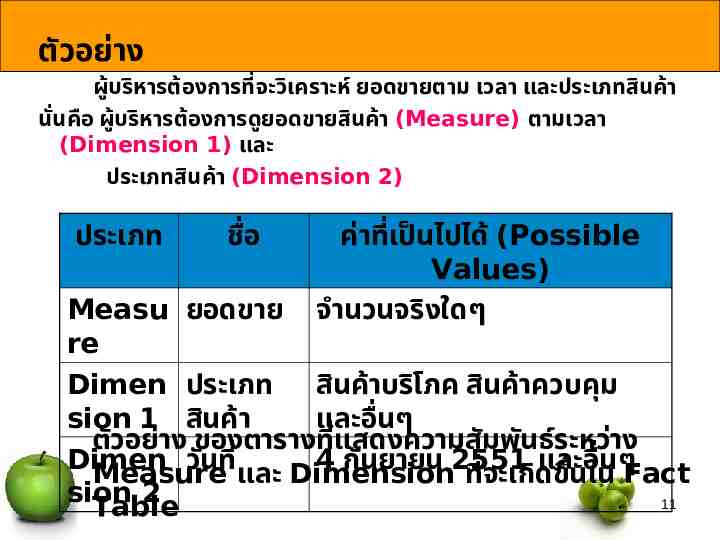
ตัวอย่าง ผู้บริหารต้องการที่จะวิเคราะห์ ยอดขายตาม เวลา และประเภทสินค้า นัน ่ คือ ผู้บริหารต้องการดูยอดขายสินค้า (Measure) ตามเวลา (Dimension 1) และ ประเภทสินค้า (Dimension 2) ประเภท ชื่อ ค่าที่เป็นไปได้ (Possible Values) จำนวนจริงใดๆ Measu ยอดขาย re Dimen ประเภท สินค้าบริโภค สินค้าควบคุม sion 1 สินค้า และอื่นๆ ตัวอย่าง ของตารางที่แสดงความสัมพันธ์ระหว่าง Dimen วันที่ และ Dimension 4 กันยายน 2551 และอื ่ นๆFact Measure ที่จะเกิด ขึน ้ ใน sion 2 11 Table
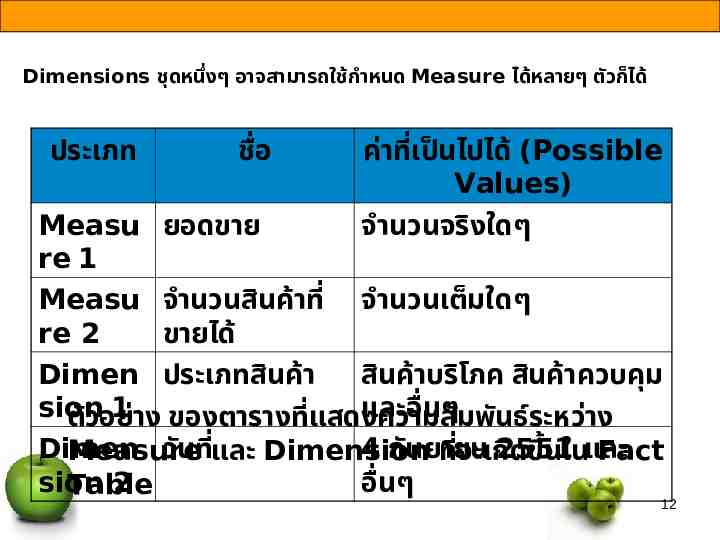
Dimensions ชุดหนึ่งๆ อาจสามารถใช้กำหนด Measure ได้หลายๆ ตัวก็ได้ ประเภท ชื่อ ค่าที่เป็นไปได้ (Possible Values) จำนวนจริงใดๆ Measu ยอดขาย re 1 Measu จำนวนสินค้าที่ จำนวนเต็มใดๆ re 2 ขายได้ Dimen ประเภทสินค้า สินค้าบริโภค สินค้าควบคุม sion 1 าง ของตารางที่แสดงความสั และอื่นๆมพันธ์ระหว่าง ตัวอย่ ่ Dimen วันทีและ 4 กันยายน Measure Dimension ที่จะเกิ2551 ดขึน ้ ในและ Fact sion 2 อื่นๆ Table 12
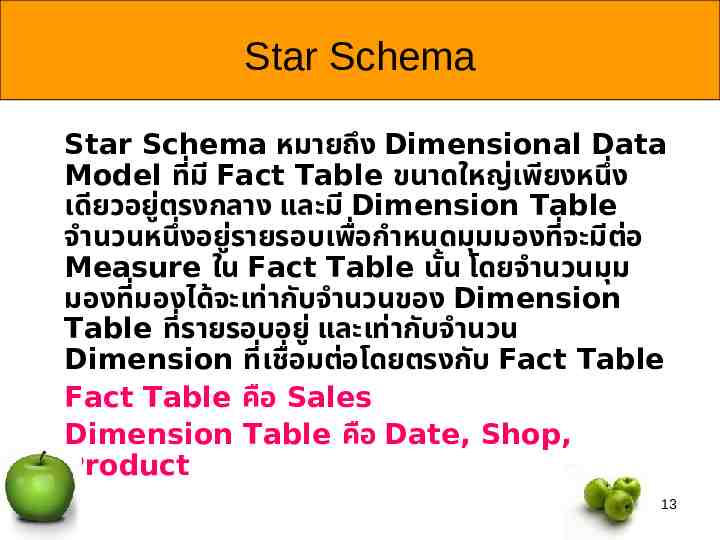
Star Schema Star Schema หมายถึง Dimensional Data Model ที่มี Fact Table ขนาดใหญ่เพียงหนึ่ง เดียวอยูต ่ รงกลาง และมี Dimension Table จำนวนหนึ่งอยูร ่ ายรอบเพื่อกำหนดมุมมองที่จะมีต่อ Measure ใน Fact Table นัน ้ โดยจำนวนมุม มองที่มองได้จะเท่ากับจำนวนของ Dimension Table ที่รายรอบอยู่ และเท่ากับจำนวน Dimension ที่เชื่อมต่อโดยตรงกับ Fact Table Fact Table คือ Sales Dimension Table คือ Date, Shop, Product 13
Star Schema 1. ให้นำทุก Primary Key จาก Dimension Table มาใส่ใน Fact Table 2. ความสัมพันธ์ระหว่าง Dimension กับ Fact Table มักเป็น 1 to many ซึ่ง 1 อยูฝ ่ ่ ัง Dimension ส่วน many อยูฝ ่ ่ ัง Fact Table 3. Measure มักเป็นตัวเลขที่คำนวณ และ นับได้ 4. Attribute ที่อยูใ่ น ตาราง Dimension ส่วนใหญ่ เป็นตัวอักษร(Varchar) หรือตัวเลขที่ไม่สามารถ คำนวณได้ เช่น วันที่ เวลา รหัสสินค้า 14
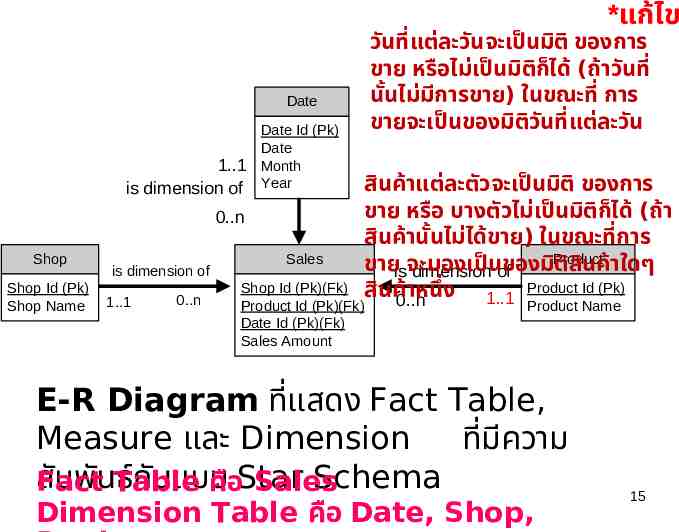
*แก้ไข Date Date Id (Pk) Date 1.1 Month is dimension of Year 0.n Shop Shop Id (Pk) Shop Name is dimension of 1.1 0.n Sales Shop Id (Pk)(Fk) Product Id (Pk)(Fk) Date Id (Pk)(Fk) Sales Amount วันที่แต่ละวันจะเป็นมิติ ของการ ขาย หรือไม่เป็นมิติก็ได้ (ถ้าวันที่ ี ารขาย) ในขณะที่ การ นัน ้ ไม่มก ขายจะเป็นของมิติวน ั ที่แต่ละวัน สินค้าแต่ละตัวจะเป็นมิติ ของการ ขาย หรือ บางตัวไม่เป็นมิติก็ได้ (ถ้า สินค้านัน ้ ไม่ได้ขาย) ในขณะที่การ Product ขายisจะมองเป็ น ของมิ ติสน ิ ค้าใดๆ dimension of สินค้0.n าหนึ่ง 1.1 Product Id (Pk) Product Name E-R Diagram ที่แสดง Fact Table, Measure และ Dimension ที่มค ี วาม สั มพันTable ธ์กันแบบ Schema Fact คือStar Sales Dimension Table คือ Date, Shop, 15
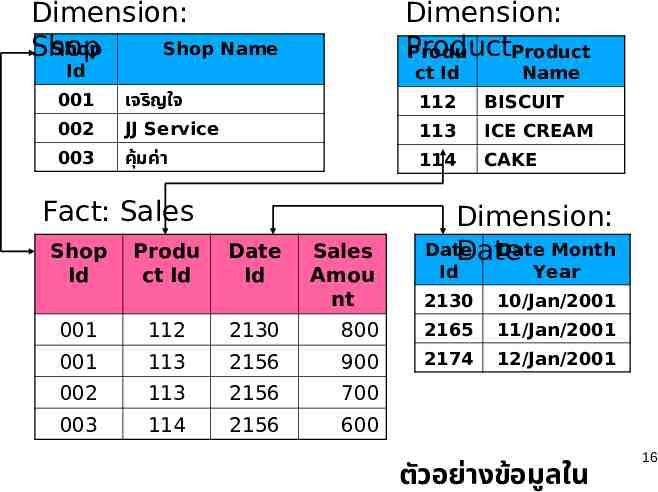
Dimension: Shop Shop Name Shop Dimension: Product Produ Product Id ct Id Name 001 เจริญใจ 112 BISCUIT 002 JJ Service 113 ICE CREAM 003 คุ้มค่า 114 CAKE Fact: Sales Shop Id Produ ct Id Date Id Dimension: Date Date Month Date Sales Amou nt Id Year 2130 10/Jan/2001 001 112 2130 800 2165 11/Jan/2001 001 113 2156 900 2174 12/Jan/2001 002 113 2156 700 003 114 2156 600 ตัวอย่างข้อมูลใน 16
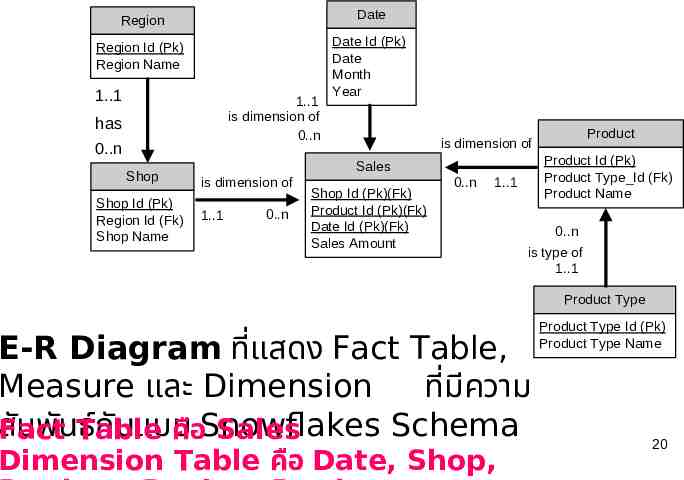
Snowflake Schema Snowflake Schema หมายถึง Dimensional Data Model ที่มี Fact Table ขนาดใหญ่เพียง หนึ่งเดียวอยูต ่ รงกลาง และมี Dimension Table จำนวนหนึ่งอยู่ รายรอบเพื่อกำหนดมุมมองที่จะมีต่อ Measure ใน Fact Table นัน ้ โดยจำนวนมุมมองที่มองได้จะเท่ากับจำนวนของ Dimension Table ที่รายรอบอยู่ แต่จะมากกว่าจำนวน Dimension ที่เชื่อมต่อ โดยตรงกับ Fact Table และ Dimension ที่ไม่ได้เชื่อมต่อโดยตรงกับ Fact Table จะมี ความสัมพันธ์กับ Dimension ตัวอื่นๆ Fact Table คือ Sales Dimension Table คือ Date, Shop, Product, Region, Product type 17
Snowflake Schema Snowflake Schema โดยจำนวนมุมมองที่มองได้จะเท่ากับจำนวนของ Dimension Table ที่รายรอบอยู่ คือ Date, Shop, Product, Region, Product type จำนวน Dimension ที่เชื่อมต่อโดยตรงกับ Fact Table คือ Date, Shop, Product 18
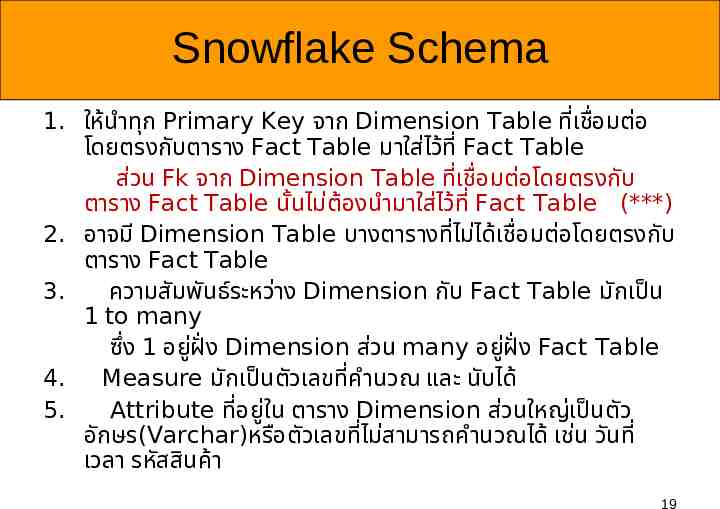
Snowflake Schema 1. ให้นำทุก Primary Key จาก Dimension Table ที่เชื่อมต่อ โดยตรงกับตาราง Fact Table มาใส่ไว้ที่ Fact Table ส่วน Fk จาก Dimension Table ที่เชื่อมต่อโดยตรงกับ ตาราง Fact Table นัน ้ ไม่ต้องนำมาใส่ไว้ที่ Fact Table (***) 2. อาจมี Dimension Table บางตารางที่ไม่ได้เชื่อมต่อโดยตรงกับ ตาราง Fact Table 3. ความสัมพันธ์ระหว่าง Dimension กับ Fact Table มักเป็น 1 to many ซึ่ง 1 อยูฝ ่ ่ ัง Dimension ส่วน many อยูฝ ่ ่ ัง Fact Table 4. Measure มักเป็นตัวเลขที่คำนวณ และ นับได้ 5. Attribute ที่อยูใ่ น ตาราง Dimension ส่วนใหญ่เป็นตัว อักษร(Varchar)หรือตัวเลขที่ไม่สามารถคำนวณได้ เช่น วันที่ เวลา รหัสสินค้า 19
Region Date Region Id (Pk) Region Name Date Id (Pk) Date Month Year 1.1 1.1 is dimension of 0.n has 0.n Shop Shop Id (Pk) Region Id (Fk) Shop Name Product Id (Pk) Product Type Id (Fk) Product Name Sales is dimension of 1.1 0.n Product is dimension of Shop Id (Pk)(Fk) Product Id (Pk)(Fk) Date Id (Pk)(Fk) Sales Amount 0.n 1.1 0.n is type of 1.1 Product Type E-R Diagram ที่แสดง Fact Table, Measure และ Dimension ที่มค ี วาม สั มพันTable ธ์กันแบบ Schema Fact คือSnowflakes Sales Dimension Table คือ Date, Shop, Product Type Id (Pk) Product Type Name 20
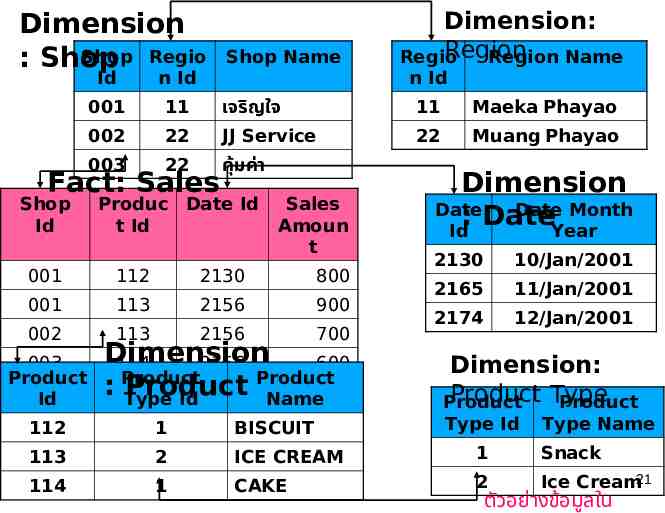
Dimension Shop Regio : Shop Id n Id 001 11 เจริญใจ 11 Maeka Phayao 002 22 JJ Service 22 Muang Phayao 003 22 คุ้มค่า Fact: Sales Shop Id Shop Name n Id Produc Date Id t Id Sales Amoun t 001 112 2130 800 001 113 2156 900 002 113 2156 700 003 Product Id Dimension: Region Regio Region Name Dimension 114 2156 600 Product : Product Product Type Id Name Dimension Date Date Month : Date Id Year 2130 10/Jan/2001 2165 11/Jan/2001 2174 12/Jan/2001 Dimension: Product Type Product Product Type Id Type Name 112 1 BISCUIT 113 2 ICE CREAM 1 Snack 114 1 CAKE 2 Ice Cream21 ตัวอย่างข้อมูลใน
OLAP และ Cubes OLAP (Online Analytical Processing) หมายถึงวิธก ี าร ที่ใช้ในการวิเคราะห์ขอ ้ มูลด้วย Dimension และ Fact Table โดย Fact Table และ Dimention Table จะถูกประมวล ผลให้พร้อมสำหรับการนำไปใช้งาน โดยการประมวล ผลอยูใ่ นรูปของลูกบาศก์ ที่มห ี ลายมิติ โดยภายใน บรรจุขอ ้ มูลที่มป ี ระโยชน์ต่อการวิเคราะห์ขอ ้ มูลที่อยู่ ภายในนัน ้ โดยมีจำนวนมิติเท่ากับจำนวนของ Dimention เราเรียกรูปทรงนี้วา่ Cube 22
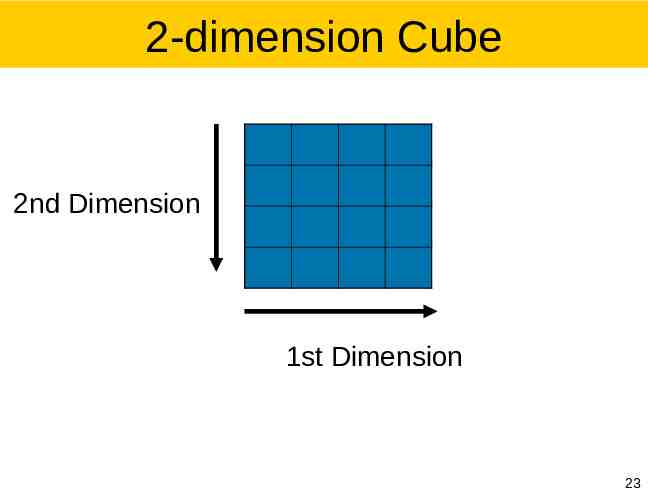
2-dimension Cube 2nd Dimension 1st Dimension 23
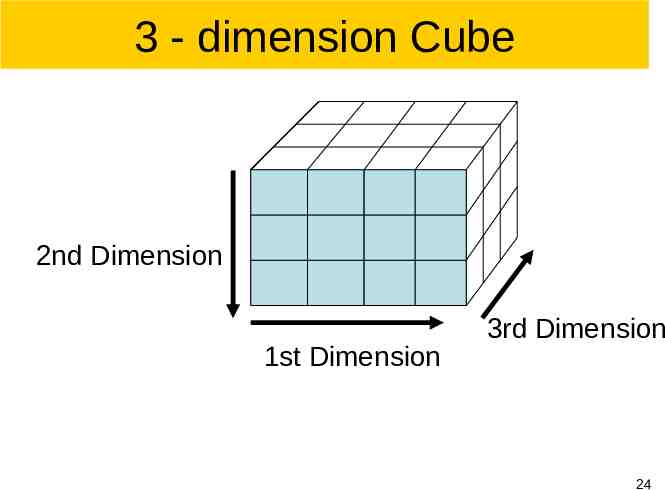
3 - dimension Cube 2nd Dimension 1st Dimension 3rd Dimension 24
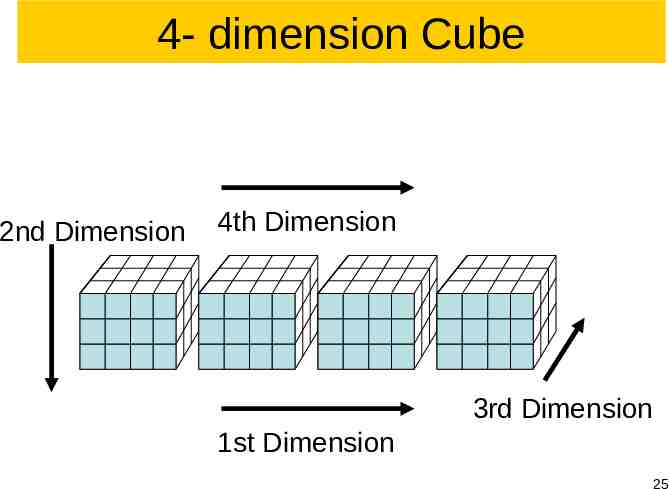
4- dimension Cube 2nd Dimension 4th Dimension 3rd Dimension 1st Dimension 25
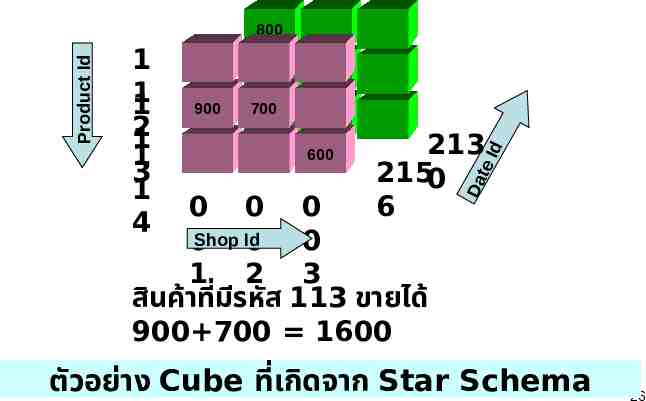
900 700 600 213 2150 6 0 0 0 0Shop Id 0 0 1 2 3 ี หัส 113 ขายได้ สินค้าที่มร 900 700 1600 Id 1 1 1 2 1 1 3 1 4 Da te Product Id 800 ตัวอย่าง Cube ที่เกิดจาก Star Schema 26
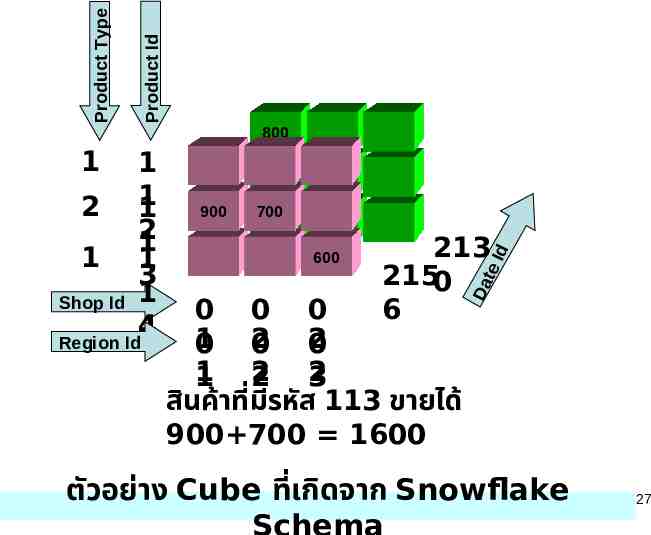
Product Id Product Type 800 1 700 600 213 2150 6 0 0 0 1 0 2 0 2 0 1 2 2 3 ี หัส 113 ขายได้ สินค้าที่มร 900 700 1600 Id 900 Da te 1 2 1 1 2 1 1 1 3 Shop Id 1 4 Region Id ตัวอย่าง Cube ที่เกิดจาก Snowflake 27
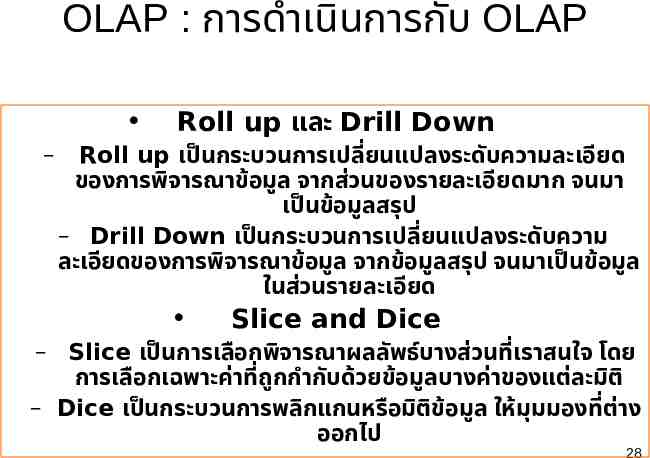
OLAP : การดำเนินการกับ OLAP – Roll up และ Drill Down Roll up เป็นกระบวนการเปลี่ยนแปลงระดับความละเอียด ของการพิจารณาข้อมูล จากส่วนของรายละเอียดมาก จนมา เป็นข้อมูลสรุป – Drill Down เป็นกระบวนการเปลี่ยนแปลงระดับความ ละเอียดของการพิจารณาข้อมูล จากข้อมูลสรุป จนมาเป็นข้อมูล ในส่วนรายละเอียด Slice and Dice – Slice เป็นการเลือกพิจารณาผลลัพธ์บางส่วนที่เราสนใจ โดย การเลือกเฉพาะค่าที่ถก ู กำกับด้วยข้อมูลบางค่าของแต่ละมิติ – Dice เป็นกระบวนการพลิกแกนหรือมิติขอ ้ มูล ให้มุมมองที่ต่าง ออกไป 28
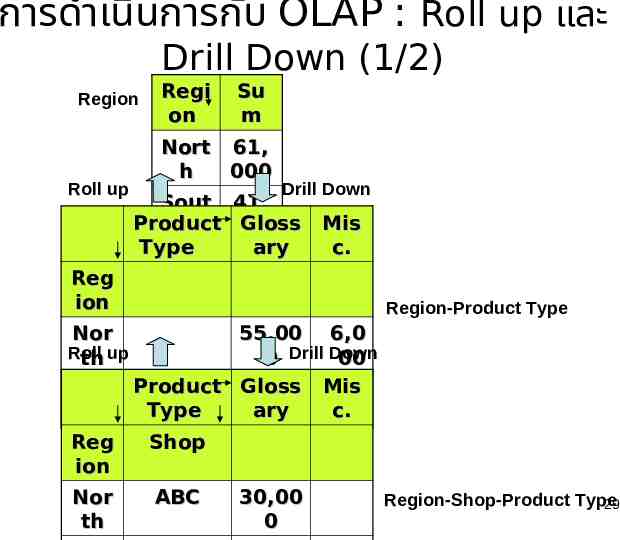
การดำเนินการกับ OLAP : Roll up และ Drill Down (1/2) Region Roll up Regi on Su m Nort 61, h 000 Drill Down Sout 41, Product Gloss h 500 Type ary Mis c. Reg ion Region-Product Type Nor Roll th up 55,00 6,0 0 Drill Down 00 Gloss Mis Sou Product 31,00 10, Type ary c. th 0 500 Reg Shop ion Nor th ABC 30,00 0 Region-Shop-Product Type 29
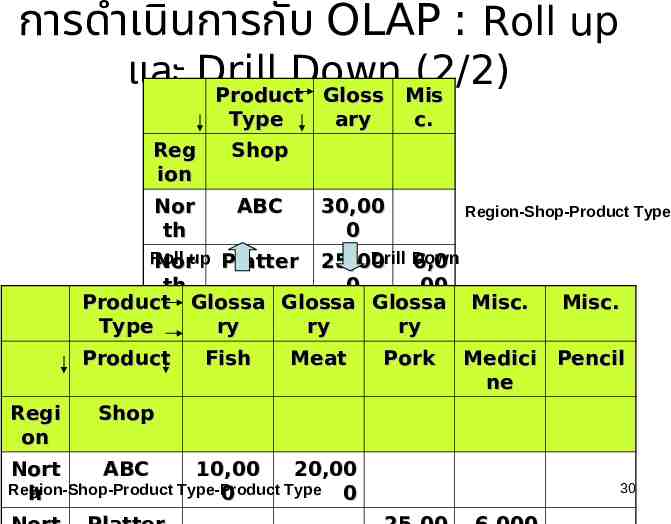
การดำเนินการกับ OLAP : Roll up และ Drill Down (2/2) Product Gloss Mis Type Reg ion Shop Nor th ABC ary 30,00 0 c. Region-Shop-Product Type Roll Norup Platter Drill Down 25,00 6,0 th 0 00 Product Glossa Glossa Glossa Misc. Misc. Sou Five 31,00 10, Type ry ry ry th Mart 0 500 Product Fish Meat Pork Medici Pencil ne Regi on Shop Nort ABC 10,00 20,00 Region-Shop-Product Type-Product Type 0 h 0 30
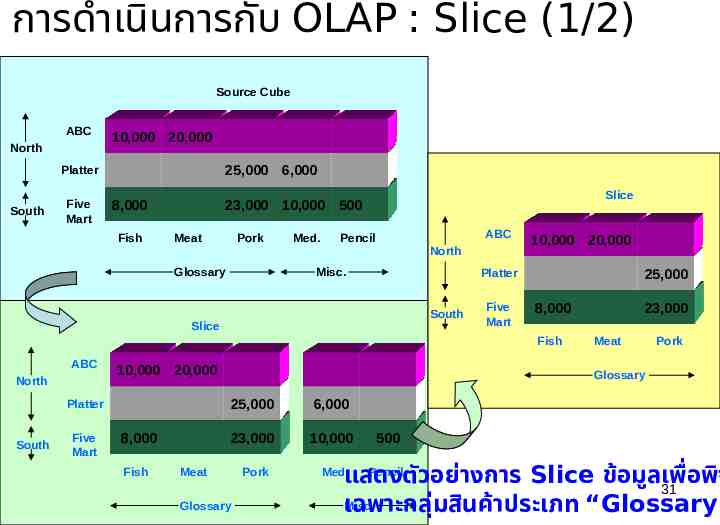
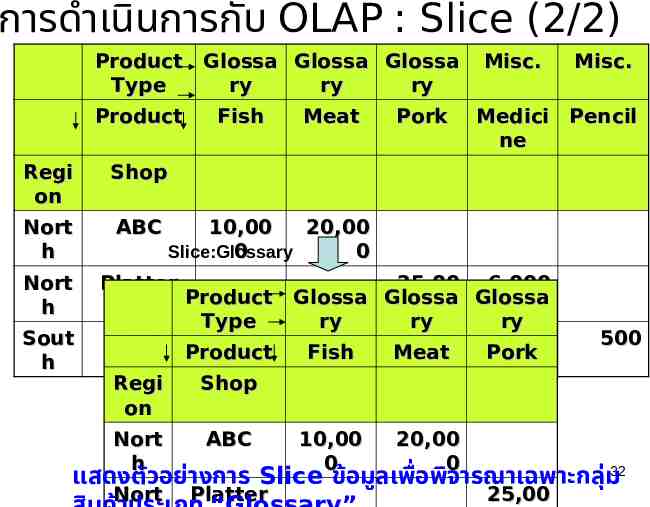
การดำเนินการกับ OLAP : Slice (1/2) Source Cube ABC North South 10,000 20,000 10,000 Platter 10,000 25,000 6,000 Five Mart 8,000 10,000 23,000 10,000 500 Fish Meat Pork Glossary Med. Slice ABC Pencil North Misc. South Slice 10,000 20,000 10,000 Platter 10,000 25,000 Five Mart 10,000 8,000 23,000 Fish ABC North South 10,000 20,000 10,000 10,000 25,000 6,000 Five Mart 10,000 8,000 23,000 10,000 Meat Glossary Pork Pork Glossary Platter Fish Meat 500 Pencil แสดงตั วอย่างการ Slice ข้อมูลเพื ่ อพิจ 31 Misc. เฉพาะกลุ ่มสินค้าประเภท “Glossary” Med.
การดำเนินการกับ OLAP : Slice (2/2) Product Glossa Glossa Glossa Type ry ry ry Product Regi on Shop Nort h ABC Nort h Platter Sout h Fish Meat Pork Misc. Misc. Medici Pencil ne 10,00 20,00 Slice:Glossary 0 0 25,00 6,000 Product Glossa Glossa 0 Glossa Type ry ry ry Five 8,000 23,00 10,00 Fish Meat0 Pork0 Mart Product Regi Shop on Nort h ABC Nort Platter 10,00 0 20,00 0 500 แสดงตัวอย่างการ Slice ข้อมูลเพื่อพิจารณาเฉพาะกลุ่ม32 25,00
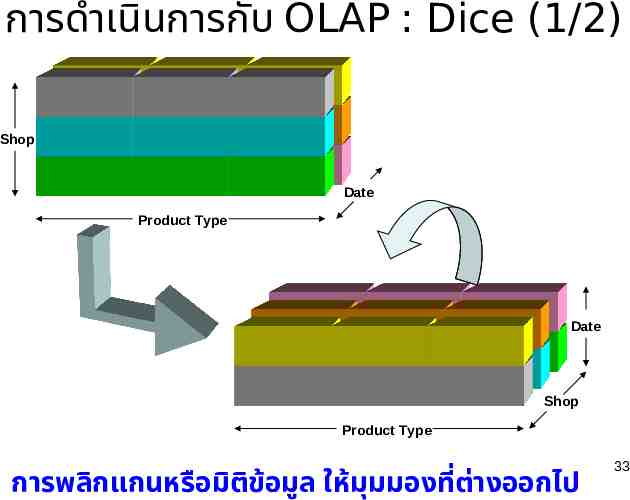
การดำเนินการกับ OLAP : Dice (1/2) Shop Date Product Type Date Shop Product Type การพลิกแกนหรือมิติขอ ้ มูล ให้มุมมองที่ต่างออกไป 33
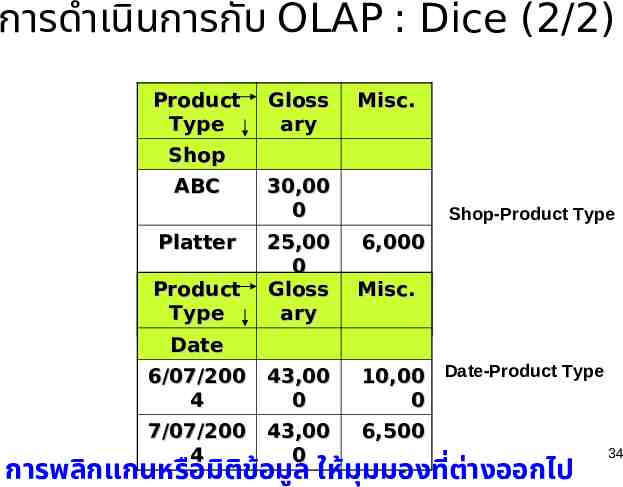
การดำเนินการกับ OLAP : Dice (2/2) Product Type Gloss ary Misc. Shop ABC Platter 30,00 0 Shop-Product Type Product Five Type Mart 25,00 0 Gloss 31,00 ary 0 Misc. 10,50 0 6/07/200 4 43,00 0 10,00 Date-Product Type 0 7/07/200 4 43,00 0 6,500 Date 6,000 การพลิกแกนหรือมิติขอ ้ มูล ให้มุมมองที่ต่างออกไป 34
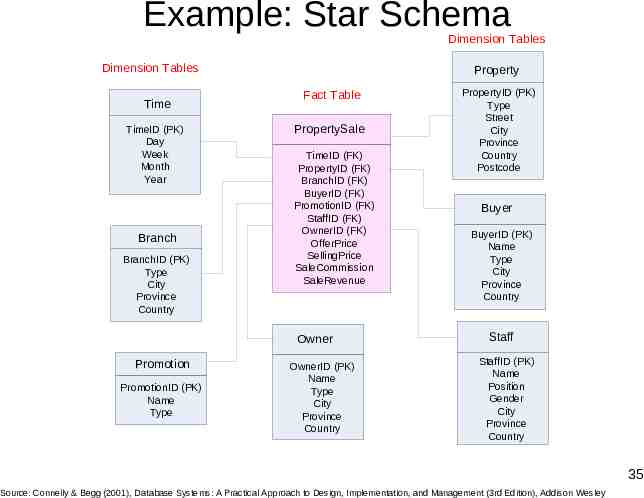
Example: Star Schema Dimension Tables Dimension Tables Time TimeID (PK) Day Week Month Year Branch BranchID (PK) Type City Province Country Property Fact Table PropertySale TimeID (FK) PropertyID (FK) BranchID (FK) BuyerID (FK) PromotionID (FK) StaffID (FK) OwnerID (FK) OfferPrice SellingPrice SaleCommission SaleRevenue Owner Promotion PromotionID (PK) Name Type OwnerID (PK) Name Type City Province Country PropertyID (PK) Type Street City Province Country Postcode Buyer BuyerID (PK) Name Type City Province Country Staff StaffID (PK) Name Position Gender City Province Country 35 Source: Connelly & Begg (2001), Database Systems: A Practical Approach to Design, Implementation, and Management (3rd Edition), Addison Wesley
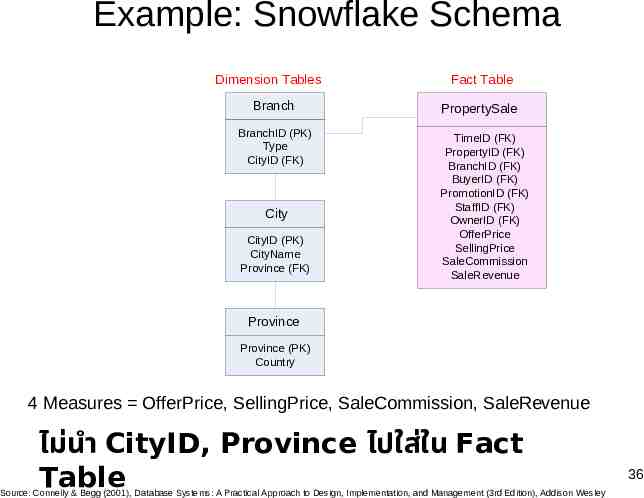
Example: Snowflake Schema Dimension Tables Branch BranchID (PK) Type CityID (FK) City CityID (PK) CityName Province (FK) Fact Table PropertySale TimeID (FK) PropertyID (FK) BranchID (FK) BuyerID (FK) PromotionID (FK) StaffID (FK) OwnerID (FK) OfferPrice SellingPrice SaleCommission SaleRevenue Province Province (PK) Country 4 Measures OfferPrice, SellingPrice, SaleCommission, SaleRevenue ไม่นำ CityID, Province ไปใส่ใน Fact Table Source: Connelly & Begg (2001), Database Systems: A Practical Approach to Design, Implementation, and Management (3rd Edition), Addison Wesley 36
Constellation Schema A Constellation Schema contains more than one fact table sharing one or more dimension tables – Multiple fact tables and dimension tables form ‘constellation’ of facts 37
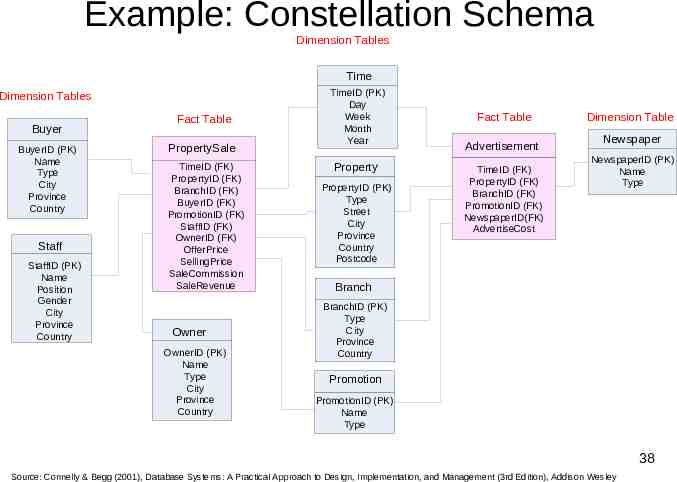
Example: Constellation Schema Dimension Tables Time Dimension Tables Buyer BuyerID (PK) Name Type City Province Country Staff StaffID (PK) Name Position Gender City Province Country Fact Table PropertySale TimeID (FK) PropertyID (FK) BranchID (FK) BuyerID (FK) PromotionID (FK) StaffID (FK) OwnerID (FK) OfferPrice SellingPrice SaleCommission SaleRevenue Owner OwnerID (PK) Name Type City Province Country TimeID (PK) Day Week Month Year Property PropertyID (PK) Type Street City Province Country Postcode Fact Table Advertisement TimeID (FK) PropertyID (FK) BranchID (FK) PromotionID (FK) NewspaperID(FK) AdvertiseCost Dimension Table Newspaper NewspaperID (PK) Name Type Branch BranchID (PK) Type City Province Country Promotion PromotionID (PK) Name Type 38 Source: Connelly & Begg (2001), Database Systems: A Practical Approach to Design, Implementation, and Management (3rd Edition), Addison Wesley
Fact constellation schema architecture For each star schema or snowflake schema it is possible to construct a fact co nstellation schema. This schema is more complex than star or snowflake architecture, which is because it contains multiple fact tables. This allows dimension tables to be shared among many fact tables. That solution is very flexible, however it may be hard to manage and support. http://etl-tools.info/en/bi/datawarehouse constellation-schema.htm 39
หนังสืออ้างอิง การออกแบบและพัฒนาคลังข้อมูล, กิตติพงศ์ กลมกล่อม เทอม 2 ปีการศึกษา 2562 40