New York University Payroll Assessment Final Report July 2009
39 Slides1.13 MB
New York University Payroll Assessment Final Report July 2009
Table of Contents Executive Summary Project Objectives and Approach Findings Opportunities Options Analysis and Recommendations Recommended Projects and Implementation Roadmap Appendix Copyright 2009 Accenture All Rights Reserved. 2
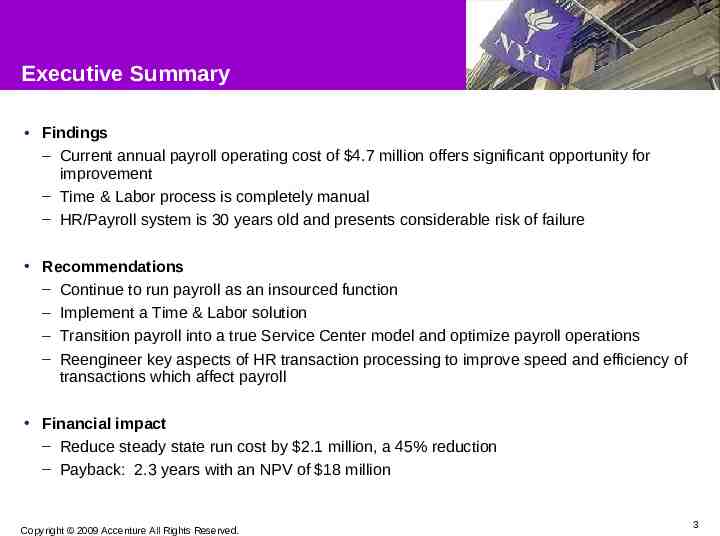
Executive Summary Findings – Current annual payroll operating cost of 4.7 million offers significant opportunity for improvement – Time & Labor process is completely manual – HR/Payroll system is 30 years old and presents considerable risk of failure Recommendations – Continue to run payroll as an insourced function – Implement a Time & Labor solution – Transition payroll into a true Service Center model and optimize payroll operations – Reengineer key aspects of HR transaction processing to improve speed and efficiency of transactions which affect payroll Financial impact – Reduce steady state run cost by 2.1 million, a 45% reduction – Payback: 2.3 years with an NPV of 18 million Copyright 2009 Accenture All Rights Reserved. 3
Executive Summary The to-be Payroll environment at NYU will have the following characteristics: – Run cost reduced by approximately 50% – Automation of all payroll-related processes – Elimination of the risk associated with an obsolete HR/Payroll system – Payroll department optimized for maximum efficiency – Payroll operating in a Service Center model – Simplified payroll processing calendar with fewer pay cycles – University-wide shift in behavior and mindset: More operational discipline and more timely processing Fewer exceptions Elimination of check distribution and reduction in check cashing services A self service model for data entry and issue resolution; examples: – Self service for employee personal data entry (e.g. time entry, address change) – Self service Employee Portal for procedure and policy information – 800 number for employee inquiries Copyright 2009 Accenture All Rights Reserved. 4
Project Objectives and Scope The objectives of the payroll assessment were to: – Investigate opportunities for improving accuracy, efficiency, and effectiveness across NYU’s US Payroll process Assess both short-term and long-term payroll considerations Benchmark payroll operational metrics and compare to leading practices with specific focus on operational efficiency, cost-to-serve, field/input compliance, and payroll work/activity distribution – Analyze payroll service delivery alternatives (in-source/outsource) and supporting technology – Define a high-level roadmap and go-forward recommendation – Develop a financial analysis of options including one-time and ongoing costs aligned with the proposed roadmap and recommendation The assessment focused on NYU’s US payroll operation including Time & Labor (T&L) as a key input/component to payroll processing; the scope of the assessment also included: – Payroll transaction and exception processing – Supporting payroll related technology – Payroll processing procedures & documentation – Overall payroll process compliance (payroll operations and input dependencies) – Processing of HR transactions which affect payroll Note: see Appendix for more details on Project Approach Copyright 2009 Accenture All Rights Reserved. 5
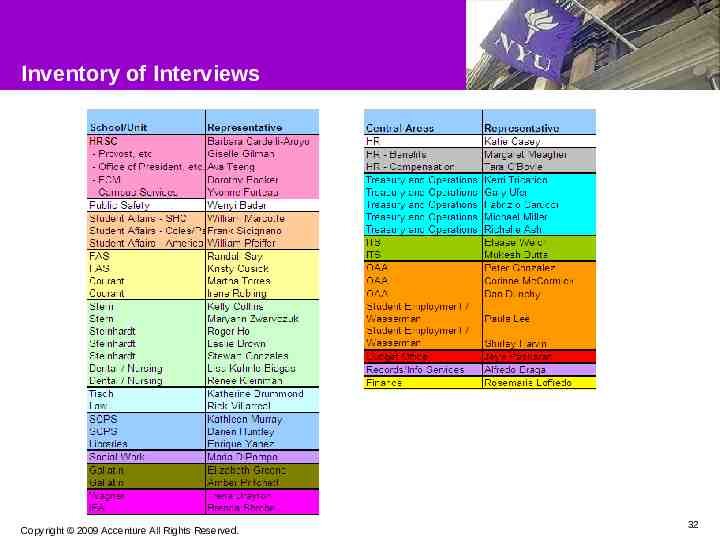
Data Gathering for the Project Data gathering consisted of two activities: – Building a fact base of current state data: operating costs, third party services and costs, transaction types and volumes, service delivery structure, pay processing calendars, technology applications, etc. – Conducting a total of 18 interviews, involving 48 NYU personnel, to understand the roles, procedures, issues, opportunities, and challenges with the current payroll process Schools/Units – Time data collection, review, and submission; HR transaction preparation and entry Central Areas – Time data entry and payroll processing; Academic Appointments; HR, Benefits, and IT Support Note: see Appendix for the detailed inventory of interviews/interviewees Copyright 2009 Accenture All Rights Reserved. 6
Themes/Findings from the Interviews Time & Labor processing is almost 100% manual Onboarding and other upstream HR activities cause delays in the entry of HR transactions, which then create late payroll transactions There is a lot of complexity inherent in a new hire transaction which often results in delays and late processing There are an unusually high number of reviews and approvals in the end-to-end process There is no standardization of Time and HR processes/roles within the Schools/Units A majority of the complexity and issues within the Schools/Units is with the cost accounting associated with Pay and HR transactions, not the payroll transaction per se End users want better access to information – about employee data and about payrollrelated processes and procedures There is no standard tracking mechanism for Sick/Vacation time (some schools use shadow systems, others do it manually); this information is very frequently not accurate While overall customer service from the central Payroll department is viewed favorably, there is considerable reliance on individual contacts/relationships to resolve issues – there is no “service center” model for customer service There are fundamental limitations with the Integral system, and fundamental risk of failure with the Integral Payroll module Current check distribution procedures are cumbersome and costly Copyright 2009 Accenture All Rights Reserved. 7
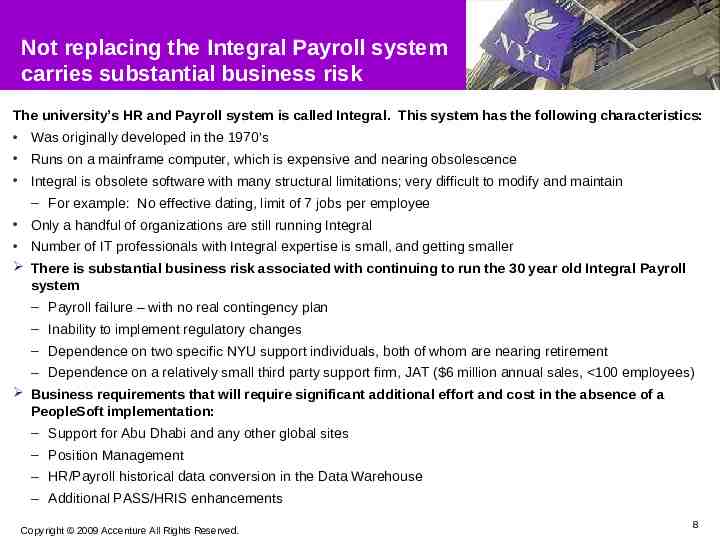
Not replacing the Integral Payroll system carries substantial business risk The university’s HR and Payroll system is called Integral. This system has the following characteristics: Was originally developed in the 1970’s Runs on a mainframe computer, which is expensive and nearing obsolescence Integral is obsolete software with many structural limitations; very difficult to modify and maintain – For example: No effective dating, limit of 7 jobs per employee Only a handful of organizations are still running Integral Number of IT professionals with Integral expertise is small, and getting smaller There is substantial business risk associated with continuing to run the 30 year old Integral Payroll system – Payroll failure – with no real contingency plan – Inability to implement regulatory changes – Dependence on two specific NYU support individuals, both of whom are nearing retirement – Dependence on a relatively small third party support firm, JAT ( 6 million annual sales, 100 employees) Business requirements that will require significant additional effort and cost in the absence of a PeopleSoft implementation: – Support for Abu Dhabi and any other global sites – Position Management – HR/Payroll historical data conversion in the Data Warehouse – Additional PASS/HRIS enhancements Copyright 2009 Accenture All Rights Reserved. 8
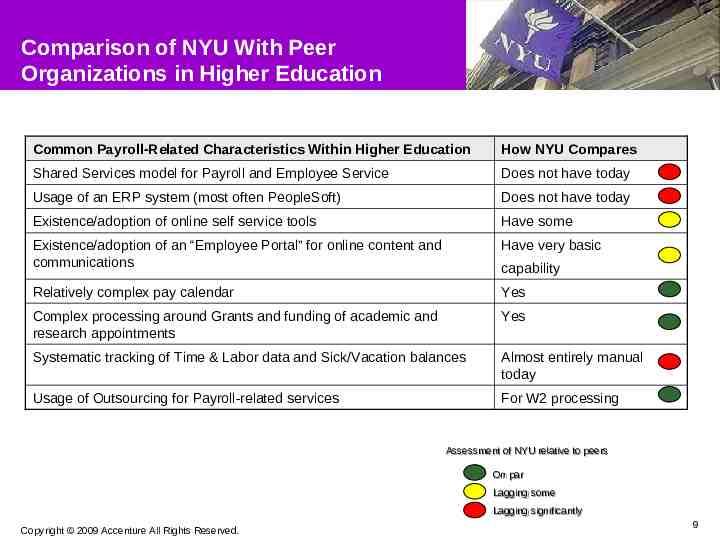
Comparison of NYU With Peer Organizations in Higher Education Common Payroll-Related Characteristics Within Higher Education How NYU Compares Shared Services model for Payroll and Employee Service Does not have today Usage of an ERP system (most often PeopleSoft) Does not have today Existence/adoption of online self service tools Have some Existence/adoption of an “Employee Portal” for online content and communications Have very basic Relatively complex pay calendar Yes Complex processing around Grants and funding of academic and research appointments Yes Systematic tracking of Time & Labor data and Sick/Vacation balances Almost entirely manual today Usage of Outsourcing for Payroll-related services For W2 processing capability Assessment Assessment of of NYU NYU relative relative to to peers peers On On par par Lagging Lagging some some Lagging Lagging significantly significantly Copyright 2009 Accenture All Rights Reserved. 9
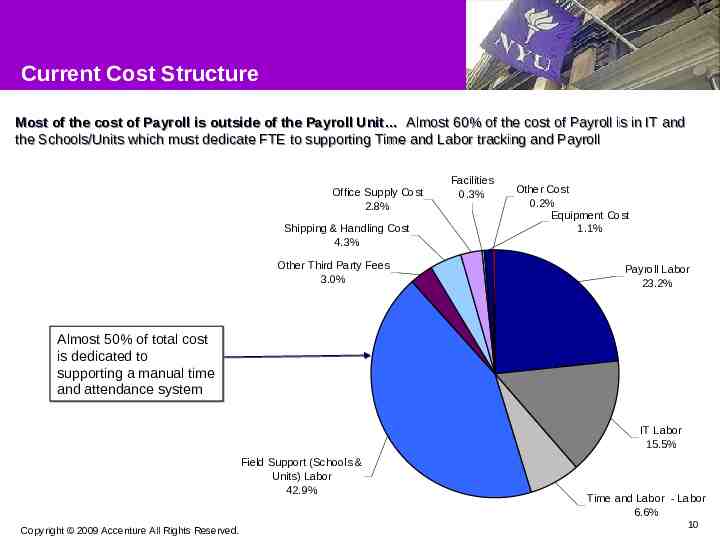
Current Cost Structure Most of the cost of Payroll is outside of the Payroll Unit Almost 60% of the cost of Payroll is in IT and the Schools/Units which must dedicate FTE to supporting Time and Labor tracking and Payroll Office Supply Cost 2.8% Shipping & Handling Cost 4.3% Other Third Party Fees 3.0% Facilities 0.3% Other Cost 0.2% Equipment Cost 1.1% Payroll Labor 23.2% Almost 50% of total cost is dedicated to supporting a manual time and attendance system IT Labor 15.5% Field Support (Schools & Units) Labor 42.9% Copyright 2009 Accenture All Rights Reserved. Time and Labor - Labor 6.6% 10
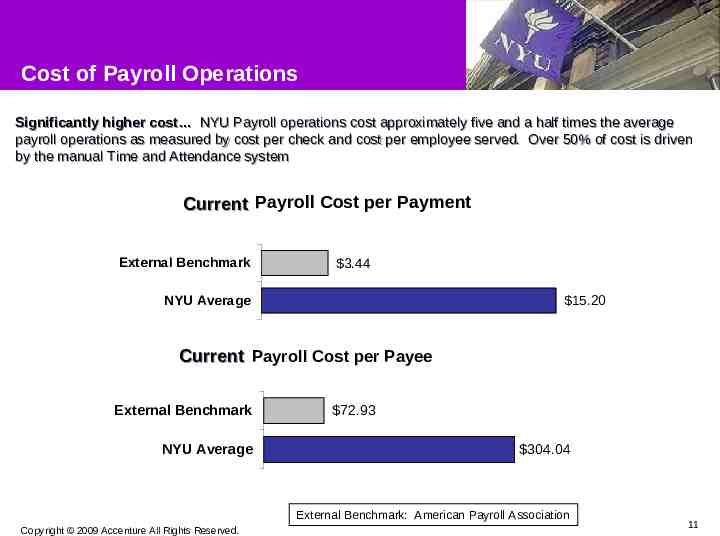
Cost of Payroll Operations Significantly higher cost NYU Payroll operations cost approximately five and a half times the average payroll operations as measured by cost per check and cost per employee served. Over 50% of cost is driven by the manual Time and Attendance system Current Payroll Cost per Payment External Benchmark 3.44 NYU Average 15.20 Current Payroll Cost per Payee External Benchmark NYU Average 72.93 304.04 External Benchmark: American Payroll Association Copyright 2009 Accenture All Rights Reserved. 11
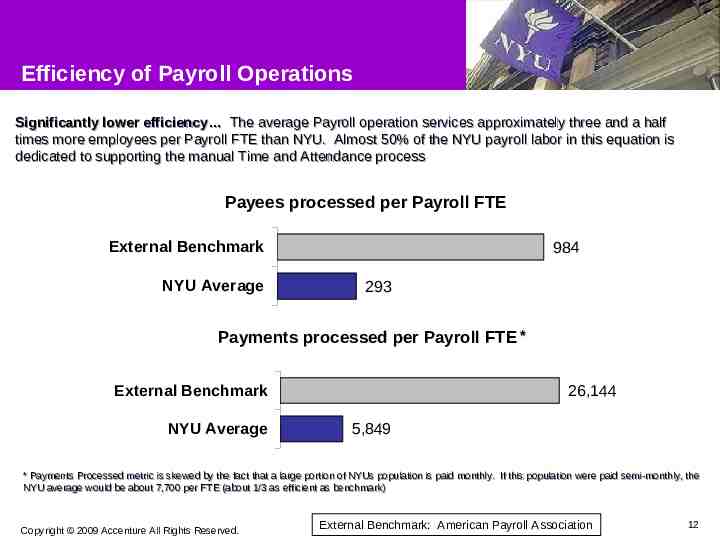
Efficiency of Payroll Operations Significantly lower efficiency The average Payroll operation services approximately three and a half times more employees per Payroll FTE than NYU. Almost 50% of the NYU payroll labor in this equation is dedicated to supporting the manual Time and Attendance process Payees processed per Payroll FTE External Benchmark NYU Average 984 293 Payments processed per Payroll FTE * External Benchmark NYU Average 26,144 5,849 ** Payments Payments Processed Processed metric metric is is skewed skewed by by the the fact fact that that aa large large portion portion of of NYUs NYUs population population is is paid paid monthly. monthly. IfIf this this population population were were paid paid semi-monthly, the NYU NYU average average would would be be about about 7,700 7,700 per per FTE FTE (about (about 1/3 1/3 as as efficient efficient as as benchmark) benchmark) Copyright 2009 Accenture All Rights Reserved. External Benchmark: American Payroll Association 12
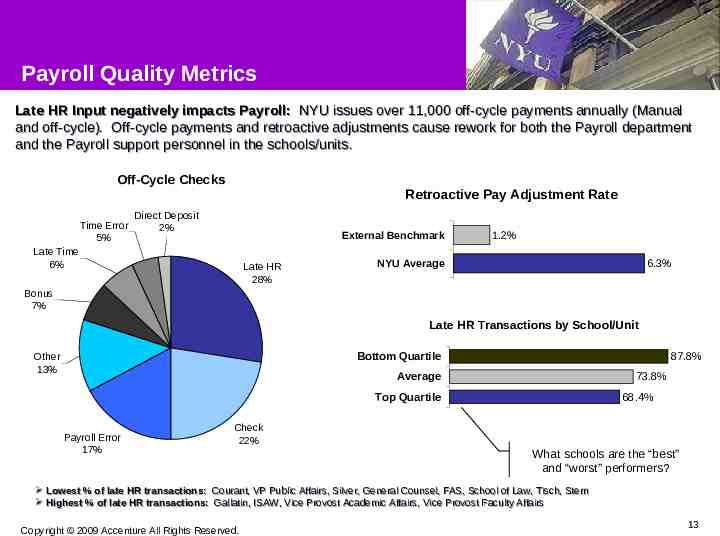
Payroll Quality Metrics Late HR Input negatively impacts Payroll: NYU issues over 11,000 off-cycle payments annually (Manual and off-cycle). Off-cycle payments and retroactive adjustments cause rework for both the Payroll department and the Payroll support personnel in the schools/units. Off-Cycle Checks Time Error 5% Retroactive Pay Adjustment Rate Direct Deposit 2% External Benchmark Late Time 6% Late HR 28% 1.2% NYU Average 6.3% Bonus 7% Late HR Transactions by School/Unit Bottom Quartile Other 13% 87.8% Average 73.8% Top Quartile Payroll Error 17% 68.4% Check 22% What schools are the “best” and “worst” performers? Lowest % of late HR transactions: Courant, VP Public Public Affairs, Affairs, Silver, Silver, General General Counsel, FAS, School of Law, Tisch, Stern Highest % of late HR transactions: Gallatin, Gallatin, ISAW, ISAW, Vice Vice Provost Provost Academic Academic Affairs, Affairs, Vice Vice Provost Provost Faculty Faculty Affairs Affairs Copyright 2009 Accenture All Rights Reserved. 13
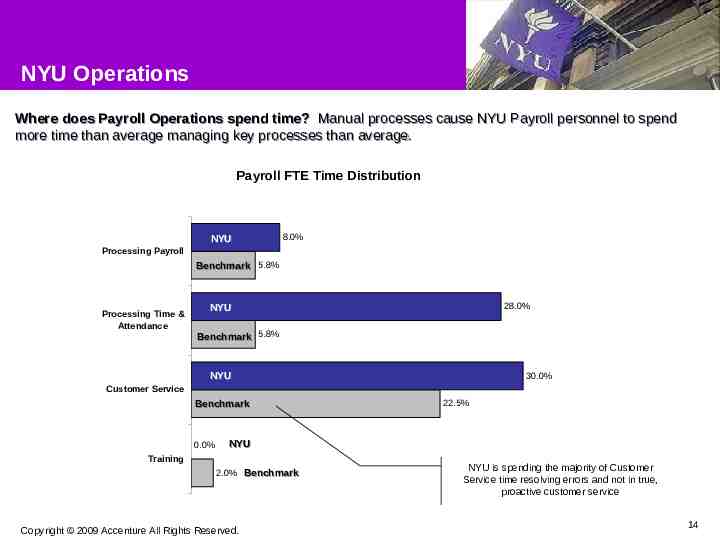
NYU Operations Where does Payroll Operations spend time? Manual processes cause NYU Payroll personnel to spend more time than average managing key processes than average. Payroll FTE Time Distribution NYU 8.0% Processing Payroll Benchmark Benchmark 5.8% Processing Time & Attendance 28.0% NYU NYU Benchmark 5.8% NYU NYU 30.0% Customer Service Benchmark 0.0% 22.5% NYU Training 2.0% Benchmark Copyright 2009 Accenture All Rights Reserved. NYU is spending the majority of Customer Service time resolving errors and not in true, proactive customer service 14
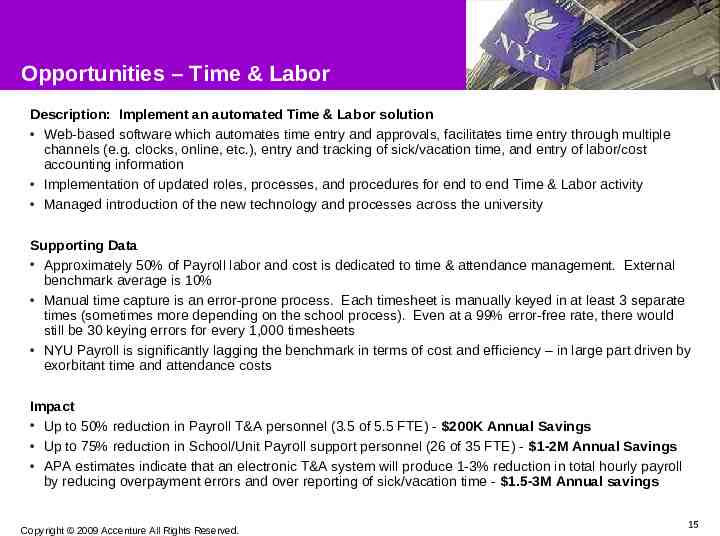
Opportunities – Time & Labor Description: Implement an automated Time & Labor solution Web-based software which automates time entry and approvals, facilitates time entry through multiple channels (e.g. clocks, online, etc.), entry and tracking of sick/vacation time, and entry of labor/cost accounting information Implementation of updated roles, processes, and procedures for end to end Time & Labor activity Managed introduction of the new technology and processes across the university Supporting Data Approximately 50% of Payroll labor and cost is dedicated to time & attendance management. External benchmark average is 10% Manual time capture is an error-prone process. Each timesheet is manually keyed in at least 3 separate times (sometimes more depending on the school process). Even at a 99% error-free rate, there would still be 30 keying errors for every 1,000 timesheets NYU Payroll is significantly lagging the benchmark in terms of cost and efficiency – in large part driven by exorbitant time and attendance costs Impact Up to 50% reduction in Payroll T&A personnel (3.5 of 5.5 FTE) - 200K Annual Savings Up to 75% reduction in School/Unit Payroll support personnel (26 of 35 FTE) - 1-2M Annual Savings APA estimates indicate that an electronic T&A system will produce 1-3% reduction in total hourly payroll by reducing overpayment errors and over reporting of sick/vacation time - 1.5-3M Annual savings Copyright 2009 Accenture All Rights Reserved. 15
Opportunities – Payroll Service Center and Payroll Optimization Description: Redesign the work within the central Payroll operation Move Payroll towards a true Service Center model with a call center capability, automated tracking of calls and cases, and better integration with related Benefits and HR activities Redesign the Payroll Calendar with the objective of reducing the number of different pay frequencies and reducing the total number of pay runs within a month Move to eliminate the current process of hand delivery of checks Implement a payment/chargeback mechanism for exception processing such as off cycle checks and garnishments Implement operational metrics reporting to improve operational efficiency Supporting Data A significant portion of the school’s Payroll/T&A FTE is spent on customer service tasks such as fielding questions on leave balances, payroll deductions and missing time Payroll support personnel at the school level do not have direct access to the systems of record and often cannot answer questions. These questions must be escalated to Payroll resulting in duplicate effort The current informal system of raising issues has no tracking or reporting system and, according to our interviews, issues are often lost and must be raised multiple times Impact Relieving HR/Payroll/T&A personnel at the school level from Payroll customer service responsibilities is essential for realizing the 1.2M Annual savings from field support FTE noted previously Employee satisfaction will increase when they are able to quickly and easily find answers to their questions. The first person they speak to (Payroll Service Center representative) will have the knowledge and systems access to address their questions Shift customer service inquiries to capable, but newer Payroll employees. Current, informal system places the heaviest burden for customer service on the most experienced (and most expensive) caseworkers in Payroll who are the known contacts in the field. Copyright 2009 Accenture All Rights Reserved. 16
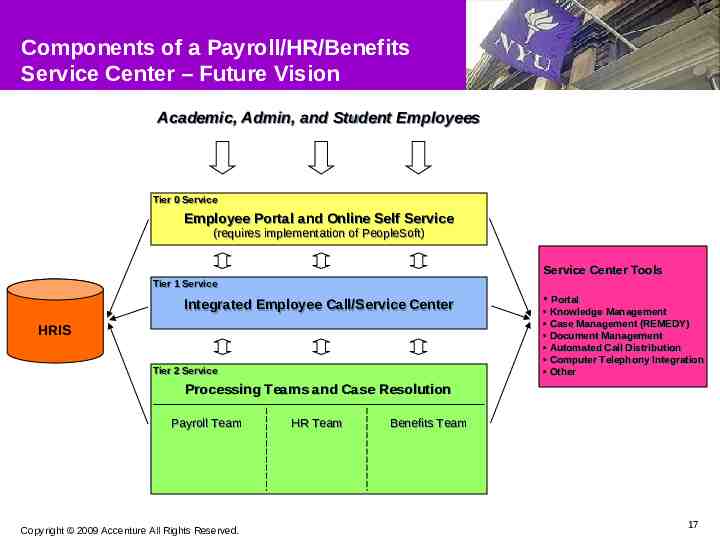
Components of a Payroll/HR/Benefits Service Center – Future Vision Academic, Admin, and Student Employees Tier Tier 00 Service Service Employee Portal and Online Self Service (requires implementation of PeopleSoft) Service Center Tools Tier Tier 11 Service Service Integrated Employee Call/Service Center HRIS Tier Tier 22 Service Service Portal Knowledge Management Case Management (REMEDY) Document Management Automated Call Distribution Computer Telephony Integration Other Processing Teams and Case Resolution Payroll Team Copyright 2009 Accenture All Rights Reserved. HR Team Benefits Team 17
Opportunities – HR Reengineering Description: Reengineer HR transaction processes with the Schools and Units Improve end user access to information – both employee data and process/procedure documentation Look to more broadly distribute PASS within the Schools, down to the department level Look to reduce the number of approvals on a transaction Implement better controls/audits on Academic and Student onboarding, to reduce missed payrolls Supporting Data Average percentage of late HR actions (PASS) is 74% Currently, only one of the schools interviewed has PASS distributed down to the department level, but they are in the top quartile (internal benchmark) of timely PASS submissions and they perform their duties with less personnel than average (1:134 ratio vs 1:88) Impact Reduce percentage of late HR actions from 74% to 25% Reduce off-cycle paychecks by approximately 50-70% for an estimated annual savings of 100-200K Reduce Payroll FTE by 1 for an estimated annual savings of 50K Copyright 2009 Accenture All Rights Reserved. 18
Opportunities – Payroll Outsourcing Description: Outsource the data processing components of payroll to a third party Shift responsibility for the data processing of some, or all, of the following components to a third party processor: – Gross to Net payroll calculation – Garnishment processing – Off cycle check processing – Check printing and distribution – Tax reporting and processing and W2 processing The two different service models for Payroll Outsourcing are outlined on the next page Supporting Data: Outsourcing of payroll – in the “data processing model” (see next page) would result in an 18% reduction in the annual run cost Outsourcing of payroll – in the “managed service model” (see next page) would result in a 16% increase in the annual run cost – given the significantly higher third party service cost associated with the “managed service model” Impact Reduction of the quantity of exceptions, as envisioned in the to-be environment, would be essential in managing the ongoing run cost of payroll outsourcing Portions of Employee Benefits are outsourced to Towers Perrin – requiring some coordination of data flows and other aspects of service Copyright 2009 Accenture All Rights Reserved. 19
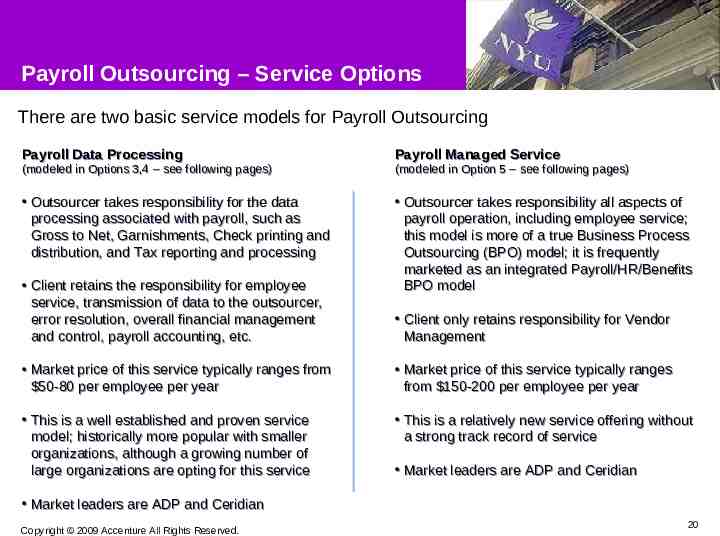
Payroll Outsourcing – Service Options There are two basic service models for Payroll Outsourcing Payroll Data Processing Payroll Managed Service Outsourcer takes responsibility for the data processing associated with payroll, such as Gross to Net, Garnishments, Check printing and distribution, and Tax reporting and processing Outsourcer takes responsibility all aspects of payroll operation, including employee service; this model is more of a true Business Process Outsourcing (BPO) model; it is frequently marketed as an integrated Payroll/HR/Benefits BPO model (modeled in Options 3,4 – see following pages) Client retains the responsibility for employee service, transmission of data to the outsourcer, error resolution, overall financial management and control, payroll accounting, etc. (modeled in Option 5 – see following pages) Client only retains responsibility for Vendor Management Market price of this service typically ranges from 50-80 per employee per year Market price of this service typically ranges from 150-200 per employee per year This is a well established and proven service model; historically more popular with smaller organizations, although a growing number of large organizations are opting for this service This is a relatively new service offering without a strong track record of service Market leaders are ADP and Ceridian Market leaders are ADP and Ceridian Copyright 2009 Accenture All Rights Reserved. 20
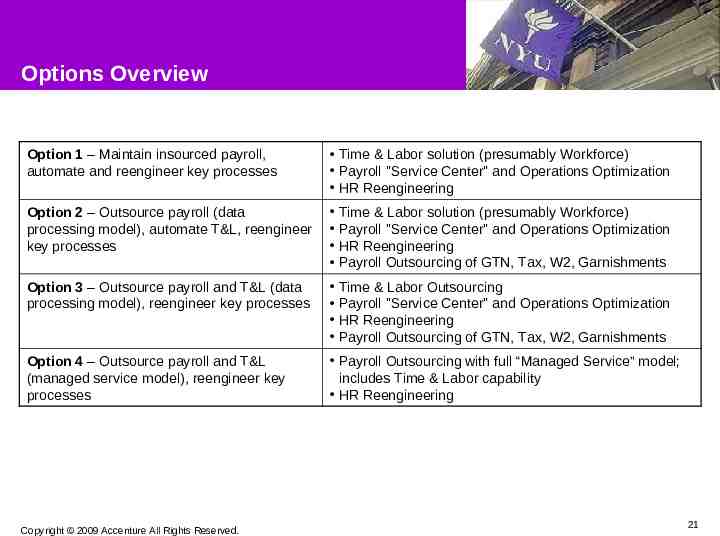
Options Overview Option 1 – Maintain insourced payroll, automate and reengineer key processes Time & Labor solution (presumably Workforce) Payroll "Service Center" and Operations Optimization HR Reengineering Option 2 – Outsource payroll (data processing model), automate T&L, reengineer key processes Time & Labor solution (presumably Workforce) Payroll "Service Center" and Operations Optimization HR Reengineering Payroll Outsourcing of GTN, Tax, W2, Garnishments Option 3 – Outsource payroll and T&L (data processing model), reengineer key processes Time & Labor Outsourcing Payroll "Service Center" and Operations Optimization HR Reengineering Payroll Outsourcing of GTN, Tax, W2, Garnishments Option 4 – Outsource payroll and T&L (managed service model), reengineer key processes Payroll Outsourcing with full “Managed Service” model; includes Time & Labor capability HR Reengineering Copyright 2009 Accenture All Rights Reserved. 21
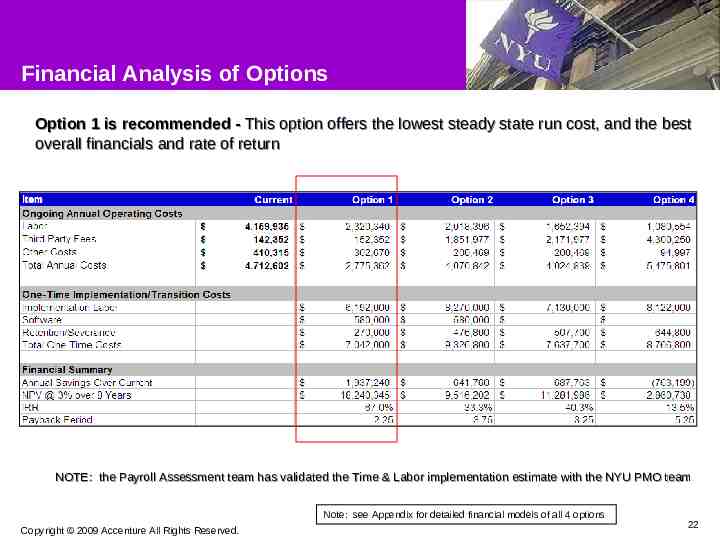
Financial Analysis of Options Option 1 is recommended - This option offers the lowest steady state run cost, and the best overall financials and rate of return NOTE: the Payroll Assessment team has validated the Time & Labor implementation estimate with the NYU PMO team Note: see Appendix for detailed financial models of all 4 options Copyright 2009 Accenture All Rights Reserved. 22
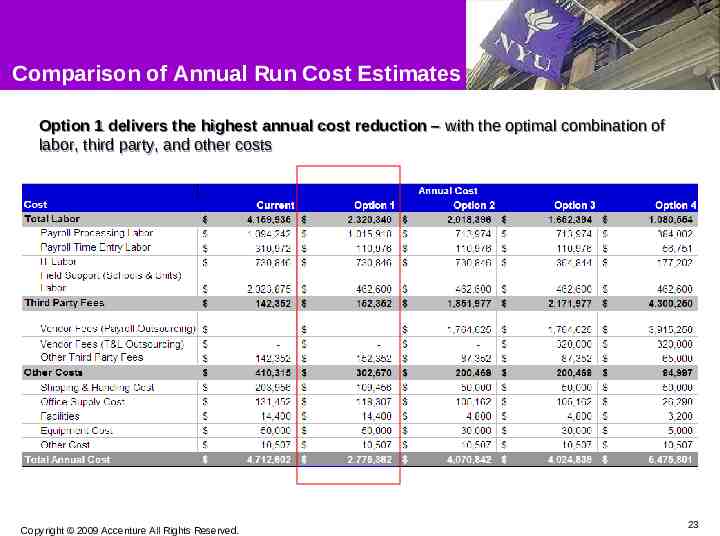
Comparison of Annual Run Cost Estimates Option 1 delivers the highest annual cost reduction – with the optimal combination of labor, third party, and other costs Copyright 2009 Accenture All Rights Reserved. 23
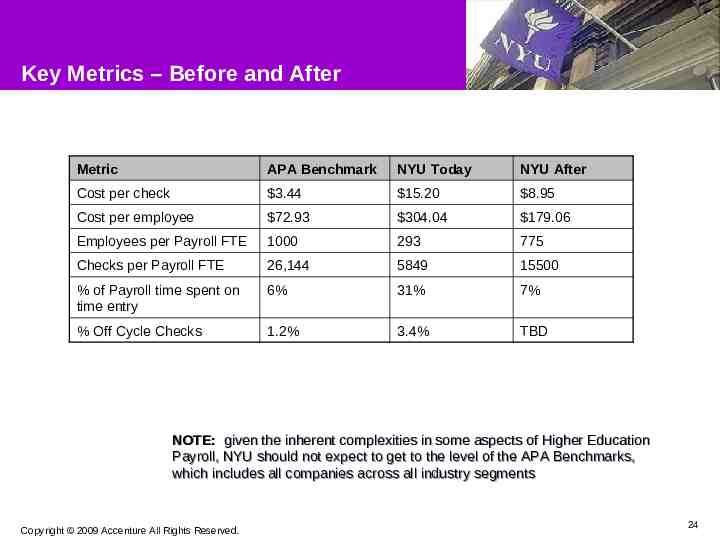
Key Metrics – Before and After Metric APA Benchmark NYU Today NYU After Cost per check 3.44 15.20 8.95 Cost per employee 72.93 304.04 179.06 Employees per Payroll FTE 1000 293 775 Checks per Payroll FTE 26,144 5849 15500 % of Payroll time spent on time entry 6% 31% 7% % Off Cycle Checks 1.2% 3.4% TBD NOTE: given the inherent complexities in some aspects of Higher Education Payroll, NYU should not expect to get to the level of the APA Benchmarks, which includes all companies across all industry segments Copyright 2009 Accenture All Rights Reserved. 24
Guiding Principles for Implementation Roadmap and Projects The goal of the Implementation Roadmap is to strike the proper balance among multiple factors: – Funding and ROI – Resource availability – Pace of change – Timing of benefits realization – Fit with annual University calendar – Fit with other large University initiatives Each of the projects has been envisioned, with a high level estimate of effort and duration, with a holistic view of the end-to-end process – considering business process, roles, change management, etc. in addition to software installation Projects have been estimated using three resource types: – NYU User: functional expert in payroll and payroll-related processes – NYU IT: technical expert in payroll-related systems – Contractor: external expert in software, relevant processes, and large scale project/program management Copyright 2009 Accenture All Rights Reserved. 25
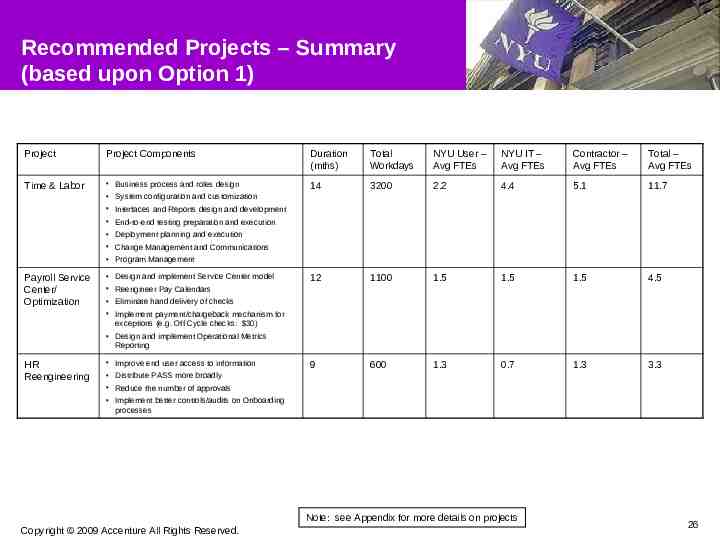
Recommended Projects – Summary (based upon Option 1) Project Project Components Duration (mths) Total Workdays NYU User – Avg FTEs NYU IT – Avg FTEs Contractor – Avg FTEs Total – Avg FTEs Time & Labor Business process and roles design 14 3200 2.2 4.4 5.1 11.7 12 1100 1.5 1.5 1.5 4.5 9 600 1.3 0.7 1.3 3.3 System configuration and customization Interfaces and Reports design and development End-to-end testing preparation and execution Deployment planning and execution Change Management and Communications Program Management Payroll Service Center/ Optimization Design and implement Service Center model Reengineer Pay Calendars Eliminate hand delivery of checks Implement payment/chargeback mechanism for exceptions (e.g. Off Cycle checks: 30) Design and implement Operational Metrics Reporting HR Reengineering Improve end user access to information Distribute PASS more broadly Reduce the number of approvals Implement better controls/audits on Onboarding processes Note: see Appendix for more details on projects Copyright 2009 Accenture All Rights Reserved. 26
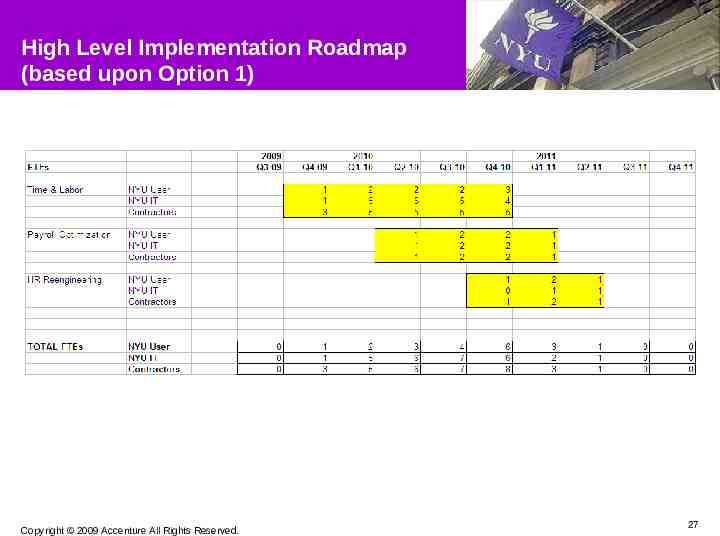
High Level Implementation Roadmap (based upon Option 1) Copyright 2009 Accenture All Rights Reserved. 27
Next Steps Confirm recommendations and going-forward Roadmap with key stakeholders Proceed with procurement of Workforce Time & Labor solution Begin to plan for startup of projects, for Fall 2009 Copyright 2009 Accenture All Rights Reserved. 28
Appendix Project Approach Inventory of Interviews Detailed Financial Analysis of Options Project Descriptions Copyright 2009 Accenture All Rights Reserved. 29
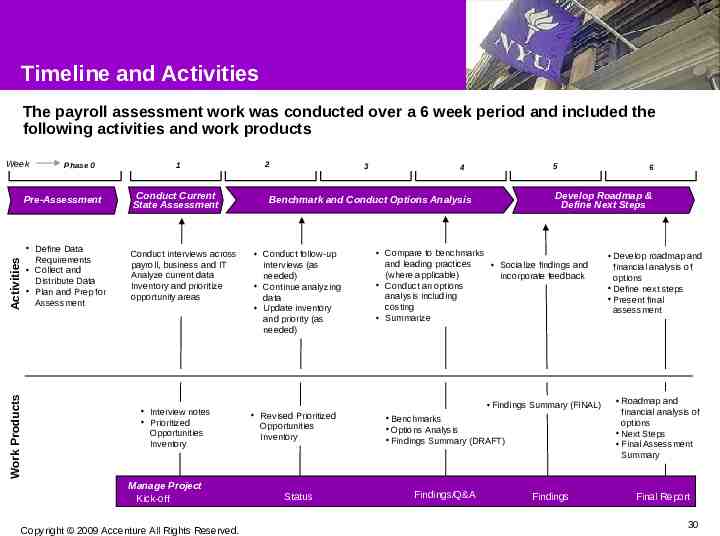
Timeline and Activities The payroll assessment work was conducted over a 6 week period and included the following activities and work products Week Phase 0 Pre-Assessment Work Products Activities Define Data Requirements Collect and Distribute Data Plan and Prep for Assessment 1 Conduct Current State Assessment Conduct interviews across payroll, business and IT Analyze current data Inventory and prioritize opportunity areas Interview notes Prioritized Opportunities Inventory Manage Project Kick-off Copyright 2009 Accenture All Rights Reserved. 2 3 5 4 Develop Roadmap & Define Next Steps Benchmark and Conduct Options Analysis Conduct follow-up interviews (as needed) Continue analyzing data Update inventory and priority (as needed) Revised Prioritized Opportunities Inventory Status Compare to benchmarks and leading practices Socialize findings and (where applicable) incorporate feedback Conduct an options analysis including costing Summarize Findings Summary (FINAL) Benchmarks Options Analysis Findings Summary (DRAFT) Findings/Q&A 6 Findings Develop roadmap and financial analysis of options Define next steps Present final assessment Roadmap and financial analysis of options Next Steps Final Assessment Summary Final Report 30
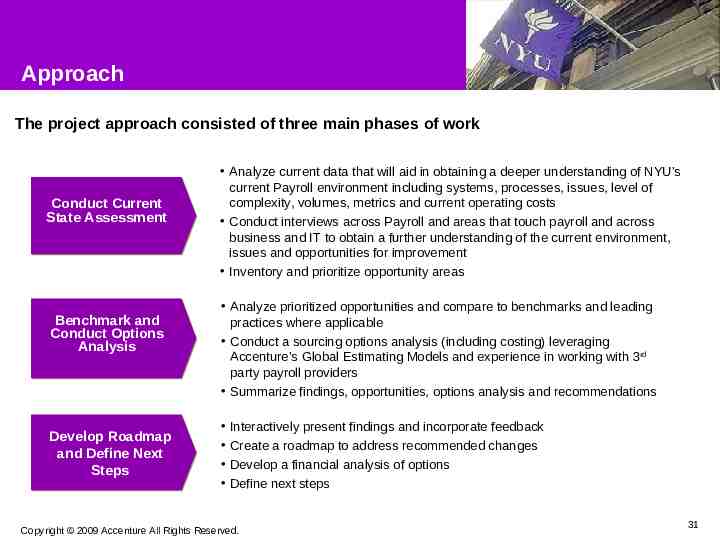
Approach The project approach consisted of three main phases of work Conduct Current State Assessment Benchmark and Conduct Options Analysis Develop Roadmap and Define Next Steps Analyze current data that will aid in obtaining a deeper understanding of NYU’s current Payroll environment including systems, processes, issues, level of complexity, volumes, metrics and current operating costs Conduct interviews across Payroll and areas that touch payroll and across business and IT to obtain a further understanding of the current environment, issues and opportunities for improvement Inventory and prioritize opportunity areas Analyze prioritized opportunities and compare to benchmarks and leading practices where applicable Conduct a sourcing options analysis (including costing) leveraging Accenture’s Global Estimating Models and experience in working with 3rd party payroll providers Summarize findings, opportunities, options analysis and recommendations Interactively present findings and incorporate feedback Create a roadmap to address recommended changes Develop a financial analysis of options Define next steps Copyright 2009 Accenture All Rights Reserved. 31
Inventory of Interviews Copyright 2009 Accenture All Rights Reserved. 32
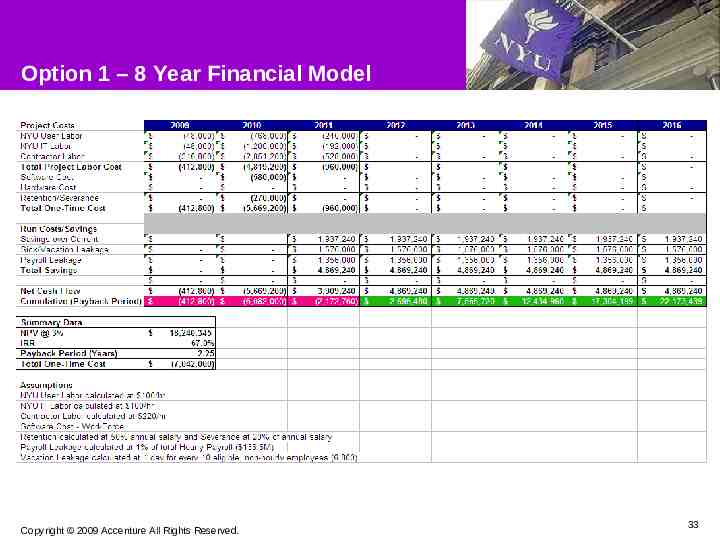
Option 1 – 8 Year Financial Model Copyright 2009 Accenture All Rights Reserved. 33
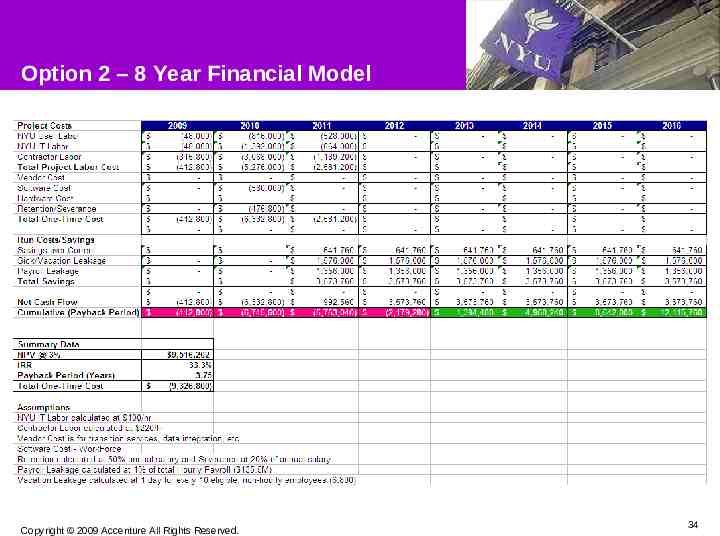
Option 2 – 8 Year Financial Model Copyright 2009 Accenture All Rights Reserved. 34
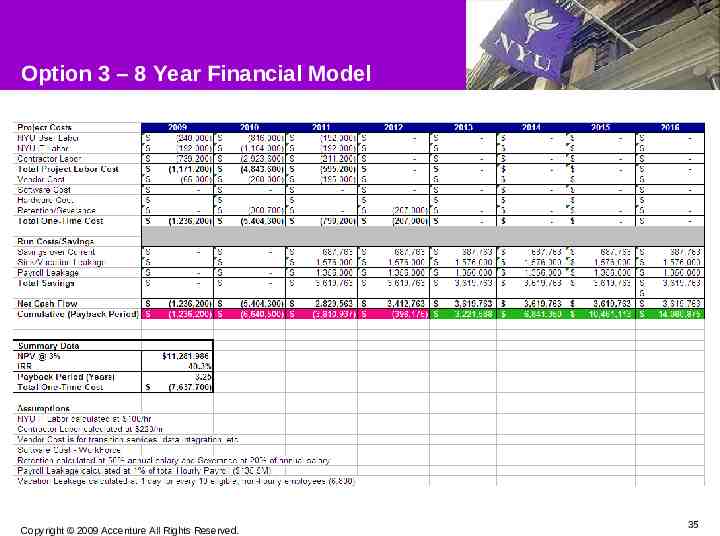
Option 3 – 8 Year Financial Model Copyright 2009 Accenture All Rights Reserved. 35
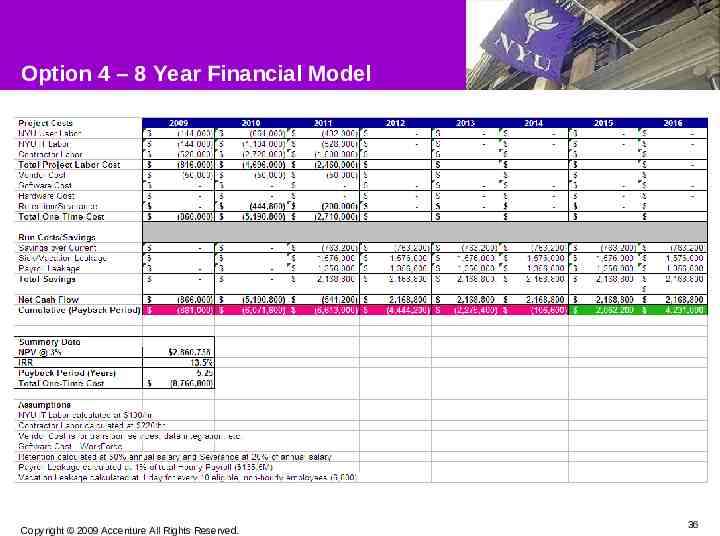
Option 4 – 8 Year Financial Model Copyright 2009 Accenture All Rights Reserved. 36
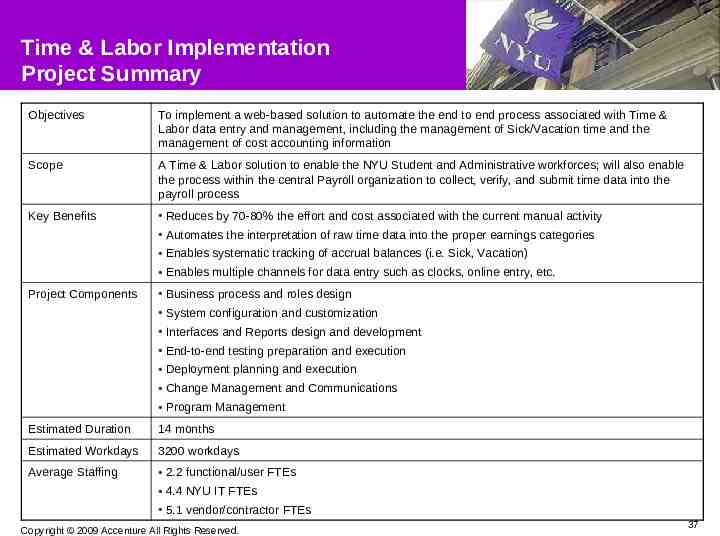
Time & Labor Implementation Project Summary Objectives To implement a web-based solution to automate the end to end process associated with Time & Labor data entry and management, including the management of Sick/Vacation time and the management of cost accounting information Scope A Time & Labor solution to enable the NYU Student and Administrative workforces; will also enable the process within the central Payroll organization to collect, verify, and submit time data into the payroll process Key Benefits Reduces by 70-80% the effort and cost associated with the current manual activity Automates the interpretation of raw time data into the proper earnings categories Enables systematic tracking of accrual balances (i.e. Sick, Vacation) Enables multiple channels for data entry such as clocks, online entry, etc. Project Components Business process and roles design System configuration and customization Interfaces and Reports design and development End-to-end testing preparation and execution Deployment planning and execution Change Management and Communications Program Management Estimated Duration 14 months Estimated Workdays 3200 workdays Average Staffing 2.2 functional/user FTEs 4.4 NYU IT FTEs 5.1 vendor/contractor FTEs Copyright 2009 Accenture All Rights Reserved. 37
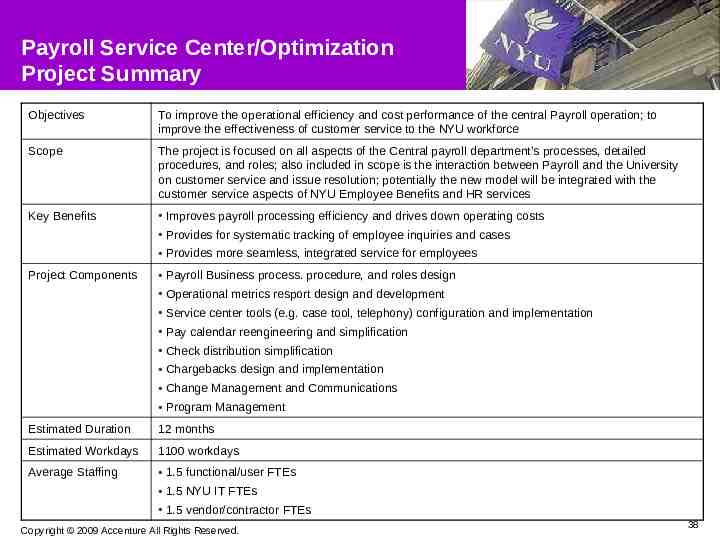
Payroll Service Center/Optimization Project Summary Objectives To improve the operational efficiency and cost performance of the central Payroll operation; to improve the effectiveness of customer service to the NYU workforce Scope The project is focused on all aspects of the Central payroll department’s processes, detailed procedures, and roles; also included in scope is the interaction between Payroll and the University on customer service and issue resolution; potentially the new model will be integrated with the customer service aspects of NYU Employee Benefits and HR services Key Benefits Improves payroll processing efficiency and drives down operating costs Provides for systematic tracking of employee inquiries and cases Provides more seamless, integrated service for employees Project Components Payroll Business process. procedure, and roles design Operational metrics resport design and development Service center tools (e.g. case tool, telephony) configuration and implementation Pay calendar reengineering and simplification Check distribution simplification Chargebacks design and implementation Change Management and Communications Program Management Estimated Duration 12 months Estimated Workdays 1100 workdays Average Staffing 1.5 functional/user FTEs 1.5 NYU IT FTEs 1.5 vendor/contractor FTEs Copyright 2009 Accenture All Rights Reserved. 38
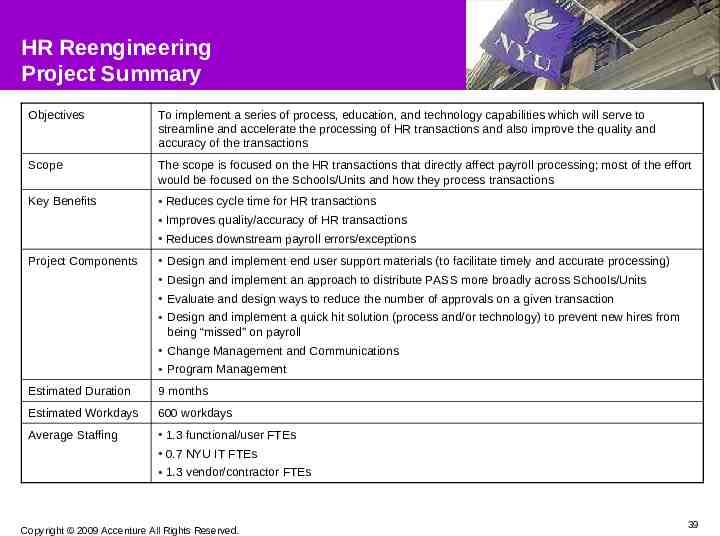
HR Reengineering Project Summary Objectives To implement a series of process, education, and technology capabilities which will serve to streamline and accelerate the processing of HR transactions and also improve the quality and accuracy of the transactions Scope The scope is focused on the HR transactions that directly affect payroll processing; most of the effort would be focused on the Schools/Units and how they process transactions Key Benefits Reduces cycle time for HR transactions Improves quality/accuracy of HR transactions Reduces downstream payroll errors/exceptions Project Components Design and implement end user support materials (to facilitate timely and accurate processing) Design and implement an approach to distribute PASS more broadly across Schools/Units Evaluate and design ways to reduce the number of approvals on a given transaction Design and implement a quick hit solution (process and/or technology) to prevent new hires from being “missed” on payroll Change Management and Communications Program Management Estimated Duration 9 months Estimated Workdays 600 workdays Average Staffing 1.3 functional/user FTEs 0.7 NYU IT FTEs 1.3 vendor/contractor FTEs Copyright 2009 Accenture All Rights Reserved. 39