Models and Algorithms for Complex Networks Networks and Measurements
42 Slides2.31 MB
Models and Algorithms for Complex Networks Networks and Measurements Lecture 3
Types of networks Social networks Knowledge (Information) networks Technology networks Biological networks
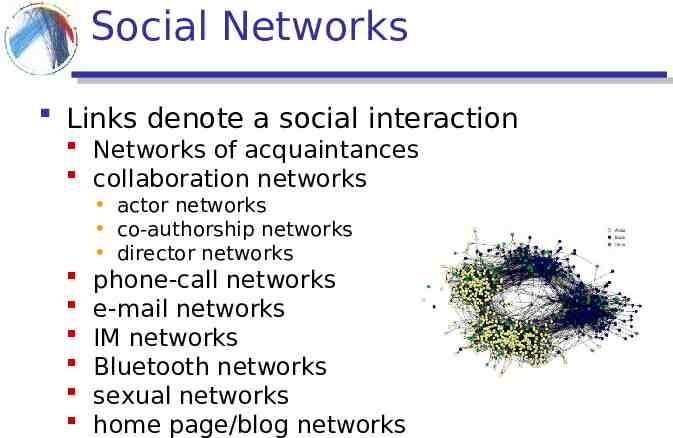
Social Networks Links denote a social interaction Networks of acquaintances collaboration networks actor networks co-authorship networks director networks phone-call networks e-mail networks IM networks Bluetooth networks sexual networks home page/blog networks
Knowledge (Information) Networks Nodes store information, links associate information Citation network (directed acyclic) The Web (directed) Peer-to-Peer networks Word networks Networks of Trust Software graphs
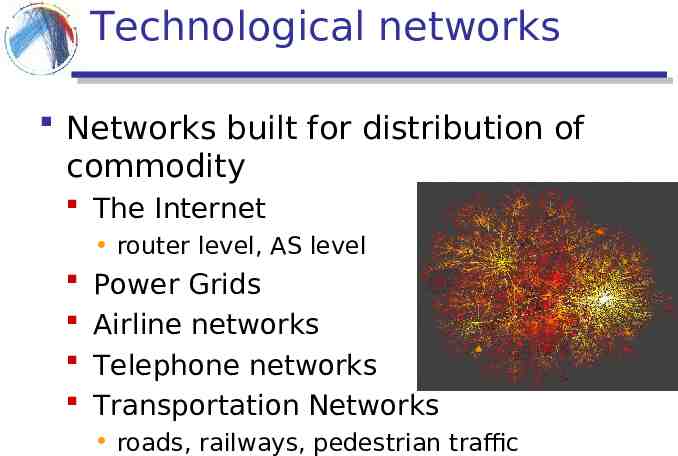
Technological networks Networks built for distribution of commodity The Internet router level, AS level Power Grids Airline networks Telephone networks Transportation Networks roads, railways, pedestrian traffic
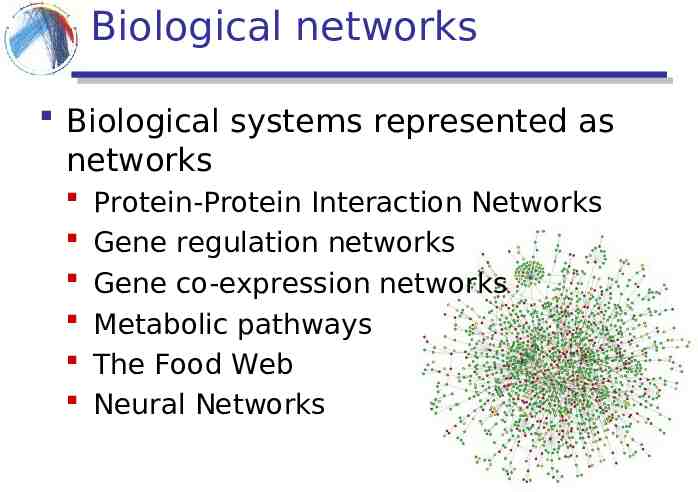
Biological networks Biological systems represented as networks Protein-Protein Interaction Networks Gene regulation networks Gene co-expression networks Metabolic pathways The Food Web Neural Networks
Measuring Networks Degree distributions Small world phenomena Clustering Coefficient Mixing patterns Degree correlations Communities and clusters
The basic random graph model The measurements on real networks are usually compared against those on “random networks” The basic Gn,p (Erdös-Renyi) random graph model: n : the number of vertices 0 p 1 for each pair (i,j), generate the edge (i,j) independently with probability p
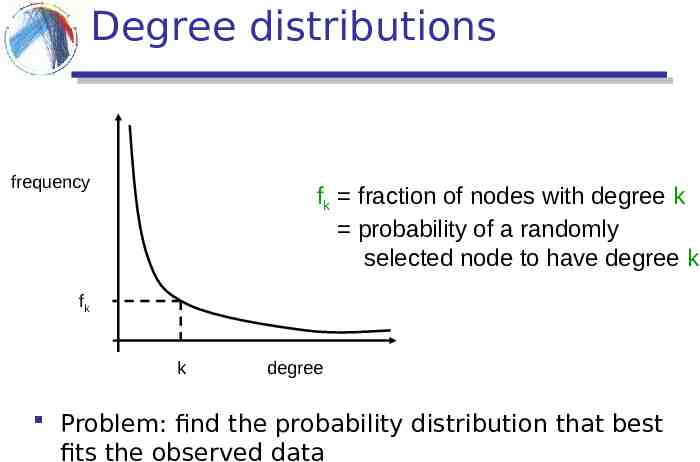
Degree distributions frequency fk fraction of nodes with degree k probability of a randomly selected node to have degree k fk k degree Problem: find the probability distribution that best fits the observed data
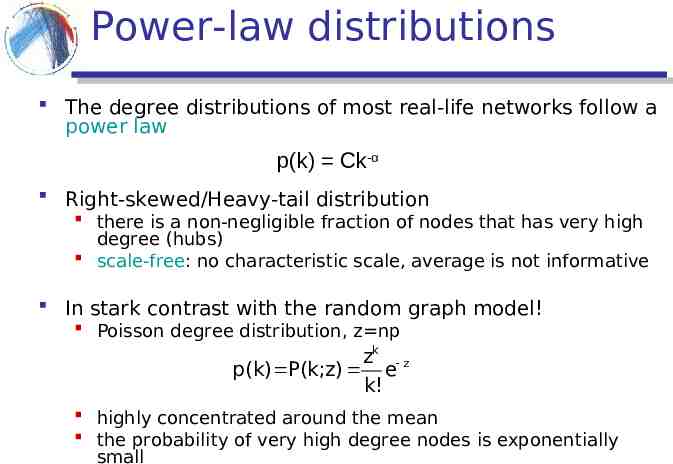
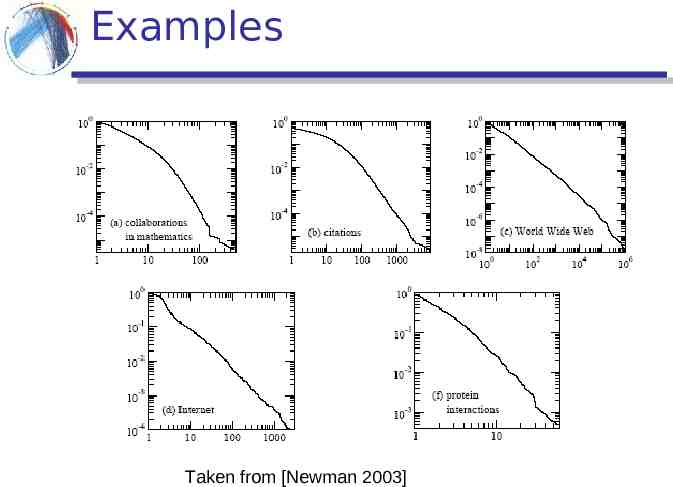
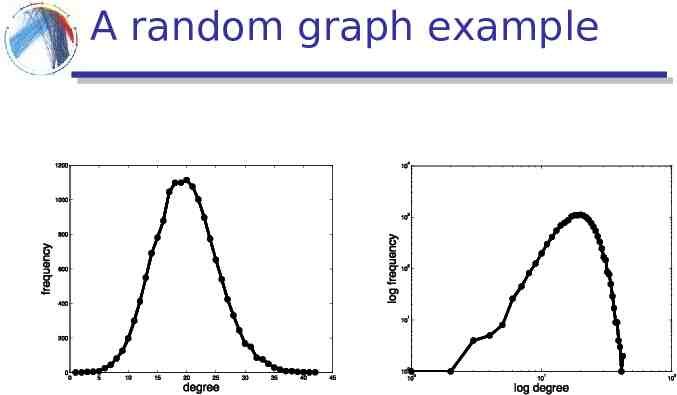
Power-law distributions The degree distributions of most real-life networks follow a power law p(k) Ck-α Right-skewed/Heavy-tail distribution there is a non-negligible fraction of nodes that has very high degree (hubs) scale-free: no characteristic scale, average is not informative In stark contrast with the random graph model! Poisson degree distribution, z np zk z p(k) P(k;z) e k! highly concentrated around the mean the probability of very high degree nodes is exponentially small
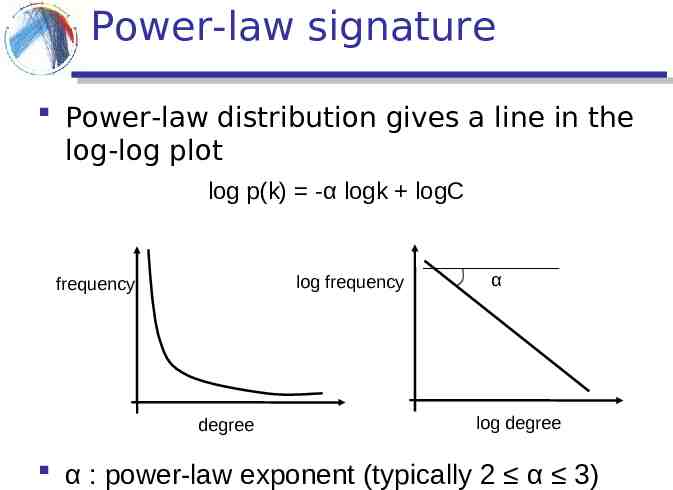
Power-law signature Power-law distribution gives a line in the log-log plot log p(k) -α logk logC log frequency frequency degree α log degree α : power-law exponent (typically 2 α 3)
Examples Taken from [Newman 2003]
A random graph example
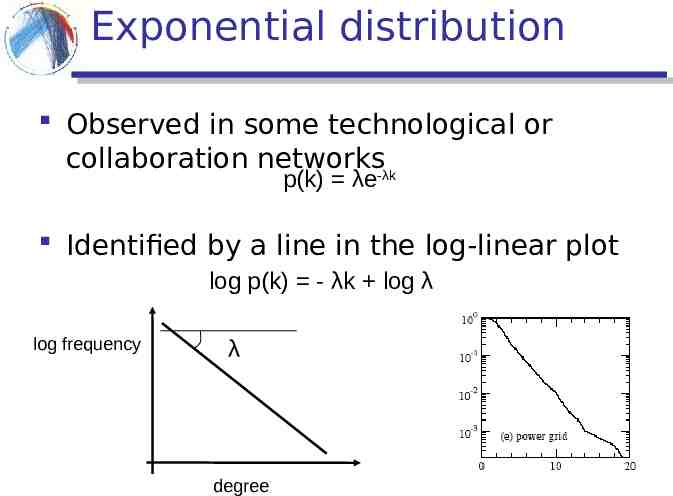
Exponential distribution Observed in some technological or collaboration networks-λk p(k) λe Identified by a line in the log-linear plot log p(k) - λk log λ log frequency λ degree
Average/Expected degree For random graphs z np For power-law distributed degree if α 2, it is a constant if α 2, it diverges
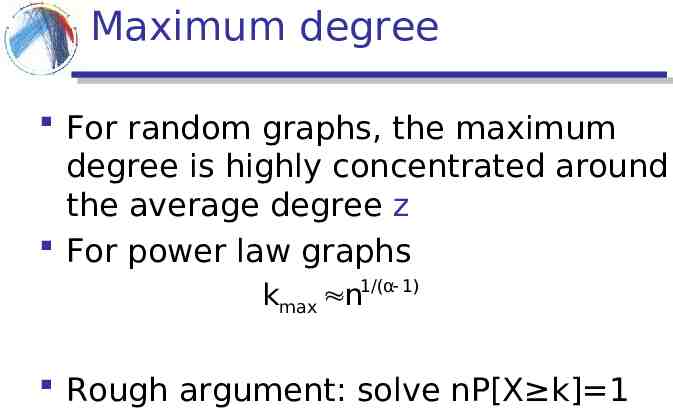
Maximum degree For random graphs, the maximum degree is highly concentrated around the average degree z For power law graphs 1/(α 1) kmax n Rough argument: solve nP[X k] 1
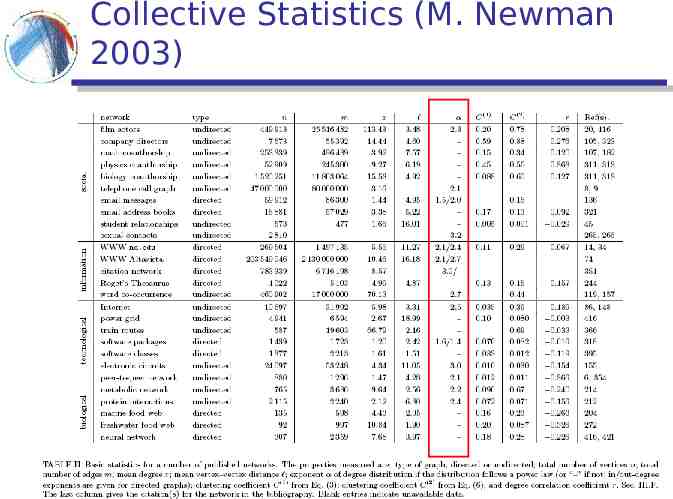
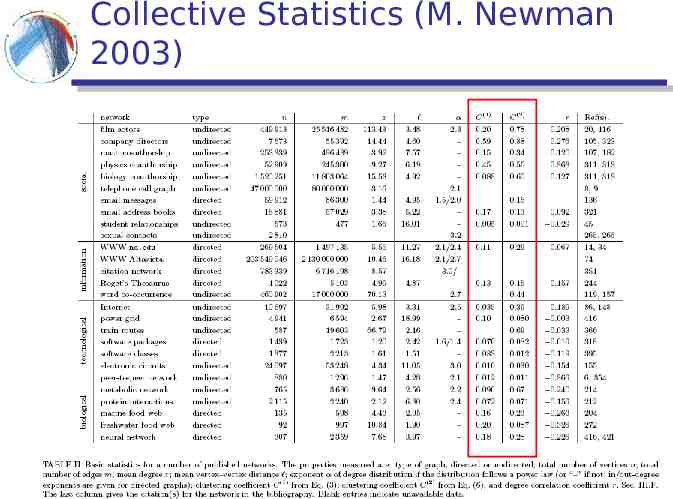
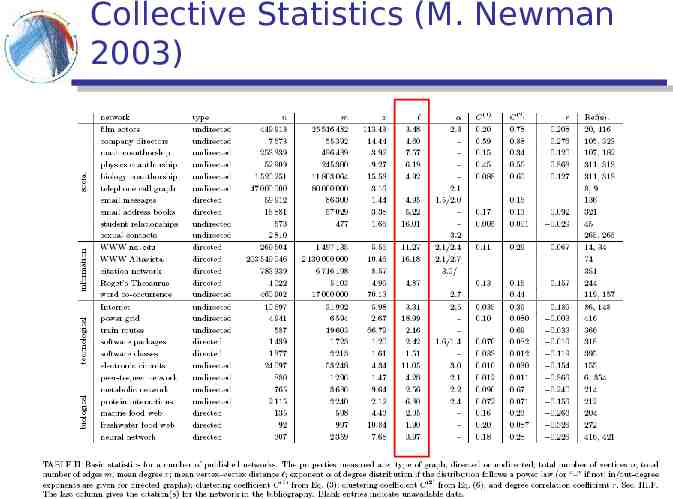
Collective Statistics (M. Newman 2003)
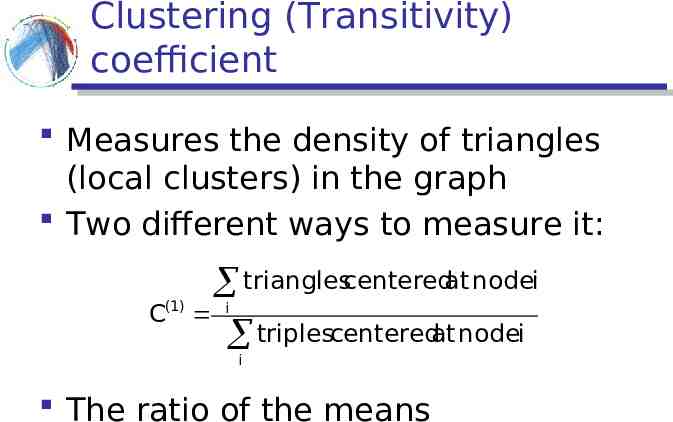
Clustering (Transitivity) coefficient Measures the density of triangles (local clusters) in the graph Two different ways to measure it: C(1) trianglescenteredat nodei triplescenteredat nodei i i The ratio of the means
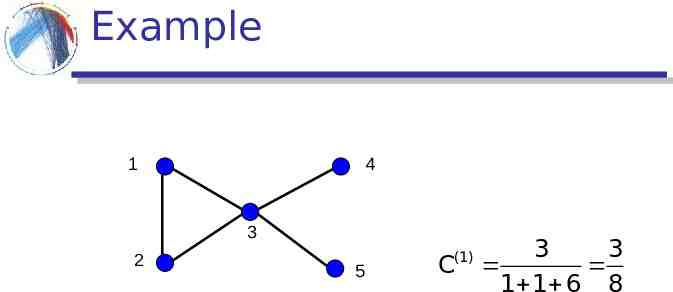
Example 1 4 3 2 5 3 3 C(1) 1 1 6 8
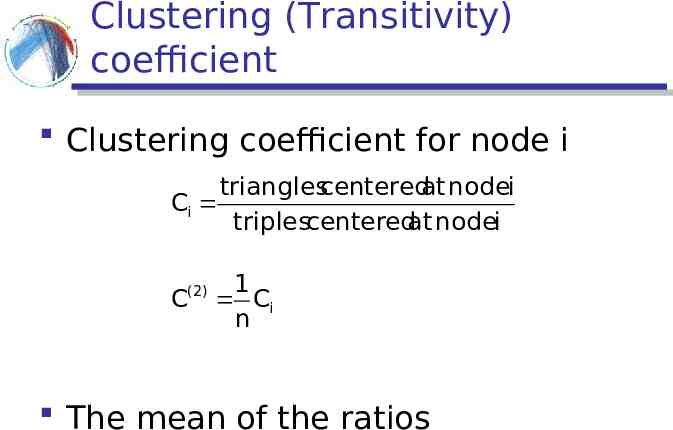
Clustering (Transitivity) coefficient Clustering coefficient for node i trianglescenteredat nodei Ci triplescenteredat nodei (2) C 1 Ci n The mean of the ratios
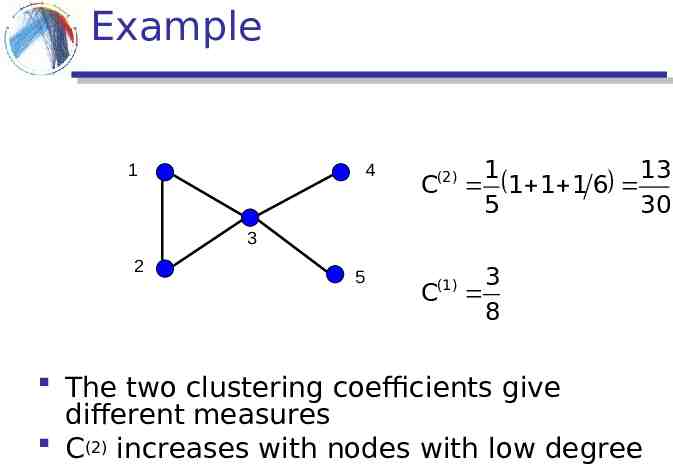
Example 1 4 (2) C 1 13 1 1 1 6 5 30 3 2 5 C(1) 3 8 The two clustering coefficients give different measures C(2) increases with nodes with low degree
Collective Statistics (M. Newman 2003)
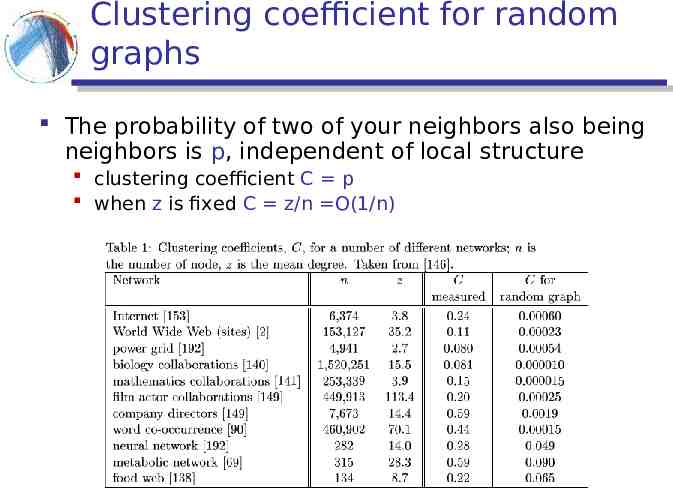
Clustering coefficient for random graphs The probability of two of your neighbors also being neighbors is p, independent of local structure clustering coefficient C p when z is fixed C z/n O(1/n)
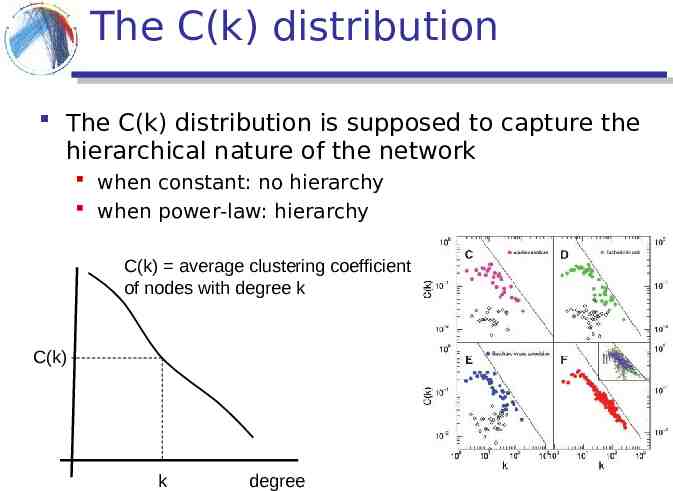
The C(k) distribution The C(k) distribution is supposed to capture the hierarchical nature of the network when constant: no hierarchy when power-law: hierarchy C(k) average clustering coefficient of nodes with degree k C(k) k degree
Millgram’s small world experiment Letters were handed out to people in Nebraska to be sent to a target in Boston People were instructed to pass on the letters to someone they knew on first-name basis The letters that reached the destination followed paths of length around 6 Six degrees of separation: (play of John Guare) Also: The Kevin Bacon game The Erdös number Small world project: http://smallworld.columbia.edu/index.html
Measuring the small world phenomenon dij shortest path between i and j Diameter: d maxdij i,j Characteristic path length: 1 dij n(n- 1)/2 i j Harmonic mean 1 1 -1 d n(n- 1)/2 i j ij Also, distribution of all shortest paths
Collective Statistics (M. Newman 2003)
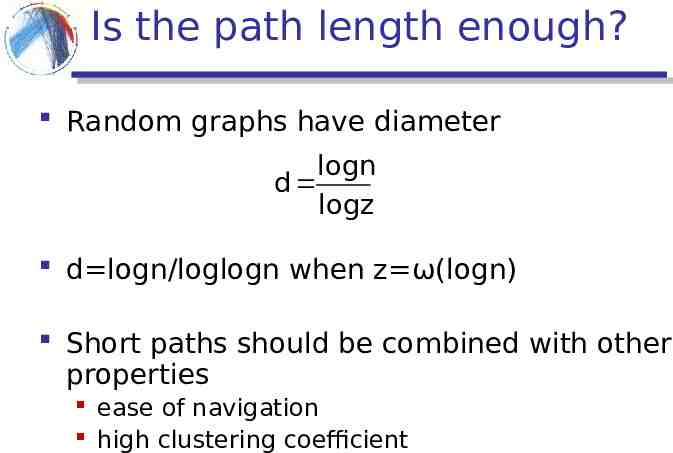
Is the path length enough? Random graphs have diameter logn d logz d logn/loglogn when z ω(logn) Short paths should be combined with other properties ease of navigation high clustering coefficient
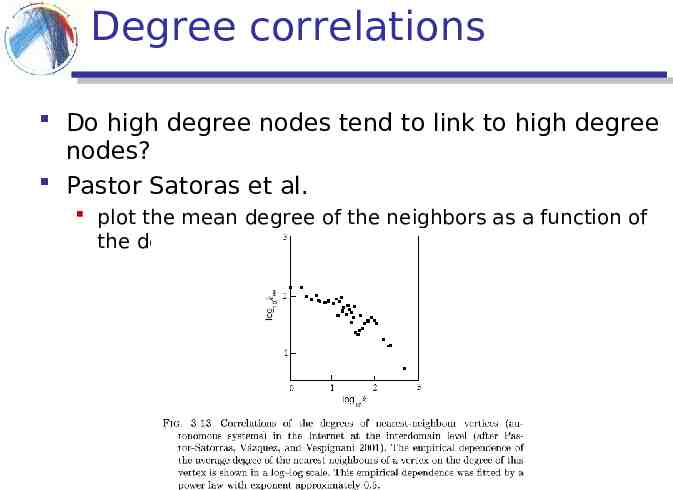
Degree correlations Do high degree nodes tend to link to high degree nodes? Pastor Satoras et al. plot the mean degree of the neighbors as a function of the degree
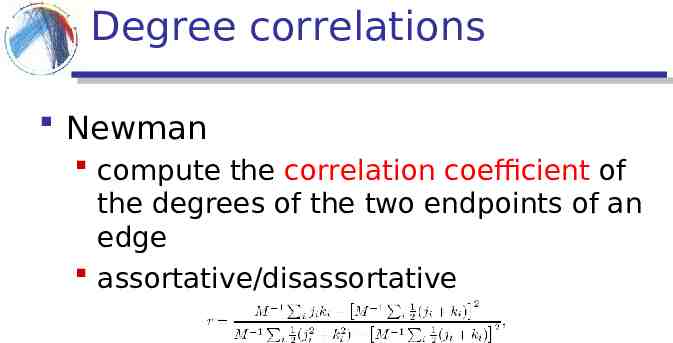
Degree correlations Newman compute the correlation coefficient of the degrees of the two endpoints of an edge assortative/disassortative
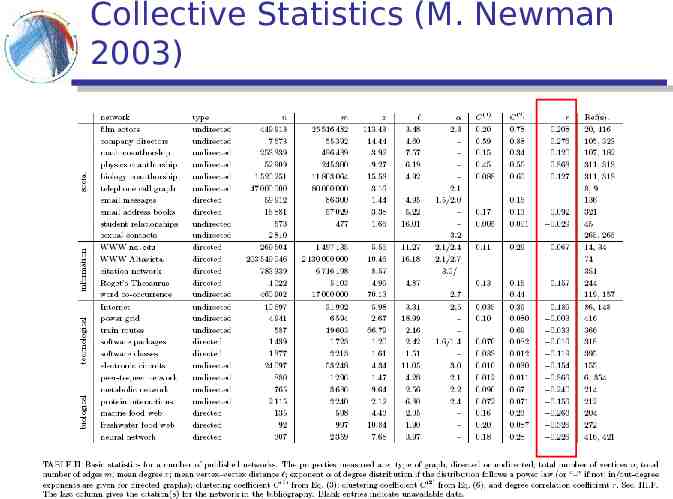
Collective Statistics (M. Newman 2003)
Connected components For undirected graphs, the size and distribution of the connected components is there a giant component? For directed graphs, the size and distribution of strongly and weakly connected components
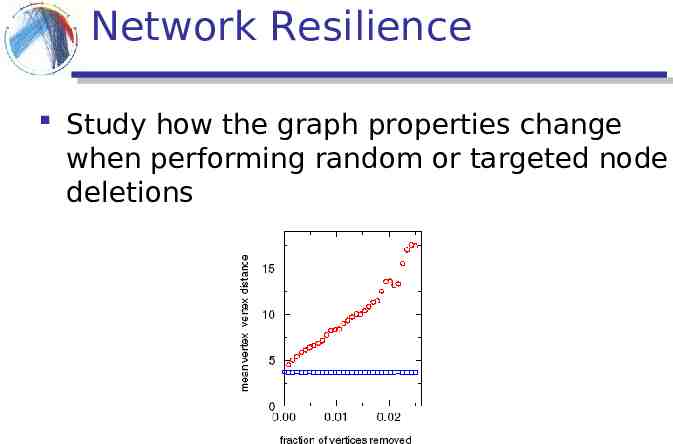
Network Resilience Study how the graph properties change when performing random or targeted node deletions
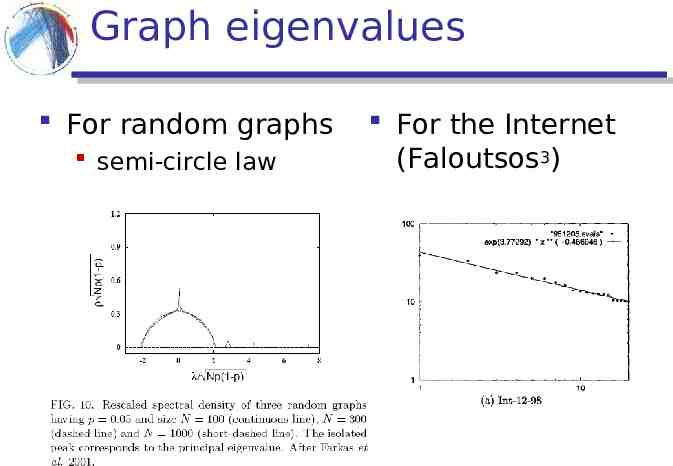
Graph eigenvalues For random graphs semi-circle law For the Internet (Faloutsos3)
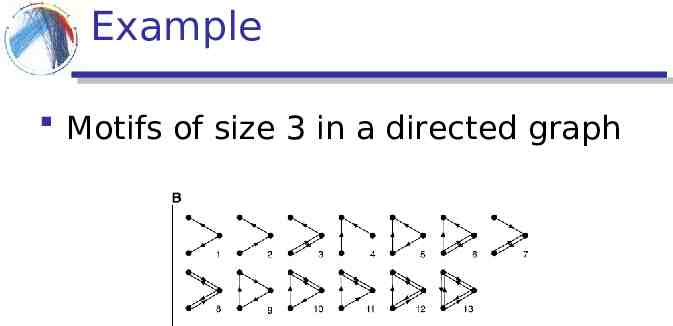
Motifs Most networks have the same characteristics with respect to global measurements can we say something about the local structure of the networks? Motifs: Find small subgraphs that over-represented in the network
Example Motifs of size 3 in a directed graph
Finding interesting motifs Sample a part of the graph of size S Count the frequency of the motifs of interest Compare against the frequency of the motif in a random graph with the same number of nodes and the same degree distribution
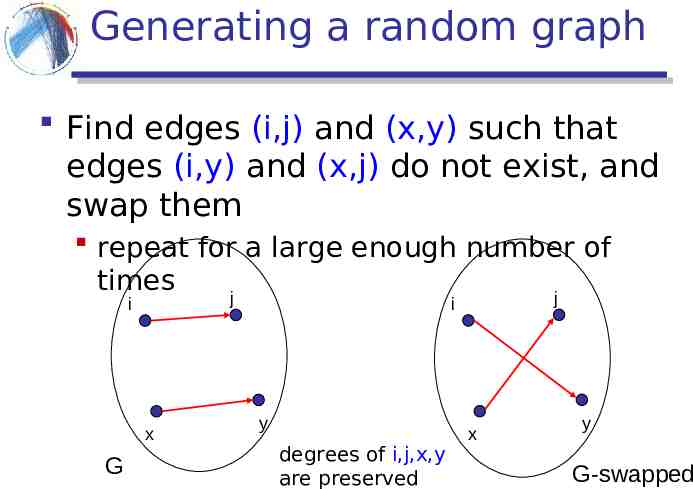
Generating a random graph Find edges (i,j) and (x,y) such that edges (i,y) and (x,j) do not exist, and swap them repeat for a large enough number of times j j i i x G y degrees of i,j,x,y are preserved x y G-swapped
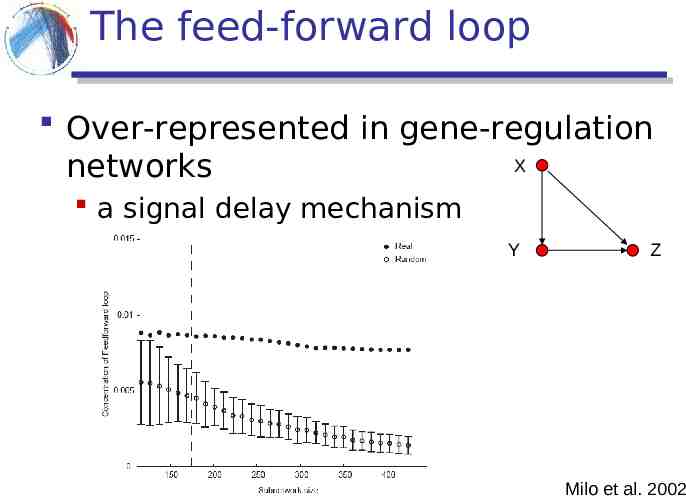
The feed-forward loop Over-represented in gene-regulation X networks a signal delay mechanism Y Z Milo et al. 2002
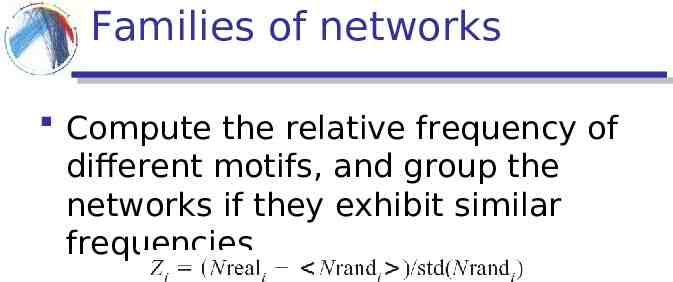
Families of networks Compute the relative frequency of different motifs, and group the networks if they exhibit similar frequencies
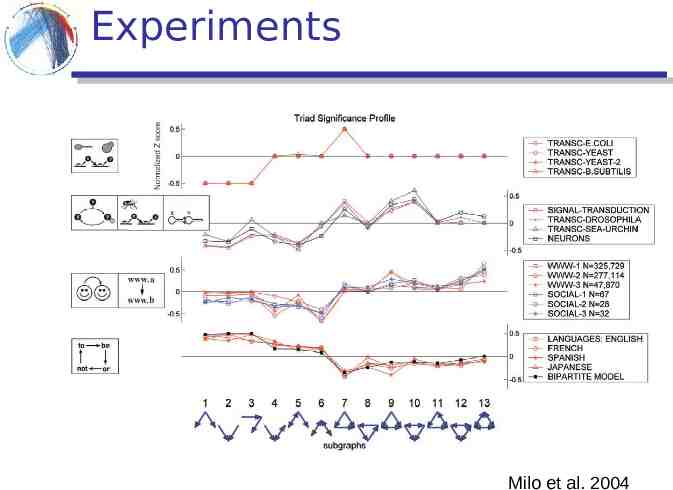
Experiments Milo et al. 2004
References M. E. J. Newman, The structure and function of complex networks, SIAM Reviews, 45(2): 167-256, 2003 R. Albert and A.-L. Barabási, Statistical mechanics of complex networks, Reviews of Modern Physics 74, 47-97 (2002). S. N. Dorogovstev and J. F. F. Mendez, Evolution of Networks: From Biological Nets to the Internet and WWW. Michalis Faloutsos, Petros Faloutsos and Christos Faloutsos. On Power-Law Relationships of the Internet Topology. ACM SIGCOMM 1999. E. Ravasz, A. L. Somera, D. A. Mongru, Z. N. Oltvai, and A.-L. Barabási, Hierarchical organization of modularity in metabolic networks, Science 297, 1551-1555 (2002). R Milo, S Shen-Orr, S Itzkovitz, N Kashtan, D Chklovskii & U Alon, Network Motifs: Simple Building Blocks of Complex Networks. Science, 298:824-827 (2002). R Milo, S Itzkovitz, N Kashtan, R Levitt, S Shen-Orr, I Ayzenshtat, M Sheffer & U Alon, Superfamilies of designed and evolved networks. Science, 303:1538-42 (2004).