Managing the Long Tail Ed Goetting – Director of Sales & Operations
9 Slides2.39 MB
Managing the Long Tail Ed Goetting – Director of Sales & Operations Planning Oct 2016 APICS / VIA Meeting
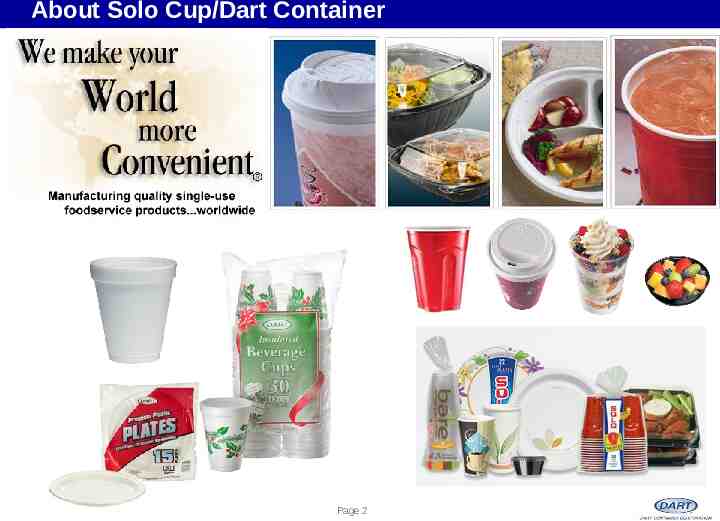
About Solo Cup/Dart Container Page 2
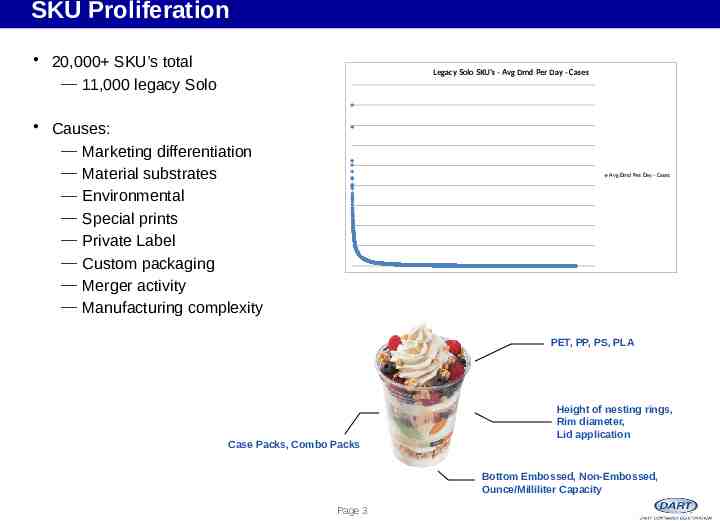
SKU Proliferation 20,000 SKU’s total ― 11,000 legacy Solo Legacy Solo SKU's - Avg Dmd Per Day - Cases Causes: ― Marketing differentiation ― Material substrates ― Environmental ― Special prints ― Private Label ― Custom packaging ― Merger activity ― Manufacturing complexity Avg Dmd Per Day - Cases PET, PP, PS, PLA Case Packs, Combo Packs Height of nesting rings, Rim diameter, Lid application Bottom Embossed, Non-Embossed, Ounce/Milliliter Capacity Page 3
Dealing with the Long Tail at Solo S&OP formally introduced at Solo in 2010 Emphasis on inventory reduction, fill rate improvement, supply/demand matching, and forecast accuracy Focus tended to be on large volume items Cross-functional SKU Rat efforts Used ABC methodology in Manugistics – static # of days, based on volume ― C&D targets were insufficient for many low-volume items Page 4
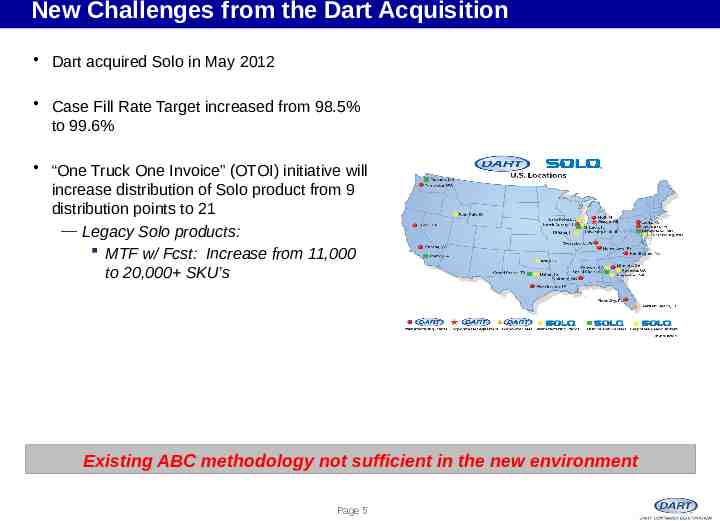
New Challenges from the Dart Acquisition Dart acquired Solo in May 2012 Case Fill Rate Target increased from 98.5% to 99.6% “One Truck One Invoice” (OTOI) initiative will increase distribution of Solo product from 9 distribution points to 21 ― Legacy Solo products: MTF w/ Fcst: Increase from 11,000 to 20,000 SKU’s Existing ABC methodology not sufficient in the new environment Page 5
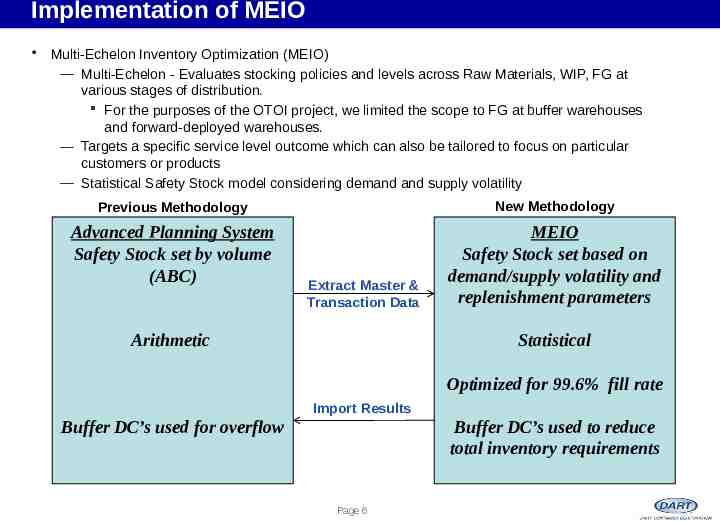
Implementation of MEIO Multi-Echelon Inventory Optimization (MEIO) ― Multi-Echelon - Evaluates stocking policies and levels across Raw Materials, WIP, FG at various stages of distribution. For the purposes of the OTOI project, we limited the scope to FG at buffer warehouses and forward-deployed warehouses. ― Targets a specific service level outcome which can also be tailored to focus on particular customers or products ― Statistical Safety Stock model considering demand and supply volatility Previous Methodology New Methodology Advanced Planning System Safety Stock set by volume (ABC) MEIO Safety Stock set based on demand/supply volatility and replenishment parameters Extract Master & Transaction Data Arithmetic Statistical Optimized for 99.6% fill rate Import Results Buffer DC’s used for overflow Buffer DC’s used to reduce total inventory requirements Page 6
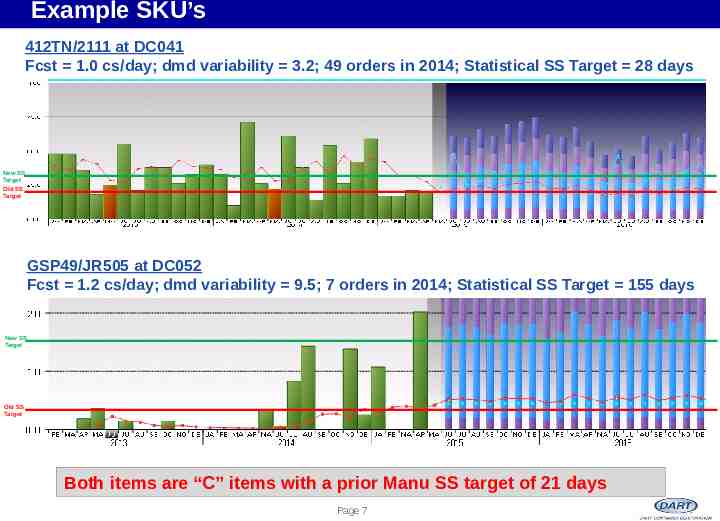
Example SKU’s 412TN/2111 at DC041 Fcst 1.0 cs/day; dmd variability 3.2; 49 orders in 2014; Statistical SS Target 28 days New SS Target Old SS Target GSP49/JR505 at DC052 Fcst 1.2 cs/day; dmd variability 9.5; 7 orders in 2014; Statistical SS Target 155 days New SS Target Old SS Target Both items are “C” items with a prior Manu SS target of 21 days Page 7
Optimization Results / Next Steps Current network: Can achieve 99.6% with significantly less inventory New statistical targets recently implemented at all locations and categories New network: Increase from 9 to 21 distribution points will require more inventory than optimized current network, but still less than existing inventory Running parallel environments for the current network (pre-OTOI) and the new network (post-OTOI) ― Implementing current network targets in Manugistics for deployment and short-term production scheduling ― Implementing new network targets for longer-term production planning and capacity models Using combination of current and new network targets to help plan/execute OTOI moves Currently transitioning to a new prod planning system – S099 will remain as bolt-on Page 8
Thank You Ed Goetting Dart Container Corporation Director of Sales & Operations Planning [email protected] [email protected] Page 9