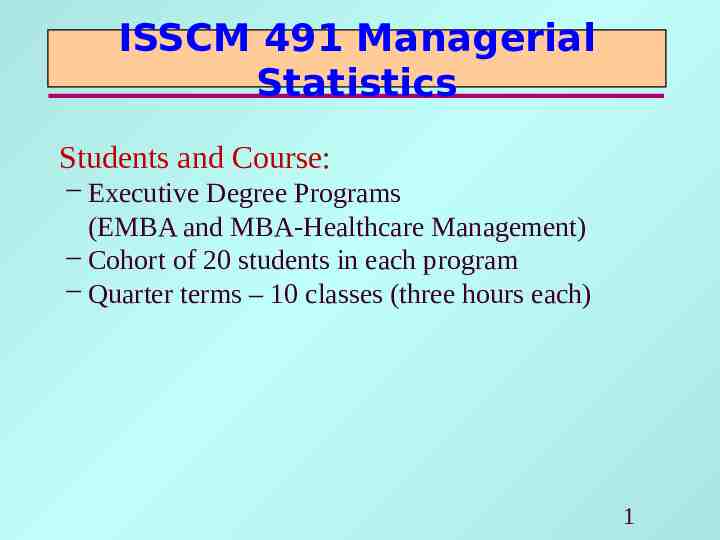
ISSCM 491 Managerial Statistics Students and Course: – Executive

11 Slides456.09 KB
ISSCM 491 Managerial Statistics Students and Course: - Executive Degree Programs (EMBA and MBA-Healthcare Management) - Cohort of 20 students in each program - Quarter terms – 10 classes (three hours each) 1
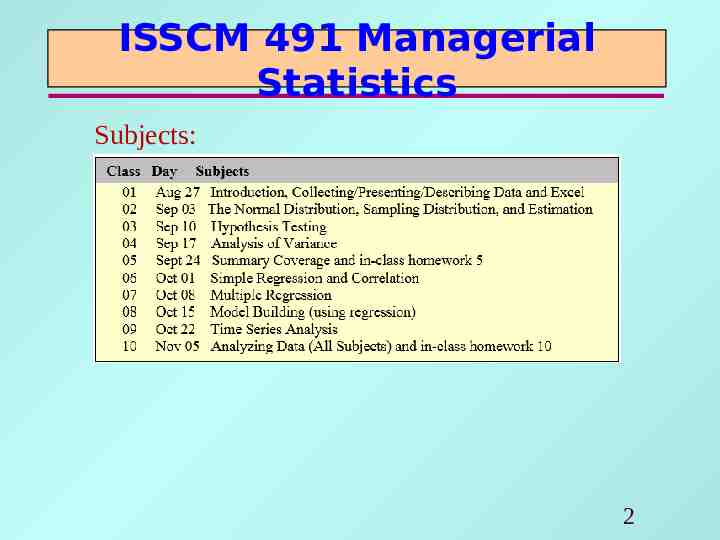
ISSCM 491 Managerial Statistics Subjects: 2
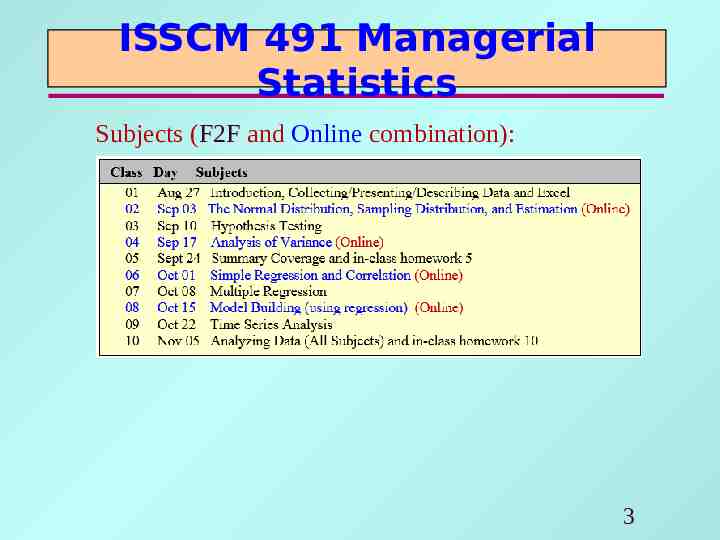
ISSCM 491 Managerial Statistics Subjects (F2F and Online combination): 3
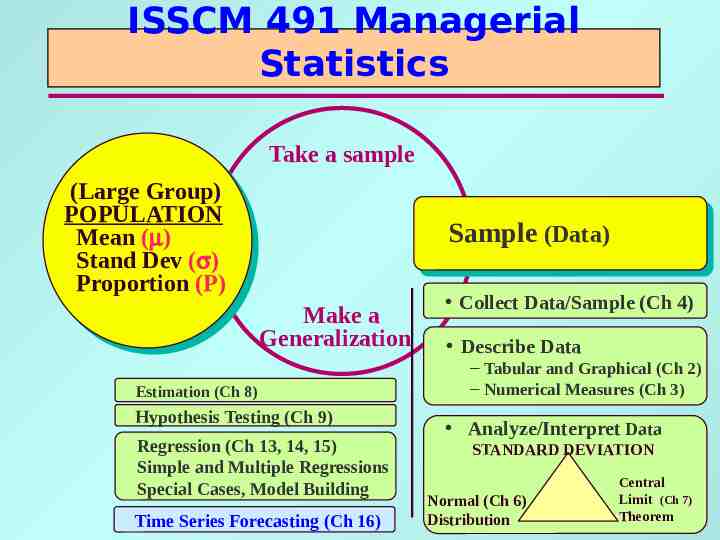
ISSCM 491 Managerial Statistics Take a sample (Large Group) POPULATION Mean (m) Stand Dev (s) Proportion (P) Sample (Data) Make a Generalization Estimation (Ch 8) Hypothesis Testing (Ch 9) Regression (Ch 13, 14, 15) Simple and Multiple Regressions Special Cases, Model Building Time Series Forecasting (Ch 16) Collect Data/Sample (Ch 4) Describe Data ‒ Tabular and Graphical (Ch 2) ‒ Numerical Measures (Ch 3) Analyze/Interpret Data STANDARD DEVIATION Normal (Ch 6) Distribution Central Limit (Ch 7) Theorem 4
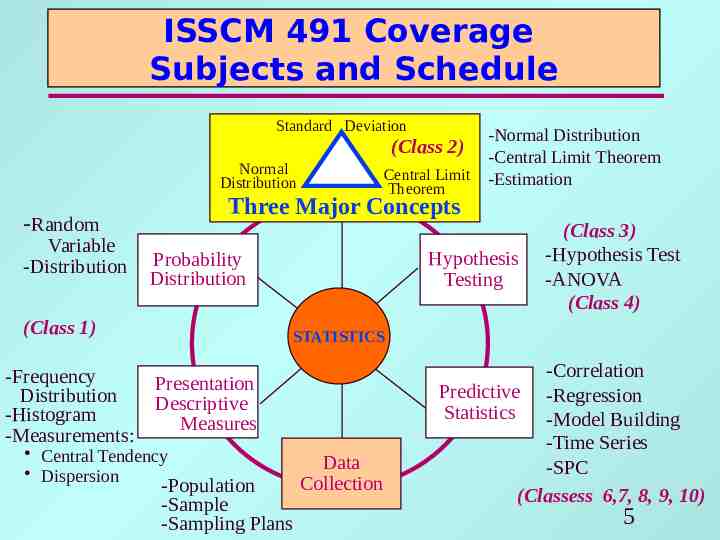
ISSCM 491 Coverage Subjects and Schedule Standard Deviation -Normal Distribution -Central Limit Theorem Central Limit -Estimation (Class 2) Normal Distribution Three Major Concepts -Random Variable -Distribution Hypothesis Testing Probability Distribution (Class 1) -Frequency Distribution -Histogram -Measurements: Theorem (Class 3) -Hypothesis Test -ANOVA (Class 4) STATISTICS Presentation Descriptive Measures Central Tendency Dispersion -Population -Sample -Sampling Plans Data Collection -Correlation Predictive -Regression Statistics -Model Building -Time Series -SPC (Classess 6,7, 8, 9, 10) 5
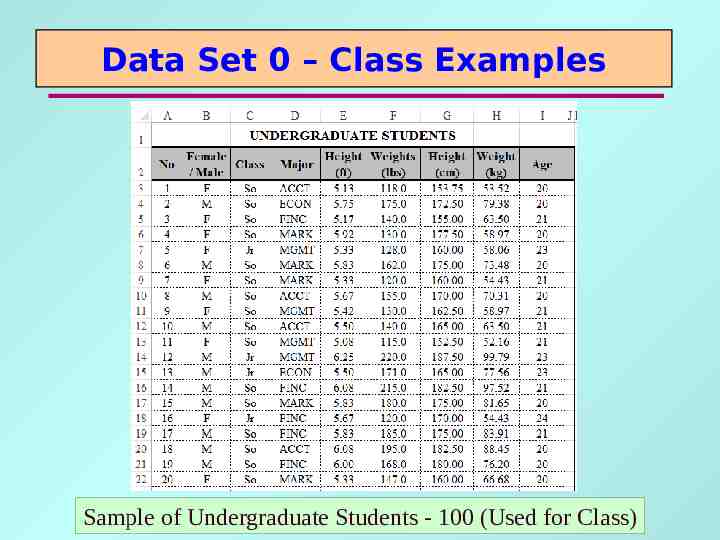
Data Set 0 – Class Examples 6 Sample of Undergraduate Students - 100 (Used for Class)
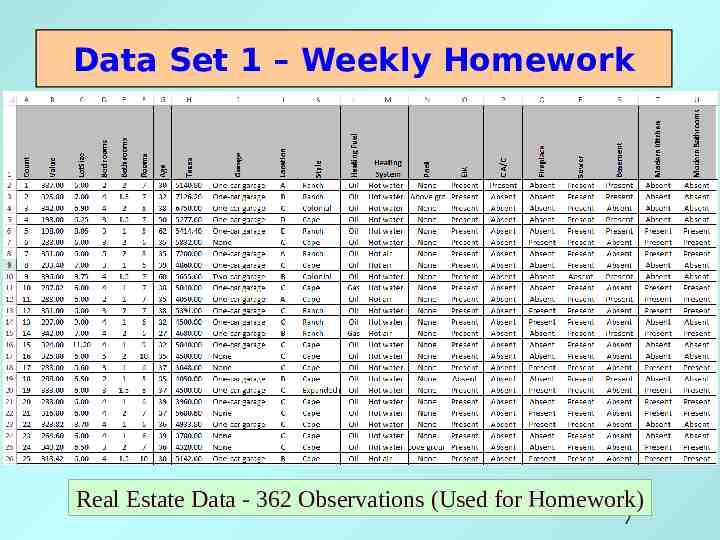
Data Set 1 – Weekly Homework Real Estate Data - 362 Observations (Used for Homework) 7
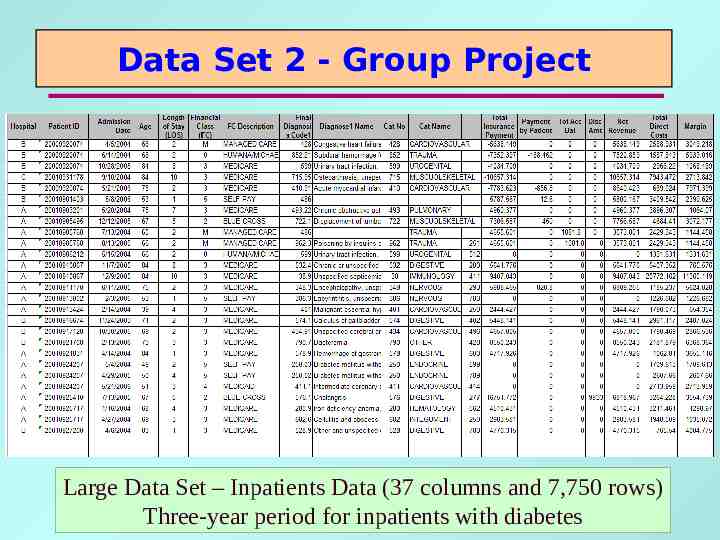
Data Set 2 - Group Project Large Data Set – Inpatients Data (37 columns and 7,750 rows) 8 Three-year period for inpatients with diabetes
ISSCM 491 Managerial Statistics Coverage in Classes: For each subject area What is to be covered? What does it tell us? The application of the technique? How is it calculated (results)? - Manual (using a small example) - Software (using Survey Data) How to interpret the results? What does the result indicate (not indicate)? 9
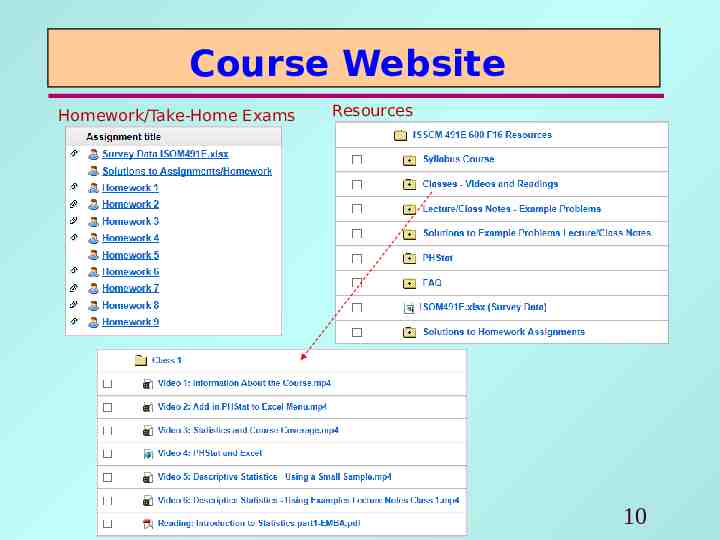
Course Website Homework/Take-Home Exams Resources 10
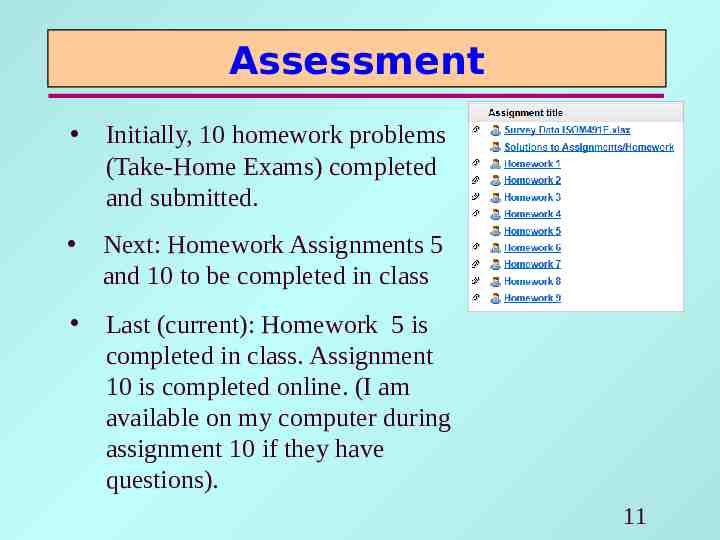
Assessment Initially, 10 homework problems (Take-Home Exams) completed and submitted. Next: Homework Assignments 5 and 10 to be completed in class Last (current): Homework 5 is completed in class. Assignment 10 is completed online. (I am available on my computer during assignment 10 if they have questions). 11