Implementation of Bayesian Logistic Regression for dose escalation


45 Slides1.45 MB
Implementation of Bayesian Logistic Regression for dose escalation at Novartis Oncology Glen Laird, Novartis Oncology Workshop in Phase I designs October 2, 2009 With contributions from Beat Neuenschwander, Bill Mietlowski, Jyotirmoy Dey, and Stuart Bailey.
Outline of Presentation Background on Phase I needs CRM/MCRM background One Novartis experience FDA feedback on potential issues w/ CRM Example studies cited Novartis implementation of Bayesian Logistic Regression Statistical model Protocol planning and Study execution Decision making during dose-escalation teleconference Comparison of Bayesian Logistic and CRM methods Key messages 2 Novartis implementation of Bayesian Logistic Regression Phase 1 Workshop Oct 2nd, 2009
Flexible Phase I Oncology Designs Requirements for dose-escalation
Challenges of Oncology Phase I Trials Accurately determine the Maximum Tolerated Dose (MTD) Untested drug in resistant patients Unknown potential for toxicity – Avoid “overdosing” while trying to test a wide dose-range and learn about dose-toxicity relationship Avoid sub-therapeutic doses while controlling “overdosing” Identify active and acceptable doses for phase II/III Rare and very-ill patients Use as few patients as possible – cohorts of 3-6 Inability to distinguish tox due to condition from tox due to drug Ph 1 pts also hope for therapeutic benefit Use all available information efficiently 4 Novartis implementation of Bayesian Logistic Regression Phase 1 Workshop Oct 2nd, 2009
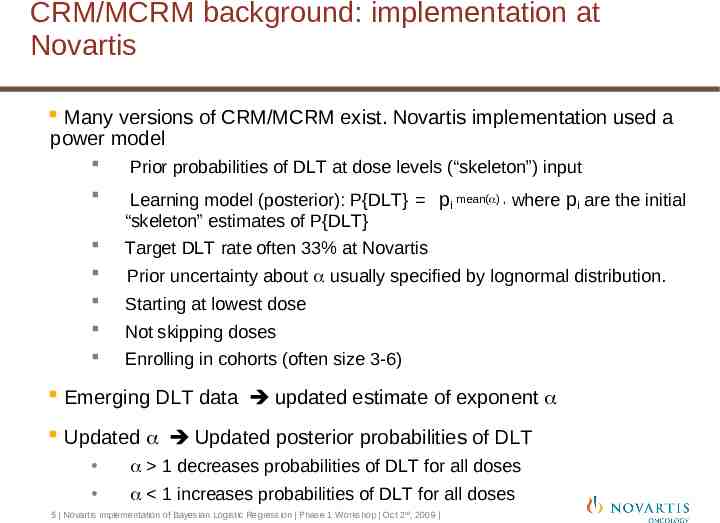
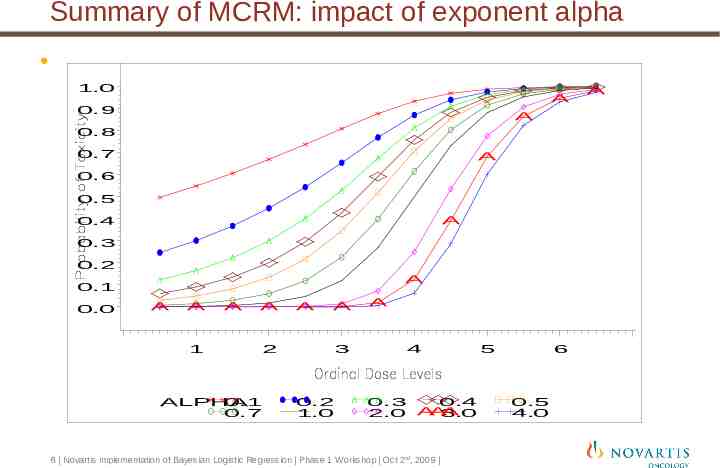
CRM/MCRM background: implementation at Novartis Many versions of CRM/MCRM exist. Novartis implementation used a power model Prior probabilities of DLT at dose levels (“skeleton”) input Learning model (posterior): P{DLT} pi mean( ) , where pi are the initial “skeleton” estimates of P{DLT} Target DLT rate often 33% at Novartis Prior uncertainty about usually specified by lognormal distribution. Starting at lowest dose Not skipping doses Enrolling in cohorts (often size 3-6) Emerging DLT data updated estimate of exponent Updated Updated posterior probabilities of DLT 1 decreases probabilities of DLT for all doses 1 increases probabilities of DLT for all doses 5 Novartis implementation of Bayesian Logistic Regression Phase 1 Workshop Oct 2nd, 2009
Summary of MCRM: impact of exponent alpha 1.0 A 0.9 A 0.8 0.7 A 0.6 0.5 A 0.4 0.3 0.2 A 0.1 0.0 A A 1 A A A A 2 ALPHA 0.1 0.7 3 0.2 1.0 A 4 0.3 0.4 A A 2.0 A 3.0 6 Novartis implementation of Bayesian Logistic Regression Phase 1 Workshop Oct 2nd, 2009 5 6 0.5 4.0 A
CRM/MCRM background CRM/MCRM uses 1-parameter model depends on correct specification of skeleton (log posterior probability DLT proportional to log prior skeleton) Serious mis-specification of skeleton can lead to excessive dosing On-study recommendations may be impractical (or not followed by clinicians) even if final dose recommendation would be reasonable. CRM/MCRM ignores precision of updated estimate of exponent Same updating if estimate of came from cohorts of 1, 3, 6, or 12 patients 7 Novartis implementation of Bayesian Logistic Regression Phase 1 Workshop Oct 2nd, 2009
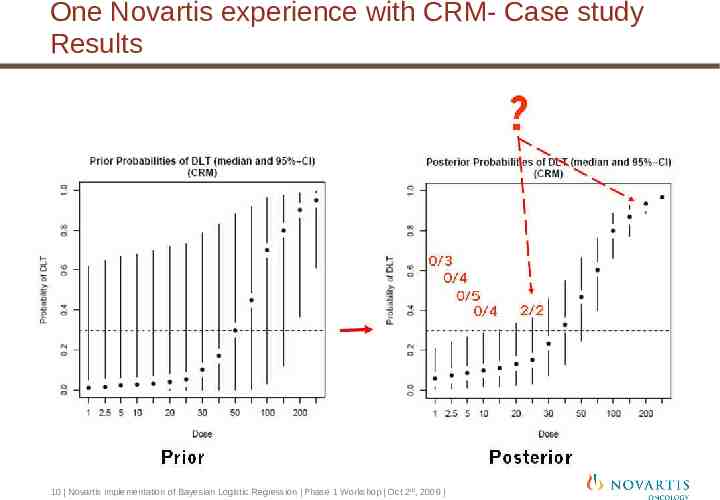
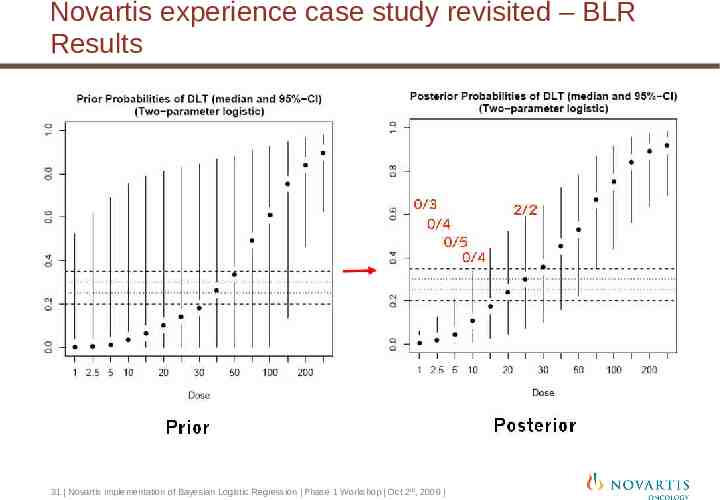
One Novartis experience with MCRM Motivating example (from Neuenschwander, et al, 2008) open-label, multicenter, non-comparative, dose-escalation cancer trial designed to characterize the safety, tolerability and PK profile of a drug and to determine its MTD. The pre-defined doses were 1, 2.5, 5, 10, 15, 20, 25, 30, 40, 50, 75, 100, 150, 200 and 250 mg. Target P(DLT) .3. The first cohort of patients was treated at 1mg. No DLTs were observed for the first four cohorts of patients. clinical team decided to skip 2 doses to 25mg (contradicting the planned MCRM in which doses were not supposed to be skipped) Both patients dosed at 25 mg experienced DLT MCRM recommended further escalation, to the dismay of the team. 8 Novartis implementation of Bayesian Logistic Regression Phase 1 Workshop Oct 2nd, 2009
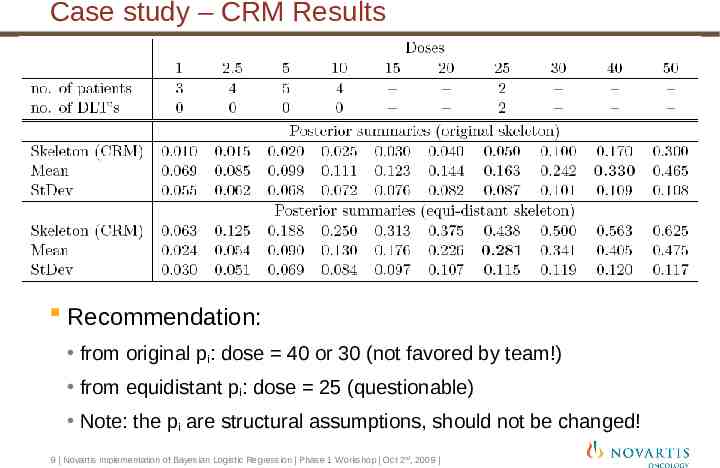
Case study – CRM Results Recommendation: from original pi: dose 40 or 30 (not favored by team!) from equidistant pi: dose 25 (questionable) Note: the pi are structural assumptions, should not be changed! 9 Novartis implementation of Bayesian Logistic Regression Phase 1 Workshop Oct 2nd, 2009
One Novartis experience with CRM- Case study Results 10 Novartis implementation of Bayesian Logistic Regression Phase 1 Workshop Oct 2nd, 2009
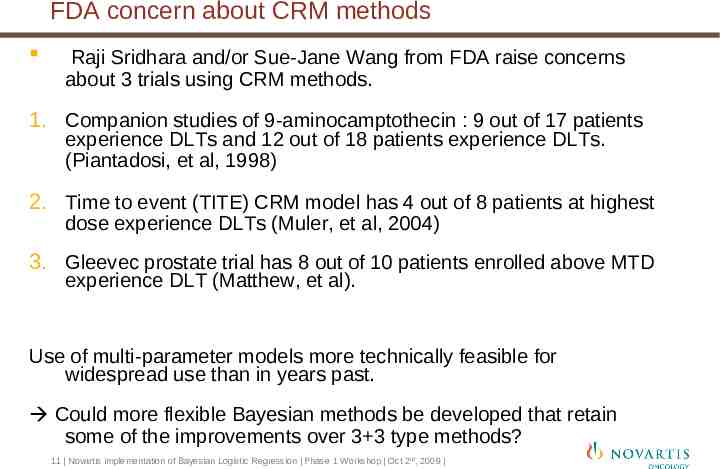
FDA concern about CRM methods Raji Sridhara and/or Sue-Jane Wang from FDA raise concerns about 3 trials using CRM methods. 1. Companion studies of 9-aminocamptothecin : 9 out of 17 patients experience DLTs and 12 out of 18 patients experience DLTs. (Piantadosi, et al, 1998) 2. Time to event (TITE) CRM model has 4 out of 8 patients at highest dose experience DLTs (Muler, et al, 2004) 3. Gleevec prostate trial has 8 out of 10 patients enrolled above MTD experience DLT (Matthew, et al). Use of multi-parameter models more technically feasible for widespread use than in years past. Could more flexible Bayesian methods be developed that retain some of the improvements over 3 3 type methods? 11 Novartis implementation of Bayesian Logistic Regression Phase 1 Workshop Oct 2nd, 2009
Flexible Phase I Oncology Designs Statistical Aspects
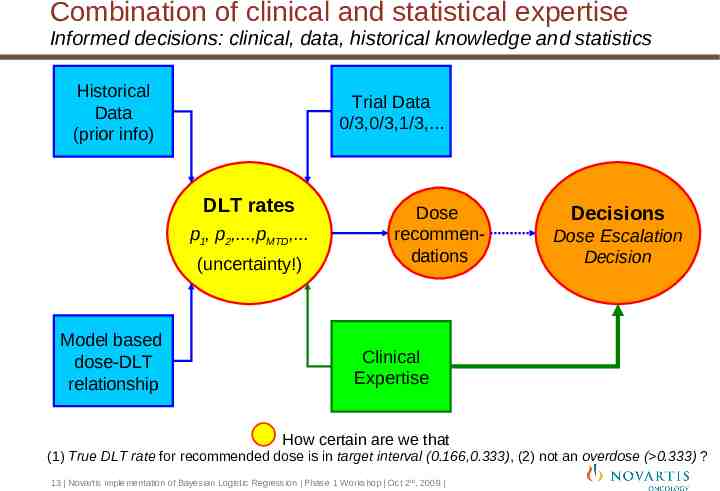
Combination of clinical and statistical expertise Informed decisions: clinical, data, historical knowledge and statistics Historical Data (prior info) Trial Data 0/3,0/3,1/3,. DLT rates p1, p2,.,pMTD,. (uncertainty!) Model based dose-DLT relationship Dose recommendations Decisions Dose Escalation Decision Clinical Expertise How certain are we that (1) True DLT rate for recommended dose is in target interval (0.166,0.333), (2) not an overdose ( 0.333) ? 13 Novartis implementation of Bayesian Logistic Regression Phase 1 Workshop Oct 2nd, 2009
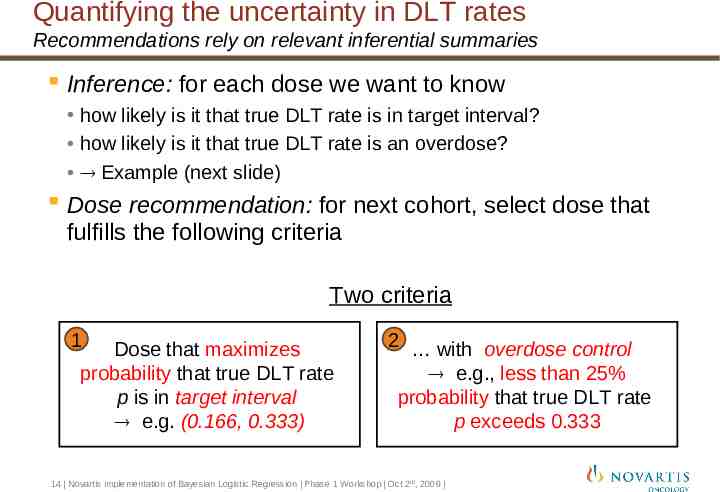
Quantifying the uncertainty in DLT rates Recommendations rely on relevant inferential summaries Inference: for each dose we want to know how likely is it that true DLT rate is in target interval? how likely is it that true DLT rate is an overdose? Example (next slide) Dose recommendation: for next cohort, select dose that fulfills the following criteria Two criteria 1 Dose that maximizes probability that true DLT rate p is in target interval e.g. (0.166, 0.333) 2 with overdose control e.g., less than 25% probability that true DLT rate p exceeds 0.333 14 Novartis implementation of Bayesian Logistic Regression Phase 1 Workshop Oct 2nd, 2009
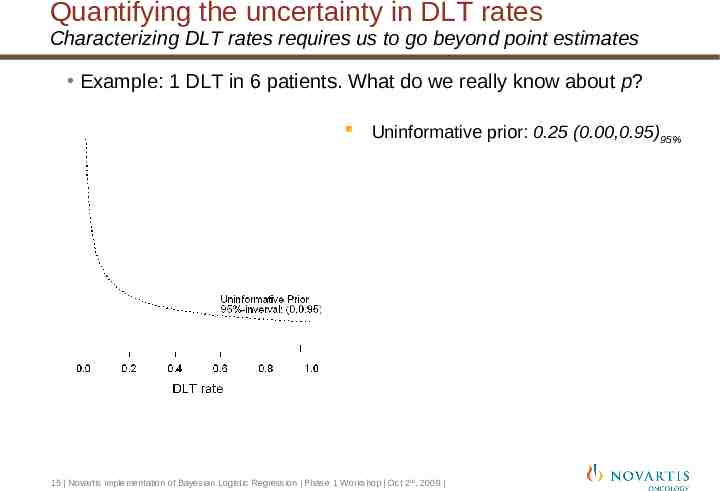
Quantifying the uncertainty in DLT rates Characterizing DLT rates requires us to go beyond point estimates Example: 1 DLT in 6 patients. What do we really know about p? Uninformative prior: 0.25 (0.00,0.95)95% 15 Novartis implementation of Bayesian Logistic Regression Phase 1 Workshop Oct 2nd, 2009
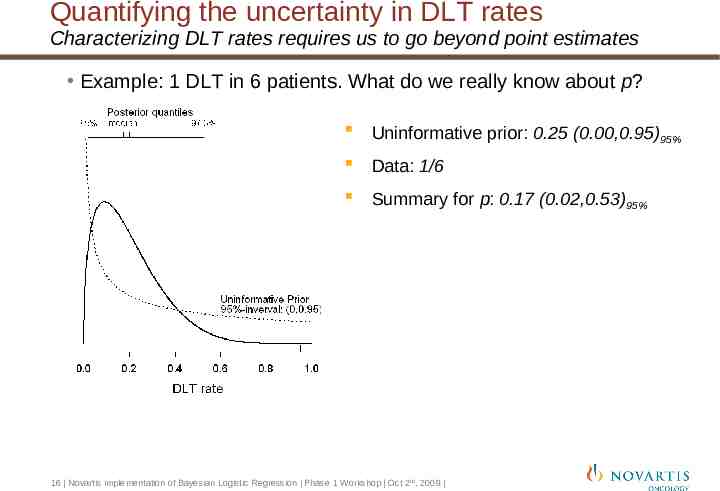
Quantifying the uncertainty in DLT rates Characterizing DLT rates requires us to go beyond point estimates Example: 1 DLT in 6 patients. What do we really know about p? Uninformative prior: 0.25 (0.00,0.95)95% Data: 1/6 Summary for p: 0.17 (0.02,0.53)95% 16 Novartis implementation of Bayesian Logistic Regression Phase 1 Workshop Oct 2nd, 2009
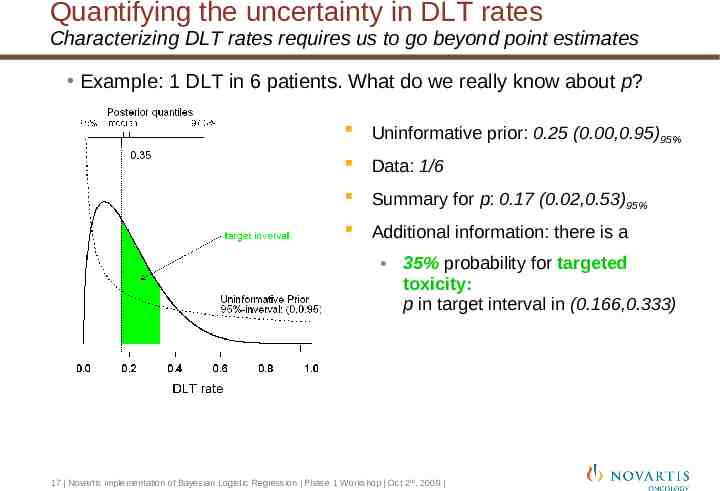
Quantifying the uncertainty in DLT rates Characterizing DLT rates requires us to go beyond point estimates Example: 1 DLT in 6 patients. What do we really know about p? Uninformative prior: 0.25 (0.00,0.95)95% Data: 1/6 Summary for p: 0.17 (0.02,0.53)95% Additional information: there is a 35% probability for targeted toxicity: p in target interval in (0.166,0.333) 17 Novartis implementation of Bayesian Logistic Regression Phase 1 Workshop Oct 2nd, 2009
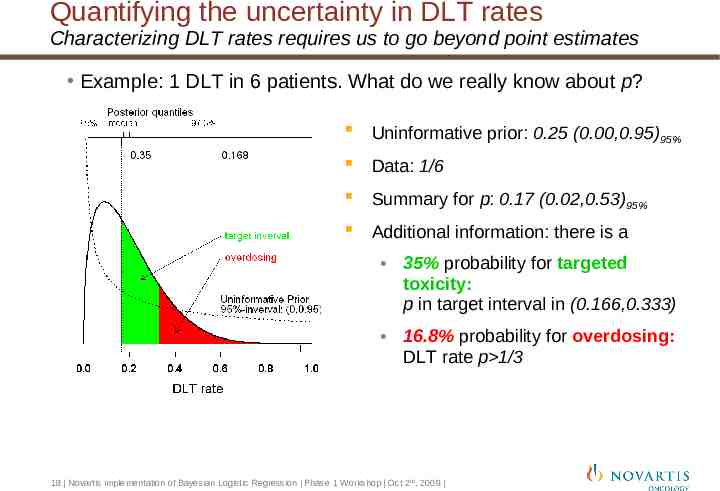
Quantifying the uncertainty in DLT rates Characterizing DLT rates requires us to go beyond point estimates Example: 1 DLT in 6 patients. What do we really know about p? Uninformative prior: 0.25 (0.00,0.95)95% Data: 1/6 Summary for p: 0.17 (0.02,0.53)95% Additional information: there is a 35% probability for targeted toxicity: p in target interval in (0.166,0.333) 16.8% probability for overdosing: DLT rate p 1/3 18 Novartis implementation of Bayesian Logistic Regression Phase 1 Workshop Oct 2nd, 2009
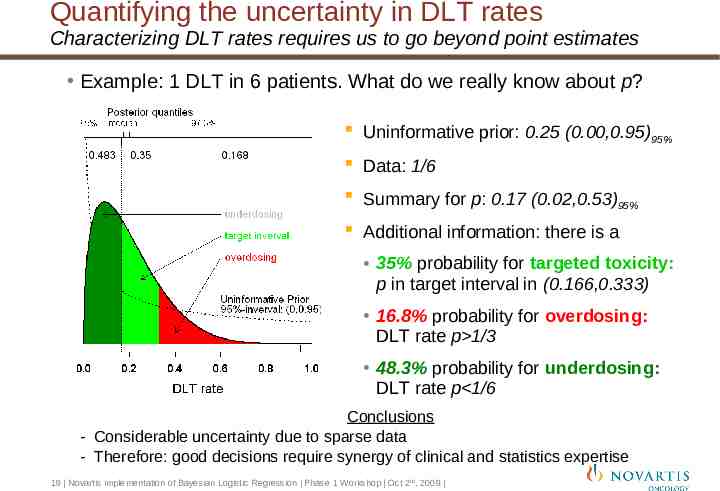
Quantifying the uncertainty in DLT rates Characterizing DLT rates requires us to go beyond point estimates Example: 1 DLT in 6 patients. What do we really know about p? Uninformative prior: 0.25 (0.00,0.95)95% Data: 1/6 Summary for p: 0.17 (0.02,0.53)95% Additional information: there is a 35% probability for targeted toxicity: p in target interval in (0.166,0.333) 16.8% probability for overdosing: DLT rate p 1/3 48.3% probability for underdosing: DLT rate p 1/6 Conclusions - Considerable uncertainty due to sparse data - Therefore: good decisions require synergy of clinical and statistics expertise 19 Novartis implementation of Bayesian Logistic Regression Phase 1 Workshop Oct 2nd, 2009
Methodology - Overview Inference: model-based. Recommendations: target toxicity, overdose control Model: logistic regression Inference is Bayesian Priors “uninformative” priors based on historical data mixture priors accounting for pre-clinical variability Dose recommendations: balancing target toxicity & safety Target toxicity: recommend dose that is in target interval with high probability Safety: dose must fulfill overdose criterion Note: this approach is safer than recommending dose with an estimated DLT rate that is closest to target toxicity (e.g. 25%) 20 Novartis implementation of Bayesian Logistic Regression Phase 1 Workshop Oct 2nd, 2009
Models Reasonably flexible model is needed to ensure good performance Basic model: logistic regression DLT rate p, dose d: logit(p) log(p/(1-p)) log( ) .log(d), , 0 reasonably flexible 2-parameter model Extensions of basic model Covariates X (): logit(p) log( ) .log(d) X - e.g. dose regimen or patient characteristics - e.g. levels of combination partner (Bailey, et al, 2009) Combination setting: DLT rate for combination of two compounds Ordinal Data: e.g. no DLT, low-grade toxicity, DLT Joint Safety-Efficacy model 21 Novartis implementation of Bayesian Logistic Regression Phase 1 Workshop Oct 2nd, 2009
Protocol development Pre-define provisional dose escalation steps Provisional doses decided on expected escalation scheme typically indicate maximum one-step jump. Intermediate doses may be used on data-driven basis Minimum cohort-size – typically 3. Allow enrollment of additional subjects for dropouts or cohort expansion Simulation tool exists to test operating characteristics Performance of the design in terms of correct dose-determination, gain in efficiency under various assumed dose-toxicity relationships (truths) 22 Novartis implementation of Bayesian Logistic Regression Phase 1 Workshop Oct 2nd, 2009
Protocol development Stopping rules (“rules for declaring the MTD”) At least 6 evaluable patients at the MTD level with at least 21 patients evaluated in total in the dose escalation phase or At least 9 patients evaluated at a dose level with a high precision (model recommends the same dose as the highest dose that is not an overdose with 50% posterior probability in the target toxicity interval.) 23 Novartis implementation of Bayesian Logistic Regression Phase 1 Workshop Oct 2nd, 2009
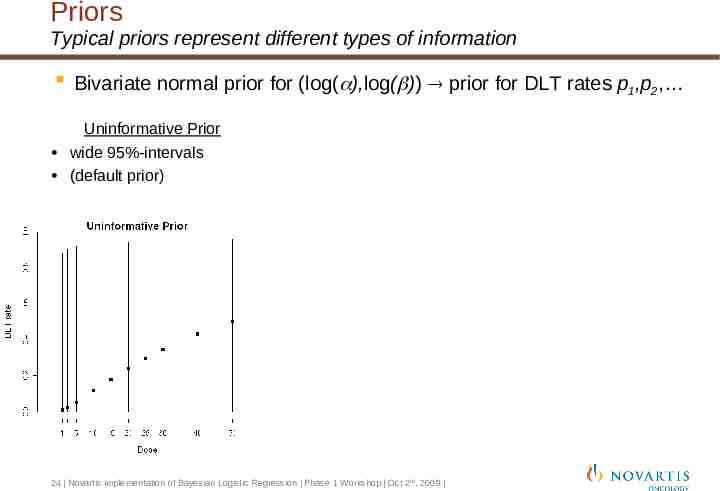
Priors Typical priors represent different types of information Bivariate normal prior for (log( ),log( )) prior for DLT rates p1,p2, Uninformative Prior wide 95%-intervals (default prior) 24 Novartis implementation of Bayesian Logistic Regression Phase 1 Workshop Oct 2nd, 2009
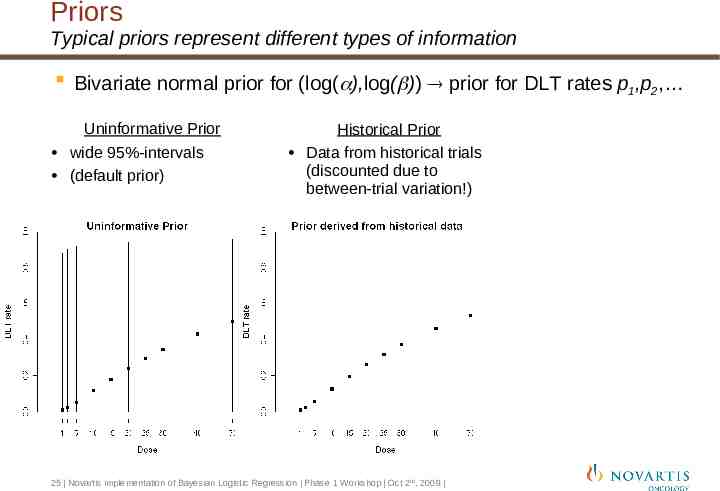
Priors Typical priors represent different types of information Bivariate normal prior for (log( ),log( )) prior for DLT rates p1,p2, Uninformative Prior wide 95%-intervals (default prior) Historical Prior Data from historical trials (discounted due to between-trial variation!) 25 Novartis implementation of Bayesian Logistic Regression Phase 1 Workshop Oct 2nd, 2009
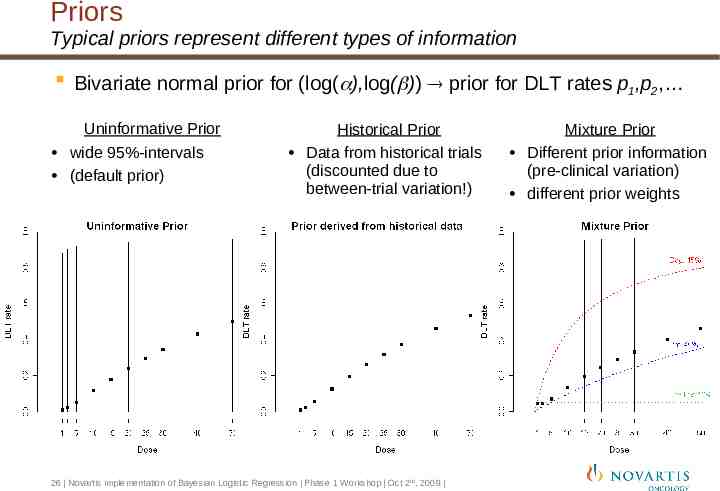
Priors Typical priors represent different types of information Bivariate normal prior for (log( ),log( )) prior for DLT rates p1,p2, Uninformative Prior wide 95%-intervals (default prior) Historical Prior Data from historical trials (discounted due to between-trial variation!) 26 Novartis implementation of Bayesian Logistic Regression Phase 1 Workshop Oct 2nd, 2009 Mixture Prior Different prior information (pre-clinical variation) different prior weights
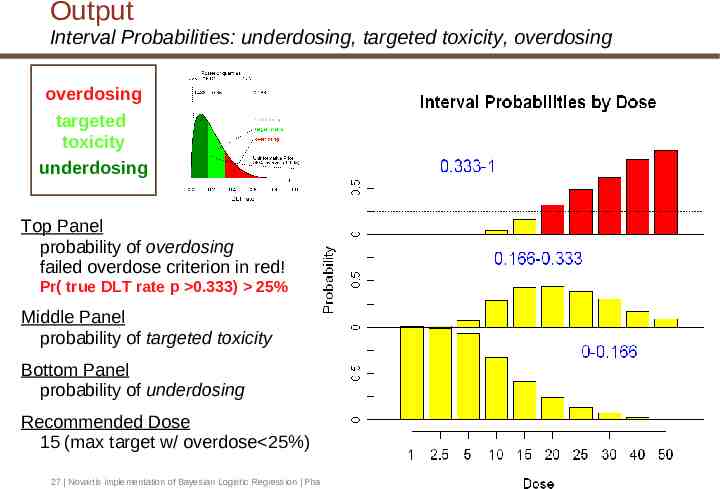
Output Interval Probabilities: underdosing, targeted toxicity, overdosing overdosing targeted toxicity underdosing Top Panel probability of overdosing failed overdose criterion in red! Pr( true DLT rate p 0.333) 25% Middle Panel probability of targeted toxicity Bottom Panel probability of underdosing Recommended Dose 15 (max target w/ overdose 25%) 27 Novartis implementation of Bayesian Logistic Regression Phase 1 Workshop Oct 2nd, 2009
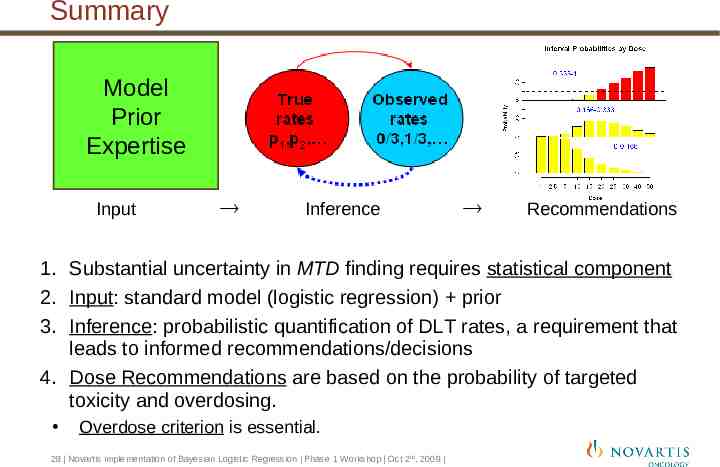
Summary Model Prior Expertise Input Inference Recommendations 1. Substantial uncertainty in MTD finding requires statistical component 2. Input: standard model (logistic regression) prior 3. Inference: probabilistic quantification of DLT rates, a requirement that leads to informed recommendations/decisions 4. Dose Recommendations are based on the probability of targeted toxicity and overdosing. Overdose criterion is essential. 28 Novartis implementation of Bayesian Logistic Regression Phase 1 Workshop Oct 2nd, 2009
Comparison of Operating characteristics to CRM/MCRM (Neuenschwander, et al, 2008) Simulations performed comparing CRM (with 27% target rate); MCRM; Logistic Regression based on 27% target rate (LRmean). Logistic Regression maximizing target toxicity (LRcat); Logistic Regression maximizing target toxicity with 25% overdose control (LRcat25); Eight scenarios studies using 7 dose levels. “true” MTD (27% DLT rate) varied from dose level 1,2,4,6, or 7 Flat and steep true curves studied Same prior medians and vague priors used Fixed sample size of 24 or 36 patients. Older version of target toxicity used (20% - 35% DLT rate) 29 Novartis implementation of Bayesian Logistic Regression Phase 1 Workshop Oct 2nd, 2009
Comparison of Operating characteristics to CRM/MCRM Performance LRcat25 and MCRM have lower average number of DLTs than the more aggressive CRM, LRmean, and LRcat methods LRcat25 selected correct dose with similar frequency as the more aggressive methods - It was slightly lower (approximately 6%-10% lower) for “flat” toxicity curves in which the true MTD was high (dose 6) MCRM had worse targeting than other methods when the true dose was a high dose level. By being more aggressive only when the full posterior summary justifies it, LRcat25 appears to combine some of the added safety of the MCRM with the superior targeting of the CRM, LRmean, and LRcat methods. Thall and Lee (2003) also compared performance 30 Novartis implementation of Bayesian Logistic Regression Phase 1 Workshop Oct 2nd, 2009
Novartis experience case study revisited – BLR Results 31 Novartis implementation of Bayesian Logistic Regression Phase 1 Workshop Oct 2nd, 2009
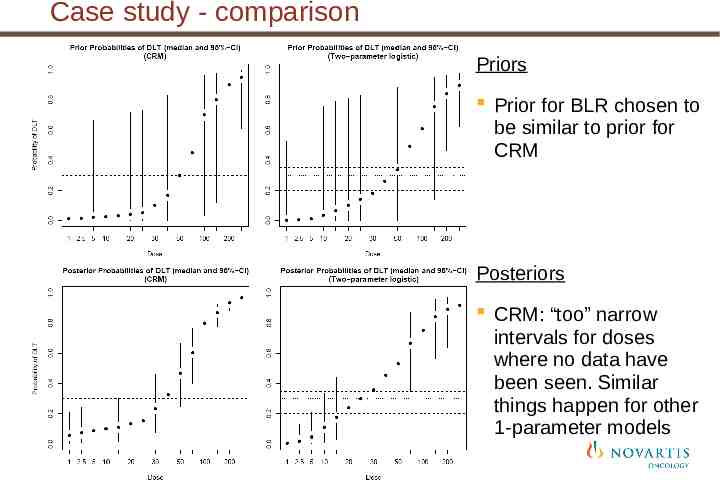
Case study - comparison Priors Prior for BLR chosen to be similar to prior for CRM Posteriors CRM: “too” narrow intervals for doses where no data have been seen. Similar things happen for other 1-parameter models 32 Novartis implementation of Bayesian Logistic Regression Phase 1 Workshop Oct 2nd, 2009
Case study: Summary CRM not able to react to the toxicity data due to less flexibility in 1-parameter model Lack of uncertainty at high (never tested) doses BLR does not suffer from the same issue and makes sensible on-study recommendations in this case Parameterization allows uncertainty to remain at doses never tested and therefore model can adapt more easily BLR approach to estimating the MTD is more suitable in this case study than the CRM approach Provide better estimation of the full dose response curve (still not the primary goal though!) 33 Novartis implementation of Bayesian Logistic Regression Phase 1 Workshop Oct 2nd, 2009
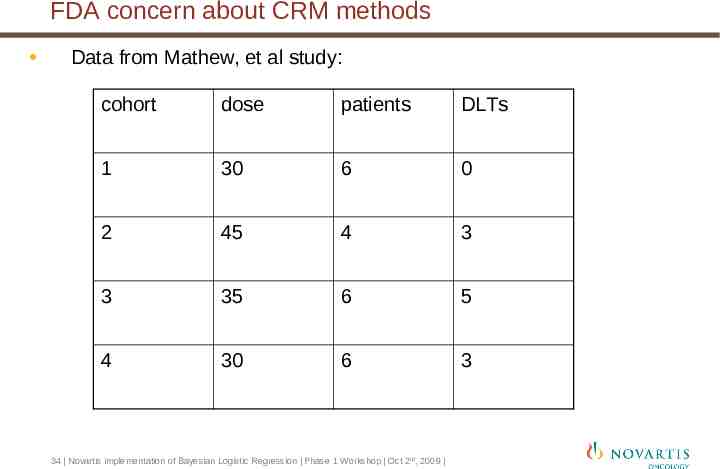
FDA concern about CRM methods Data from Mathew, et al study: cohort dose patients DLTs 1 30 6 0 2 45 4 3 3 35 6 5 4 30 6 3 34 Novartis implementation of Bayesian Logistic Regression Phase 1 Workshop Oct 2nd, 2009
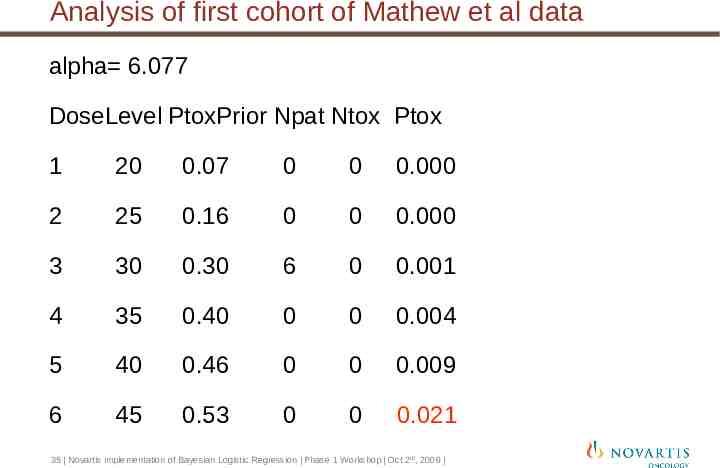
Analysis of first cohort of Mathew et al data alpha 6.077 DoseLevel PtoxPrior Npat Ntox Ptox 1 20 0.07 0 0 0.000 2 25 0.16 0 0 0.000 3 30 0.30 6 0 0.001 4 35 0.40 0 0 0.004 5 40 0.46 0 0 0.009 6 45 0.53 0 0 0.021 35 Novartis implementation of Bayesian Logistic Regression Phase 1 Workshop Oct 2nd, 2009
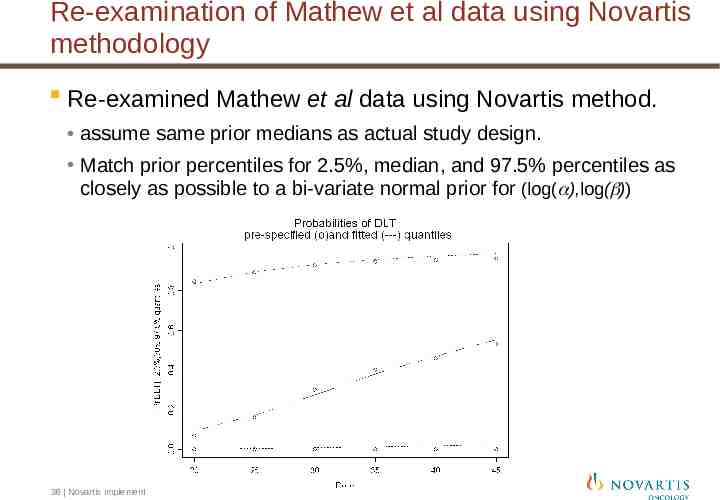
Re-examination of Mathew et al data using Novartis methodology Re-examined Mathew et al data using Novartis method. assume same prior medians as actual study design. Match prior percentiles for 2.5%, median, and 97.5% percentiles as closely as possible to a bi-variate normal prior for (log( ),log( )) 36 Novartis implementation of Bayesian Logistic Regression Phase 1 Workshop Oct 2nd, 2009
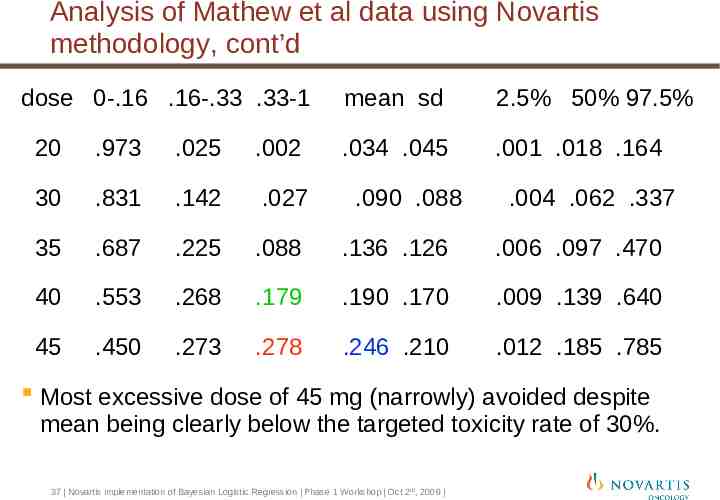
Analysis of Mathew et al data using Novartis methodology, cont’d dose 0-.16 .16-.33 .33-1 mean sd 2.5% 50% 97.5% .034 .045 .001 .018 .164 20 .973 .025 .002 30 .831 .142 .027 35 .687 .225 .088 .136 .126 .006 .097 .470 40 .553 .268 .179 .190 .170 .009 .139 .640 45 .450 .273 .278 .246 .210 .012 .185 .785 .090 .088 .004 .062 .337 Most excessive dose of 45 mg (narrowly) avoided despite mean being clearly below the targeted toxicity rate of 30%. 37 Novartis implementation of Bayesian Logistic Regression Phase 1 Workshop Oct 2nd, 2009
Implementation message taken from JSM Dan Sargent noted at JSM 2009 that the differences between Bayesian methodologies are not as important as the need to replace “3 3” methods with some form of Bayesian method. Good to continue to search for better dose escalation methods, but don’t let that stop the implementation of methods that are at least better than “3 3” 38 Novartis implementation of Bayesian Logistic Regression Phase 1 Workshop Oct 2nd, 2009
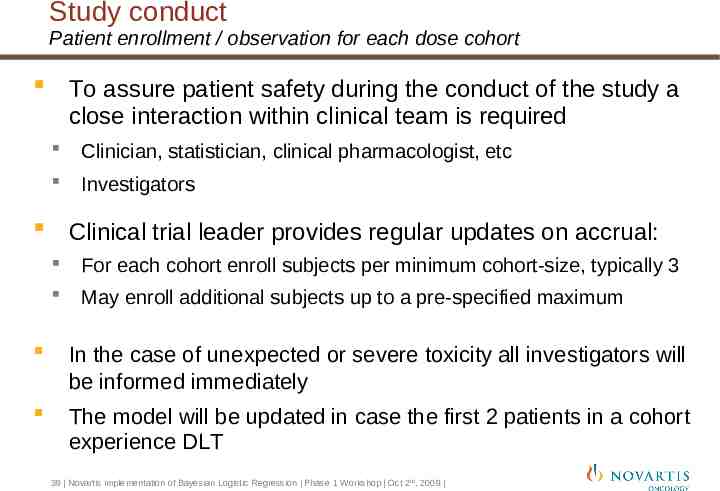
Study conduct Patient enrollment / observation for each dose cohort To assure patient safety during the conduct of the study a close interaction within clinical team is required Clinician, statistician, clinical pharmacologist, etc Investigators Clinical trial leader provides regular updates on accrual: For each cohort enroll subjects per minimum cohort-size, typically 3 May enroll additional subjects up to a pre-specified maximum In the case of unexpected or severe toxicity all investigators will be informed immediately The model will be updated in case the first 2 patients in a cohort experience DLT 39 Novartis implementation of Bayesian Logistic Regression Phase 1 Workshop Oct 2nd, 2009
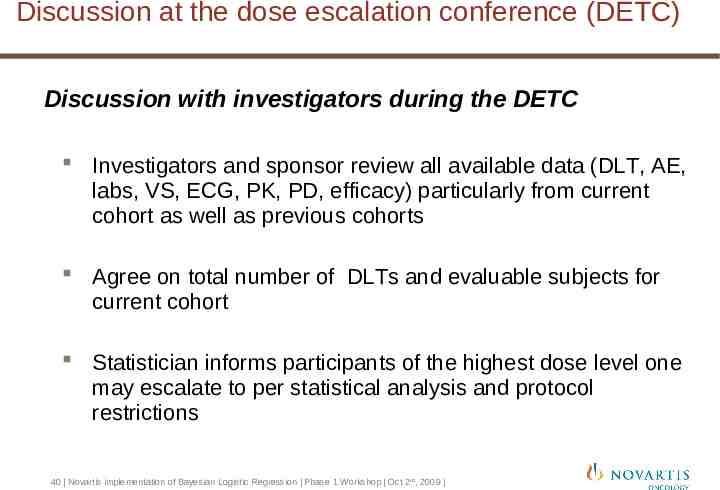
Discussion at the dose escalation conference (DETC) Discussion with investigators during the DETC Investigators and sponsor review all available data (DLT, AE, labs, VS, ECG, PK, PD, efficacy) particularly from current cohort as well as previous cohorts Agree on total number of DLTs and evaluable subjects for current cohort Statistician informs participants of the highest dose level one may escalate to per statistical analysis and protocol restrictions 40 Novartis implementation of Bayesian Logistic Regression Phase 1 Workshop Oct 2nd, 2009
Dose escalation decision Participants decide if synthesis of relevant clinical data justifies a dose escalation and to which dose (highest supported by the Bayesian analysis and protocol or intermediate) Decisions are documented via minutes and communicated to all participants. 41 Novartis implementation of Bayesian Logistic Regression Phase 1 Workshop Oct 2nd, 2009
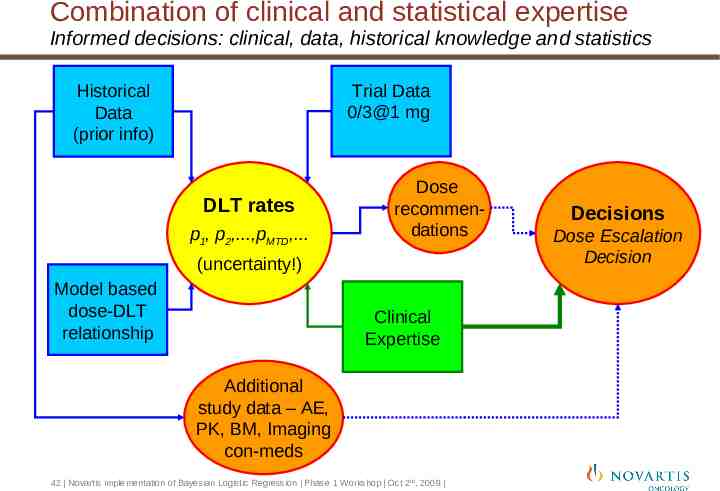
Combination of clinical and statistical expertise Informed decisions: clinical, data, historical knowledge and statistics Trial Data 0/3@1 mg Historical Data (prior info) DLT rates p1, p2,.,pMTD,. Dose recommendations (uncertainty!) Model based dose-DLT relationship Clinical Expertise Additional study data – AE, PK, BM, Imaging con-meds 42 Novartis implementation of Bayesian Logistic Regression Phase 1 Workshop Oct 2nd, 2009 Decisions Dose Escalation Decision
Flexible Phase I Oncology Designs Concluding remarks
Key Messages Patient safety is the primary objective Statistical approach quantifies knowledge about DLT data only Statistical inference is used as one component of a decision-making framework - Provides upper bound for potential doses based on uncertainty statements - To reduce risk of overdose obtain more information at lower doses Application of our approach can be protocol/drug specific Maximum escalation steps, minimum and maximum cohort sizes, stopping rules are pre-specified Studies require active review of ongoing study data by Novartis and investigators Novartis method appears to have good targeting properties while preserving patient safety 44 Novartis implementation of Bayesian Logistic Regression Phase 1 Workshop Oct 2nd, 2009
References Bailey, Neuenschwander, Laird, Branson (2009). A Bayesian case study in oncology phase I combination dose-finding using logistic regression with covariates. Journal of Biopharmaceutical Statistics, 19:369-484 Mathew, Thall, Jones, Perez, Bucana, Troncoso, Kim, Fidler, and Logothetis (2004). Plateletderived Growth Factor Receptor Inhibitor Imatinib Mesylate and Docetaxel: A Modular Phase I Trial in Androgen-Independent Prostate Cancer Journal of Clinical Oncology, 16, 3323-3329. Muler, McGinn, Normolle, Lawrence, Brosn, Hejna, and Zalupski (2004) Phase I Trial Using a Time-to-Event Continual Reassessment Strategy for Dose Escalation of Cisplatin Combined With Gemcitabine and Radiation Therapy in Pancreatic Cancer Journal of Clinical Onocology, 22:238-243. Neuenschwander, Branson, Gsponer (2008) Critical aspects of the Bayesian approach to Phase I cancer trials. Statistics in Medicine, 27:2420-2439. Piantadosi, Fisher, and Grossman (1998) Validation Of Doses Selected Using The Continual Reassessment Method (Crm) In Patients With Primary Cns Malignancies. ASCO meeting abstract. Abstract #819. Thall, Lee (2003) Practical model-based dose-finding in phase I clinical trials: methods based on toxicity. Int J Gynecol Cancer 13: 251-261 45 Novartis implementation of Bayesian Logistic Regression Phase 1 Workshop Oct 2nd, 2009