FY02 ASA Presentation Environmental Protection Branch Presented


96 Slides8.84 MB
FY02 ASA Presentation Environmental Protection Branch Presented by: Don Wilson Division of Safety National Institutes of Health 18 November 2002 1
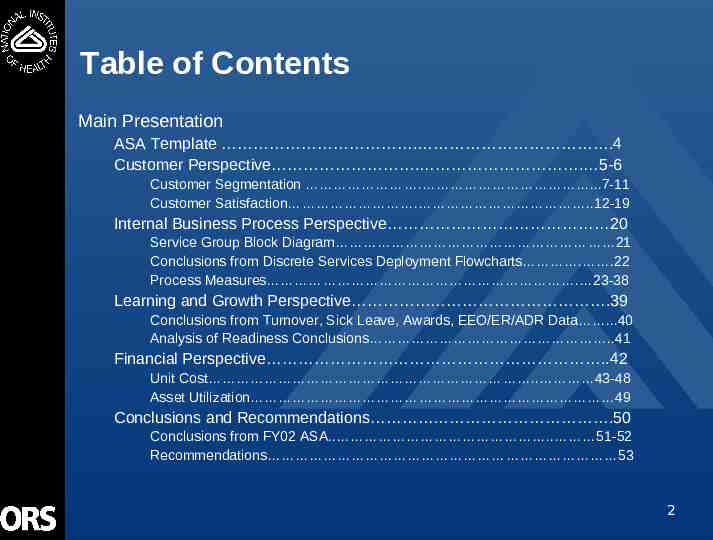
Table of Contents Main Presentation ASA Template . .4 Customer Perspective . . 5-6 Customer Segmentation . .7-11 Customer Satisfaction . .12-19 Internal Business Process Perspective 20 Service Group Block Diagram 21 Conclusions from Discrete Services Deployment Flowcharts . .22 Process Measures . 23-38 Learning and Growth Perspective .39 Conclusions from Turnover, Sick Leave, Awards, EEO/ER/ADR Data .40 Analysis of Readiness Conclusions .41 Financial Perspective .42 Unit Cost . 43-48 Asset Utilization 49 Conclusions and Recommendations .50 Conclusions from FY02 ASA. . 51-52 Recommendations 53 2
Table of Contents Appendices Page 2-3 of your ASA Template Customer satisfaction graphs Block diagram Process maps Learning and Growth graphs Analysis of Readiness Information 3
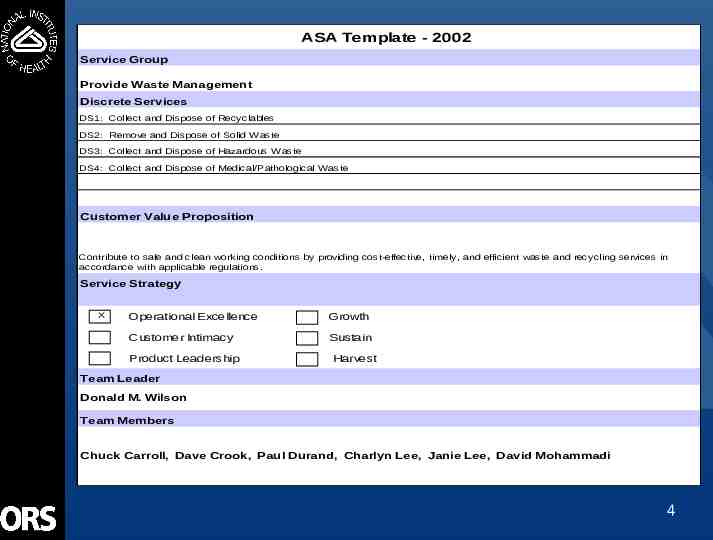
ASA Template - 2002 Service Group Provide Waste Management Discrete Services DS1: Collect and Dispose of Recyclables DS2: Remove and Dispose of Solid Waste DS3: Collect and Dispose of Hazardous Waste DS4: Collect and Dispose of Medical/Pathological Waste Customer Value Proposition Contribute to safe and clean working conditions by providing cost-effective, timely, and efficient waste and recycling services in accordance with applicable regulations. Service Strategy X Operational Excellence Growth Customer Intimacy Sustain Product Leadership Harvest Team Leader Donald M. Wilson Team Members Chuck Carroll, Dave Crook, Paul Durand, Charlyn Lee, Janie Lee, David Mohammadi 4
Customer Perspective 5
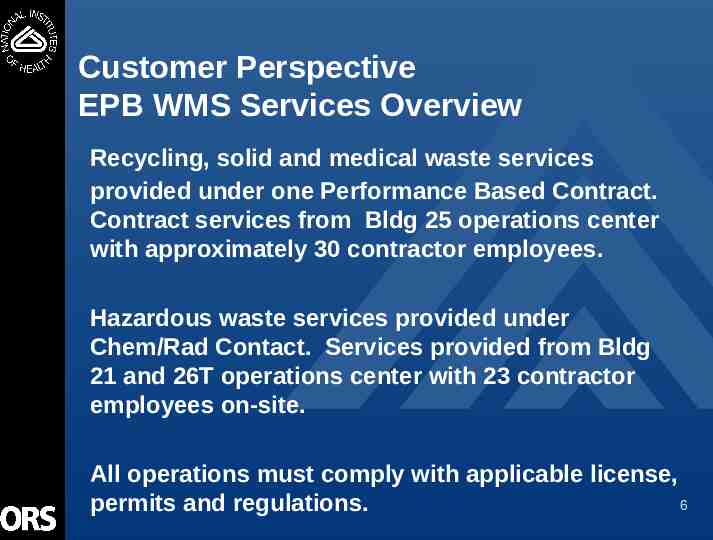
Customer Perspective EPB WMS Services Overview Recycling, solid and medical waste services provided under one Performance Based Contract. Contract services from Bldg 25 operations center with approximately 30 contractor employees. Hazardous waste services provided under Chem/Rad Contact. Services provided from Bldg 21 and 26T operations center with 23 contractor employees on-site. All operations must comply with applicable license, 6 permits and regulations.
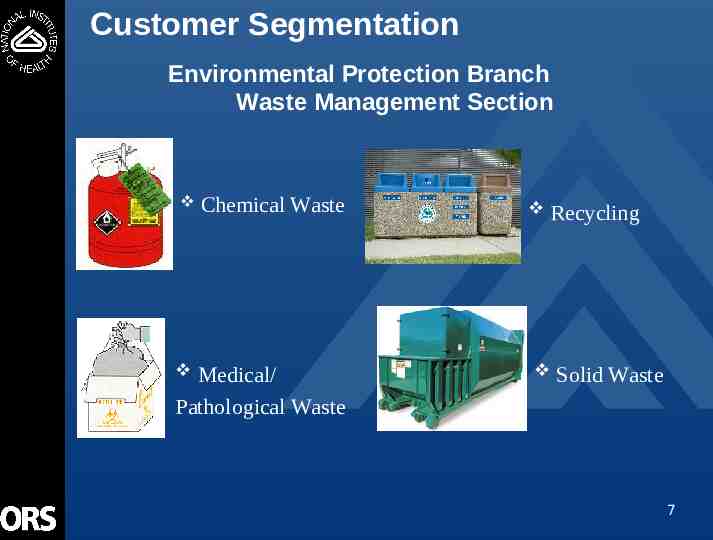
Customer Segmentation Environmental Protection Branch Waste Management Section Chemical Waste Medical/ Pathological Waste Recycling Solid Waste 7
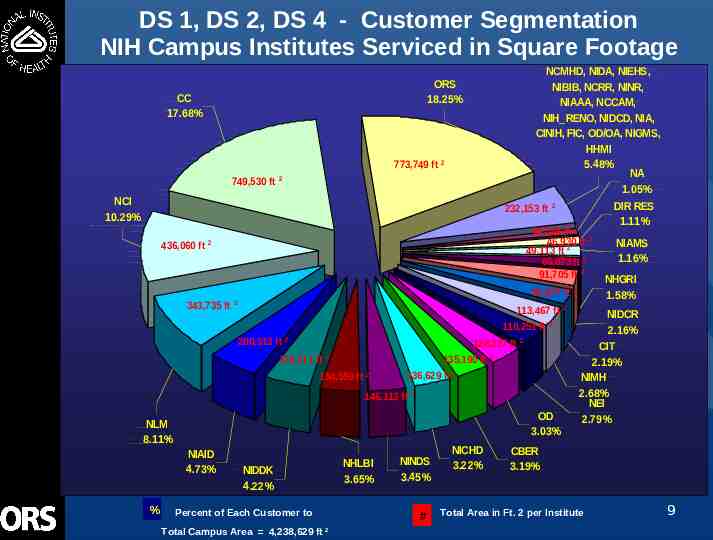
Customer Segmentation – DS1,2,4 Customer Segmentation Charts are same for Discrete Services 1 (Recycling), 2 (Solid Waste), and 4 (Medical Waste). These 3 services are performed by collecting waste or recyclables from either loading docks, cold boxes,or containers in corridors or at outside locations. Segmentation based on assigned Institute square footage within on-site buildings. Largest Customers: ORS (18%), CC (17%), NCI (10%), NLM (8%) 8
DS 1, DS 2, DS 4 - Customer Segmentation NIH Campus Institutes Serviced in Square Footage NCMHD, NIDA,NIEHS, NIEHS, NCMHD, NIDA, NIBIB, NCRR,NINR, NINR, NIBIB, NCRR, NIAAA, NCCAM, NIAAA, NCCAM, NIH RENO, NIDCD, NIH RENO, NIDCD, NIA, NIA, CINIH, FIC,CINIH, OD/OA,FIC, NIGMS, OD/OA, HHMI NIGMS, HHMI 5.48% 5.48% NANA 1.05% 1.05% DIR RES 2 DIR RES 232,153ftft2 232,153 1.11% 1.11% 2 2 ORS ORS 18.25% 18.25% CCCC 17.68% 17.68% 773,749 ft 22 2 749,530 ft ft 749,530 2 NCINCI 10.29% 10.29% 436,060 ft 2ft 436,060 44,344ftft 44,344 46,930 46,930 ftft2 2 49,113 ft ft 22 49,113 66,873ft ft2 2 66,873 91,705ftft2 2 91,705 2 92,977ftft2 92,977 343,735 ft 2ft 343,735 2 113,467ftft2 2 113,467 118,251ftft2 2 118,251 2 2 200,313 ft ft 200,313 128,227ftft22 128,227 178,711 178,711ftft2 135,190 ftft 22 135,190 2 154,559ftft2 2 154,559 136,629 ft 2 146,113 ftft 22 146,113 OD OD 3.03% 3.03% NLM NLM 8.11% 8.11% NIAID NIAID 4.73% 4.73% % NIDDK NIDDK 4.22% 4.22% Percent of Each Customer to Total Campus Area 4,238,629 ft 2 NHLBI NHLBI 3.65% 3.65% NINDS NINDS 3.45% 3.45% # NICHD NICHD 3.22% 3.22% 2 NIAMS NIAMS 1.16% 1.16% NHGRI NHGRI 1.58% 1.58% NIDCR NIDCR 2.16% 2.16% CIT CIT 2.19% 2.19% NIMH NIMH 2.68% 2.68% NEI NEI 2.79% 2.79% CBER CBER 3.19% 3.19% Total Area in Ft. 2 per Institute 9
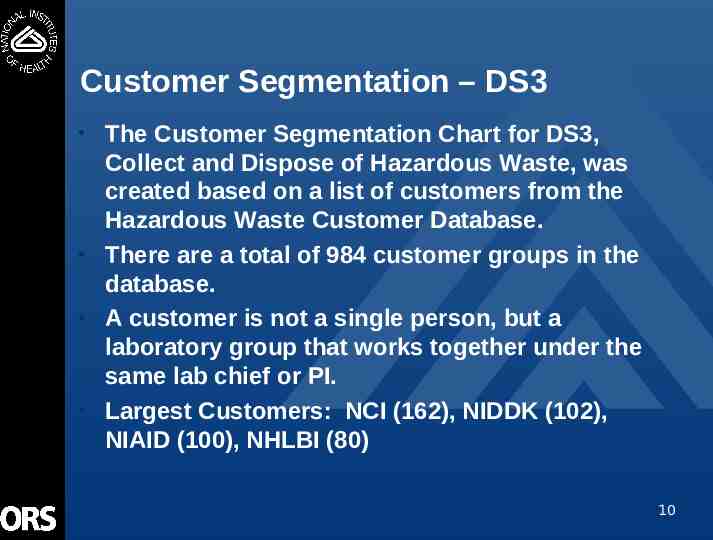
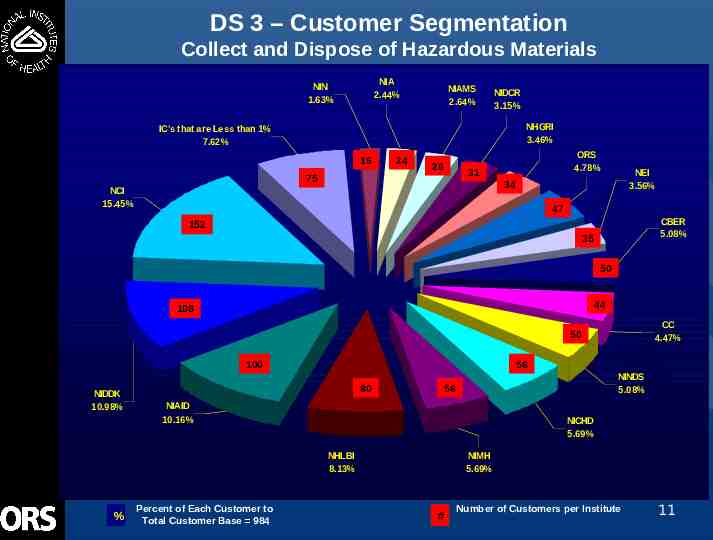
Customer Segmentation – DS3 The Customer Segmentation Chart for DS3, Collect and Dispose of Hazardous Waste, was created based on a list of customers from the Hazardous Waste Customer Database. There are a total of 984 customer groups in the database. A customer is not a single person, but a laboratory group that works together under the same lab chief or PI. Largest Customers: NCI (162), NIDDK (102), NIAID (100), NHLBI (80) 10
DS 3 – Customer Segmentation Collect and Dispose of Hazardous Materials NIA 2.44% NIN 1.63% NIAMS 2.64% NIDCR 3.15% NHGRI 3.46% IC's that are Less than 1% 7.62% 16 24 26 ORS 4.78% 31 75 NEI 3.56% 34 NCI 15.45% 47 CBER 5.08% 152 35 50 44 108 CC 4.47% 50 100 NIDDK 10.98% 56 80 NIAID 10.16% NICHD 5.69% NHLBI 8.13% % NINDS 5.08% 56 Percent of Each Customer to Total Customer Base 984 NIMH 5.69% # Number of Customers per Institute 11
FY02 ORS Customer Scorecard Data for the Annual Self Assessments Service Group 18: Provide Waste Management DS3 - Collect and Dispose of Hazardous Waste 16 October 2002 Summary Prepared by the Office of Quality Management (OQM) 12
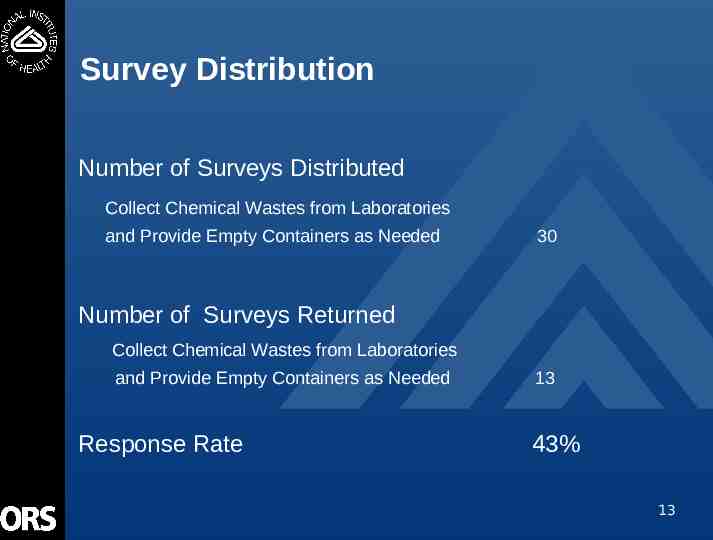
Survey Distribution Number of Surveys Distributed Collect Chemical Wastes from Laboratories and Provide Empty Containers as Needed 30 Number of Surveys Returned Collect Chemical Wastes from Laboratories and Provide Empty Containers as Needed Response Rate 13 43% 13
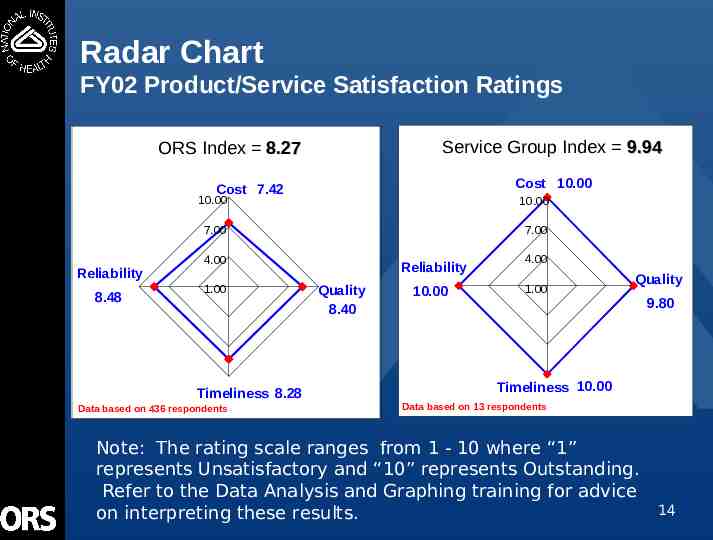
Radar Chart FY02 Product/Service Satisfaction Ratings Service Group Index 9.94 ORS Index 8.27 Cost 10.00 Cost 7.42 Reliability 8.48 10.00 10.00 7.00 7.00 4.00 1.00 Timeliness 8.28 Data based on 436 respondents Reliability Quality 8.40 10.00 4.00 1.00 Quality 9.80 Timeliness 10.00 Data based on 13 respondents Note: The rating scale ranges from 1 - 10 where “1” represents Unsatisfactory and “10” represents Outstanding. Refer to the Data Analysis and Graphing training for advice on interpreting these results. 14
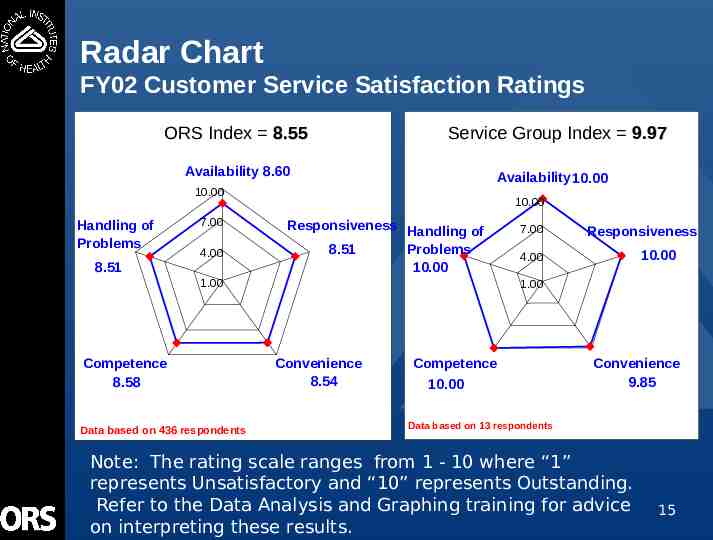
Radar Chart FY02 Customer Service Satisfaction Ratings ORS Index 8.55 Service Group Index 9.97 Availability 8.60 Availability 10.00 10.00 Handling of Problems 8.51 7.00 4.00 10.00 Responsiveness Handling of 8.51 Problems 10.00 1.00 Competence 8.58 Data based on 436 respondents 7.00 Responsiveness 10.00 4.00 1.00 Convenience 8.54 Competence 10.00 Convenience 9.85 Data based on 13 respondents Note: The rating scale ranges from 1 - 10 where “1” represents Unsatisfactory and “10” represents Outstanding. Refer to the Data Analysis and Graphing training for advice on interpreting these results. 15
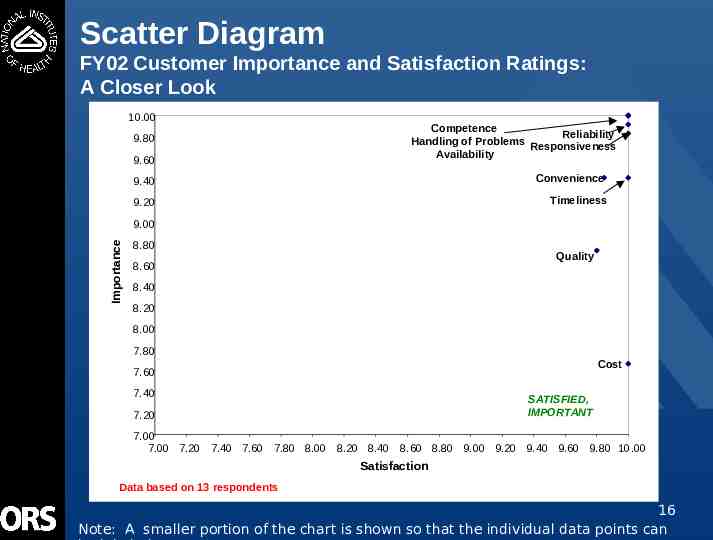
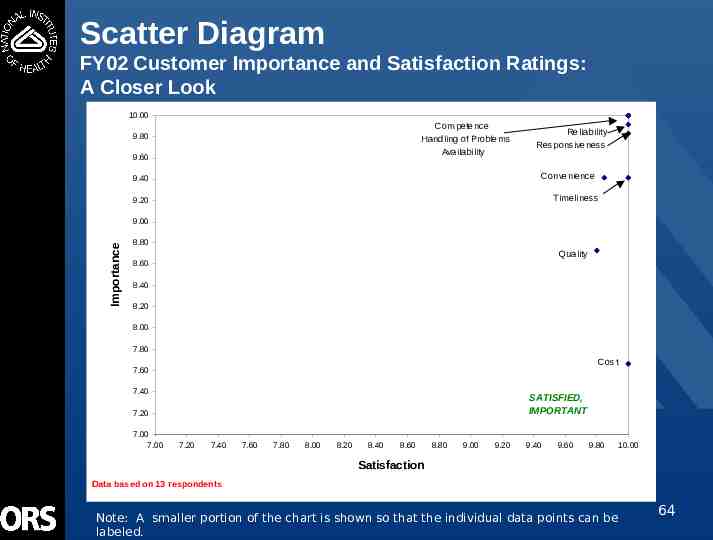
Scatter Diagram FY02 Customer Importance and Satisfaction Ratings: A Closer Look 10.00 9.80 9.60 Competence Reliability Handling of Problems Responsiveness Availability 9.40 Convenience 9.20 Timeliness Importance 9.00 8.80 Quality 8.60 8.40 8.20 8.00 7.80 Cost 7.60 7.40 SATISFIED, IMPORTANT 7.20 7.00 7.00 7.20 7.40 7.60 7.80 8.00 8.20 8.40 8.60 8.80 9.00 9.20 9.40 9.60 9.80 10.00 Satisfaction Data based on 13 respondents 16 Note: A smaller portion of the chart is shown so that the individual data points can
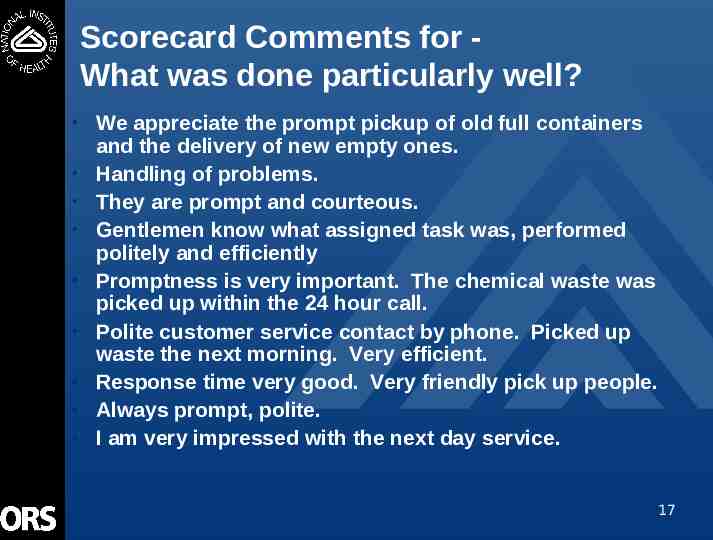
Scorecard Comments for What was done particularly well? We appreciate the prompt pickup of old full containers and the delivery of new empty ones. Handling of problems. They are prompt and courteous. Gentlemen know what assigned task was, performed politely and efficiently Promptness is very important. The chemical waste was picked up within the 24 hour call. Polite customer service contact by phone. Picked up waste the next morning. Very efficient. Response time very good. Very friendly pick up people. Always prompt, polite. I am very impressed with the next day service. 17
Scorecard Comments for – What needs to be improved? We have never had a problem. Nothing. 18
Feedback to Scorecard Responders Provide email back to all responders. Email thanks them for participating and gives a summary of the results of the surveys. The email expresses our commitment to providing the highest quality of service and continuing to support the NIH mission of biomedical research. 19
Internal Business Process Perspective 20
Block Diagram of Service Group: Provide Waste Management Recyclables Collection and Disposal Solid Waste Collection and Disposal Hazardous Waste Collection and Disposal Medical Pathological Waste Collection and Disposal 21
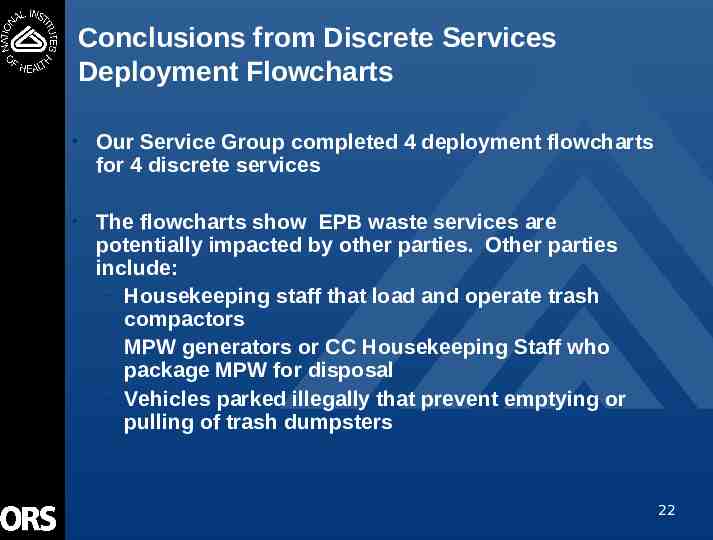
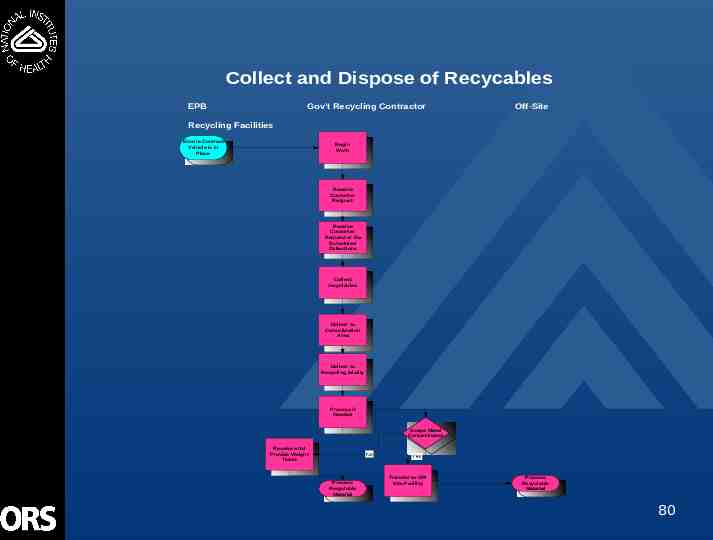
Conclusions from Discrete Services Deployment Flowcharts Our Service Group completed 4 deployment flowcharts for 4 discrete services The flowcharts show EPB waste services are potentially impacted by other parties. Other parties include: - Housekeeping staff that load and operate trash compactors - MPW generators or CC Housekeeping Staff who package MPW for disposal - Vehicles parked illegally that prevent emptying or pulling of trash dumpsters 22
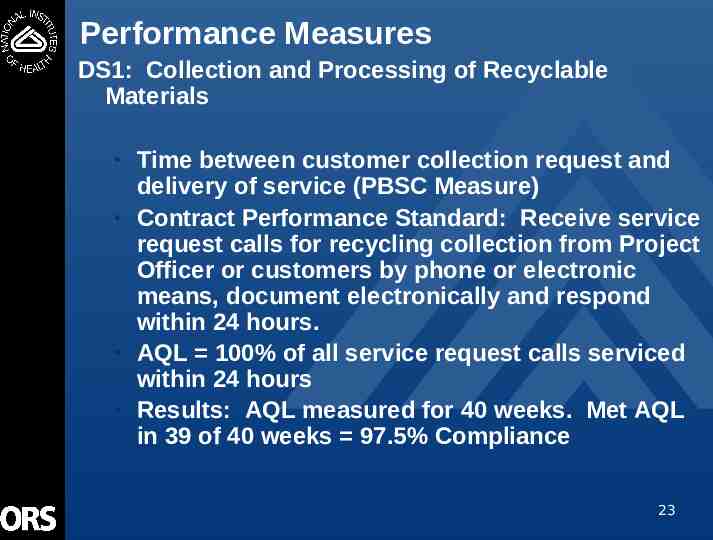
Performance Measures DS1: Collection and Processing of Recyclable Materials Time between customer collection request and delivery of service (PBSC Measure) Contract Performance Standard: Receive service request calls for recycling collection from Project Officer or customers by phone or electronic means, document electronically and respond within 24 hours. AQL 100% of all service request calls serviced within 24 hours Results: AQL measured for 40 weeks. Met AQL in 39 of 40 weeks 97.5% Compliance 23
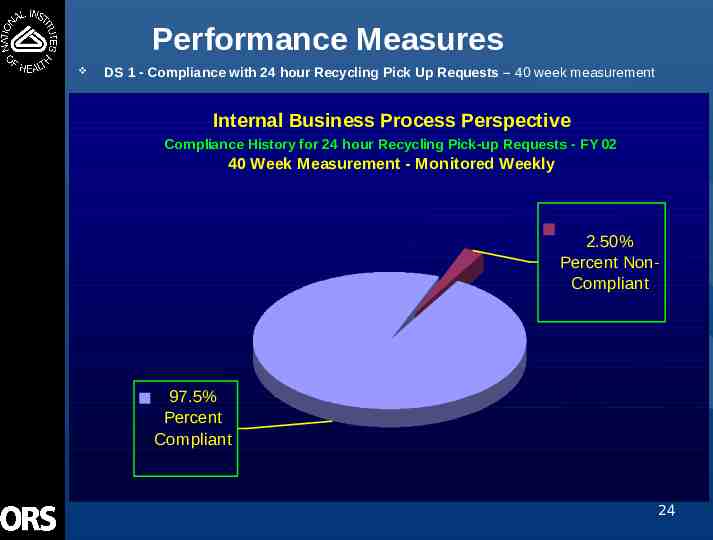
Performance Measures DS 1 - Compliance with 24 hour Recycling Pick Up Requests – 40 week measurement Internal Business Process Perspective Compliance History for 24 hour Recycling Pick-up Requests - FY 02 40 Week Measurement - Monitored Weekly 2.50% Percent NonCompliant 97.5% Percent Compliant 24
Performance Measures DS1: Collection and Processing of Recyclable Materials Timeliness and effectiveness of recyclable collections (PBSC Measure) Contract Performance Standard: Timely and efficient collection of recyclable materials from interior and exterior containers and liners replaced as required in the SOW AQL No more than 10% of a representative sample of all containers in use greater than 50% full as measured within 4 hours of scheduled service. Results: AQL measured for 40 weeks. Met AQL in 40 of 40 weeks 100% Compliance 25
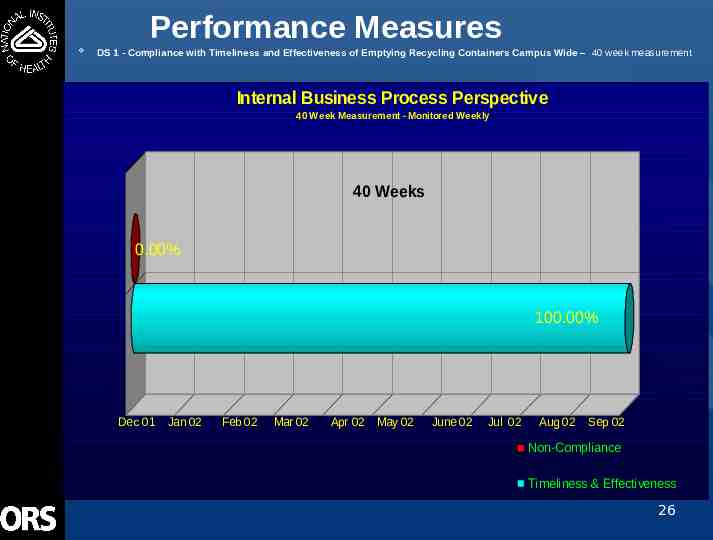
Performance Measures DS 1 - Compliance with Timeliness and Effectiveness of Emptying Recycling Containers Campus Wide – 40 week measurement Internal Business Process Perspective 40 Week Measurement - Monitored Weekly 40 Weeks 0.00% 100.00% Dec 01 Jan 02 Feb 02 Mar 02 Apr 02 May 02 June 02 Jul 02 Aug 02 Sep 02 Non-Compliance Timeliness & Effectiveness 26
Performance Measures DS2: Collection and Disposal of Solid Waste Timely and effective emptying of exterior trash dumpsters to prevent overfilling and loading dock backups (PBSC Measure) Contract Performance Standard: Empty containers on schedules that allows continuous loading from the dock. AQL No more than 10% of containers full and unable to receive additional trash on main campus during core hours. Results: AQL measured for 40 weeks. Met AQL in 40 of 40 weeks 100% Compliance 27
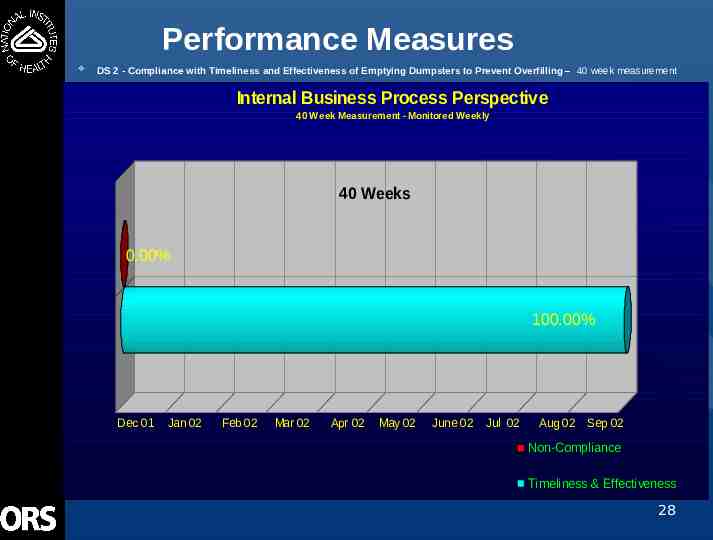
Performance Measures DS 2 - Compliance with Timeliness and Effectiveness of Emptying Dumpsters to Prevent Overfilling – 40 week measurement Internal Business Process Perspective 40 Week Measurement - Monitored Weekly 40 Weeks 0.00% 100.00% Dec 01 Jan 02 Feb 02 Mar 02 Apr 02 May 02 June 02 Jul 02 Aug 02 Sep 02 Non-Compliance Timeliness & Effectiveness 28
Performance Measures DS2: Collection and Disposal of Solid Waste Effectiveness of waste reduction efforts accomplished through the recycling program The effectiveness was determined by taking the amounts recycled divided by amounts of solid waste plus amounts recycled. This provides a percentage of solid waste reduction achieved through recycling. Results: Achieve an average recycling rate of 25% for FY2002 29
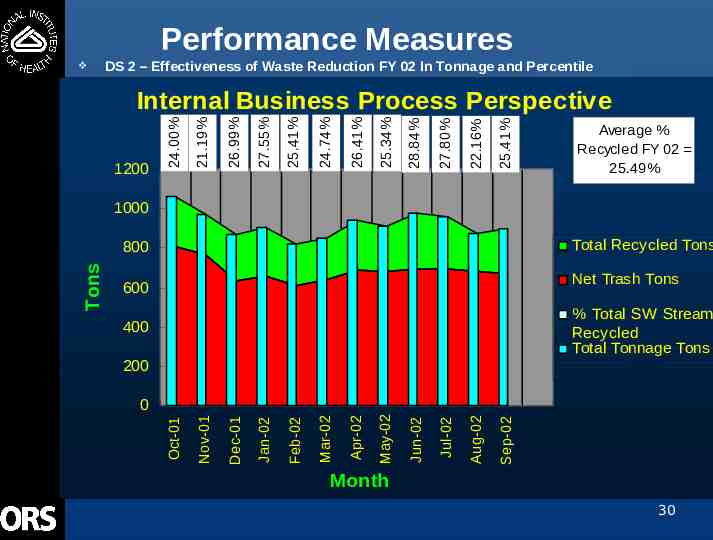
Performance Measures DS 2 – Effectiveness of Waste Reduction FY 02 In Tonnage and Percentile 25.41% 22.16% 27.80% 28.84% 25.34% 26.41% 24.74% 25.41% 27.55% 26.99% 21.19% 1200 24.00% Internal Business Process Perspective Average % Recycled FY 02 25.49% 1000 Total Recycled Tons Net Trash Tons 600 % Total SW Stream Recycled Total Tonnage Tons 400 200 Sep-02 Aug-02 Jul-02 Jun-02 May-02 Apr-02 Mar-02 Feb-02 Jan-02 Dec-01 Nov-01 0 Oct-01 Tons 800 Month 30
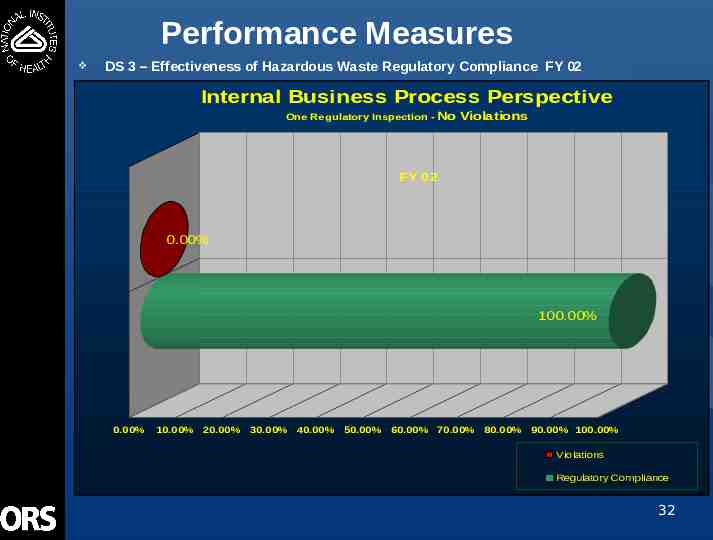
Performance Measures DS3: Collection and Disposal of Hazardous Waste Effectiveness of hazardous waste regulatory compliance as measured by regulatory violations The effectiveness was determined by evaluating the results of all regulatory inspections performed during FY02. One 2-day regulatory inspection was performed by the Maryland Department of the Environment. Results: No regulatory violations were discovered as a result of this inspection 100% compliance 31
Performance Measures DS 3 – Effectiveness of Hazardous Waste Regulatory Compliance FY 02 Internal Business Process Perspective One Regulatory Inspection - No Violations FY 02 0.00% 100.00% 0.00% 10.00% 20.00% 30.00% 40.00% 50.00% 60.00% 70.00% 80.00% 90.00% 100.00% Violations Regulatory Compliance 32
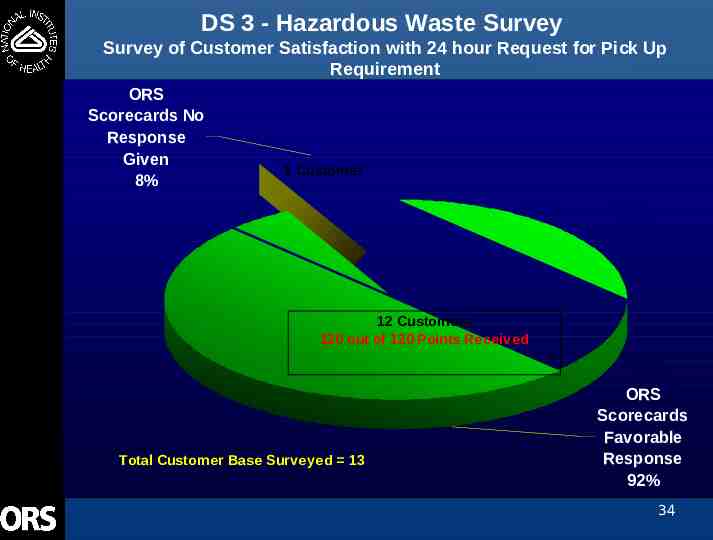
Performance Measures DS3: Collection and Disposal of Hazardous Waste Time between customer collection request and delivery of service The effectiveness was determined by using the ORS Customer Scorecard. We added an extra question on the Scorecard to measure whether the customers felt that contract requirement for providing waste collection services within 24 hours of request was being met. Results: Of the 12 responders that answered the question, all 12 gave a perfect score of 10 100% compliance 33
DS 3 - Hazardous Waste Survey Survey of Customer Satisfaction with 24 hour Request for Pick Up Requirement ORS Scorecards No Response Given 8% 1 Customer 12 Customers 120 out of 120 Points Received Total Customer Base Surveyed 13 ORS Scorecards Favorable Response 92% 34
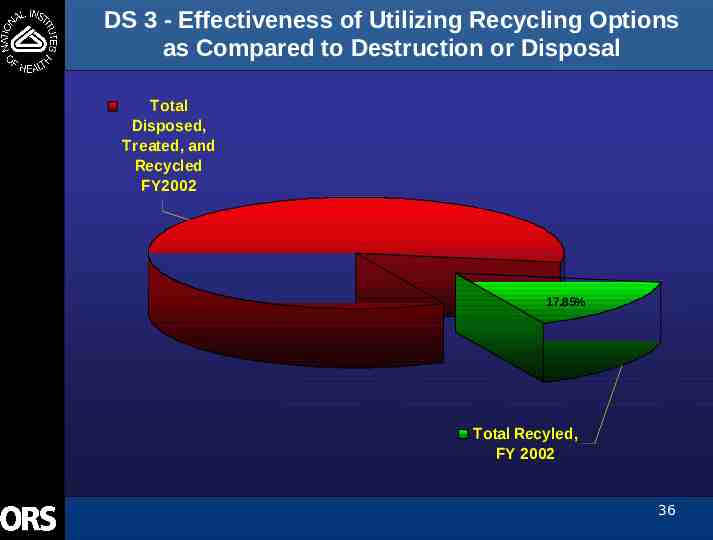
Performance Measures DS3: Collection and Disposal of Hazardous Waste Effectiveness of using recycling options as compared to destruction or disposal The effectiveness was determined by calculating the total weight of hazardous waste recovered for reuse divided by the the total weight disposed plus weight recovered for reuse. This provides a percentage of hazardous waste that was effectively recovered for reuse. Results: Achieve an average recycling rate of 18% for FY2002. This is a very good recycling rate due to the light weight of many recyclable waste streams. 35
DS 3 - Effectiveness of Utilizing Recycling Options as Compared to Destruction or Disposal Total Disposed, Treated, and Recycled FY2002 17.85% Total Recyled, FY 2002 36
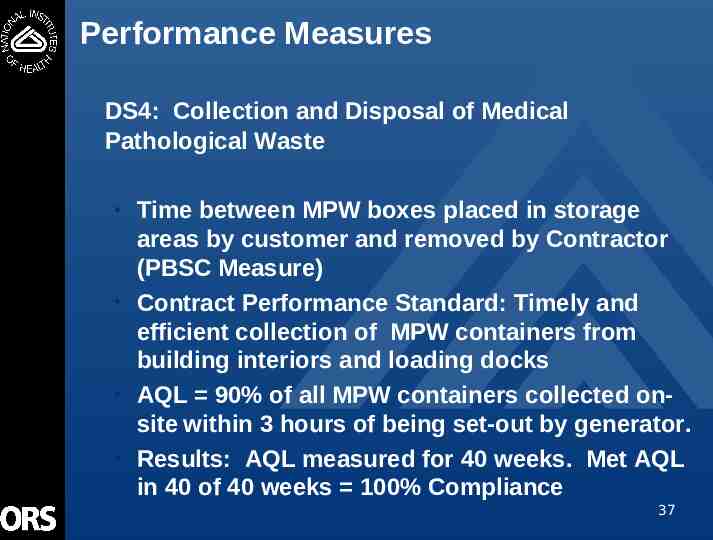
Performance Measures DS4: Collection and Disposal of Medical Pathological Waste Time between MPW boxes placed in storage areas by customer and removed by Contractor (PBSC Measure) Contract Performance Standard: Timely and efficient collection of MPW containers from building interiors and loading docks AQL 90% of all MPW containers collected onsite within 3 hours of being set-out by generator. Results: AQL measured for 40 weeks. Met AQL in 40 of 40 weeks 100% Compliance 37
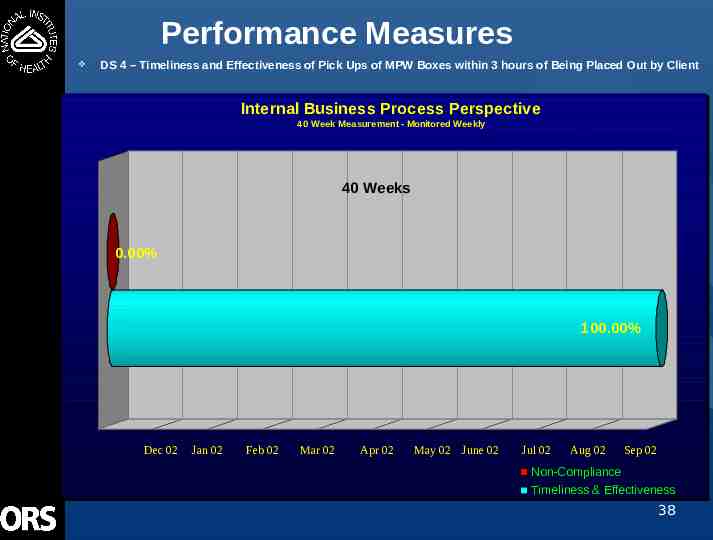
Performance Measures DS 4 – Timeliness and Effectiveness of Pick Ups of MPW Boxes within 3 hours of Being Placed Out by Client Internal Business Process Perspective 40 Week Measurement - Monitored Weekly 40 Weeks 40 Weeks 0.00% 100.00% Dec 02 Jan 02 Feb 02 Mar 02 Apr 02 May 02 June 02 Jul 02 Aug 02 Sep 02 Non-Compliance Timeliness & Effectiveness 38
FY02 Learning and Growth (L&G) Data for the Annual Self Assessments Service Group 18: Provide Waste Management 26 September 2002 Summary Prepared by the Office of Quality Management 39
Conclusions from Turnover, Sick Leave, Awards, EEO/ER/ADR Data No significant conclusions can be drawn from the data 40
Analysis of Readiness Conclusions One employee to staff proposed Twinbrook Research Complex, scheduled to open 2004. Additional human resources for service demands created by completion and occupancy of new CRC , Twinbrook Research Campus, and new NRC Building. 41
Financial Perspective 42
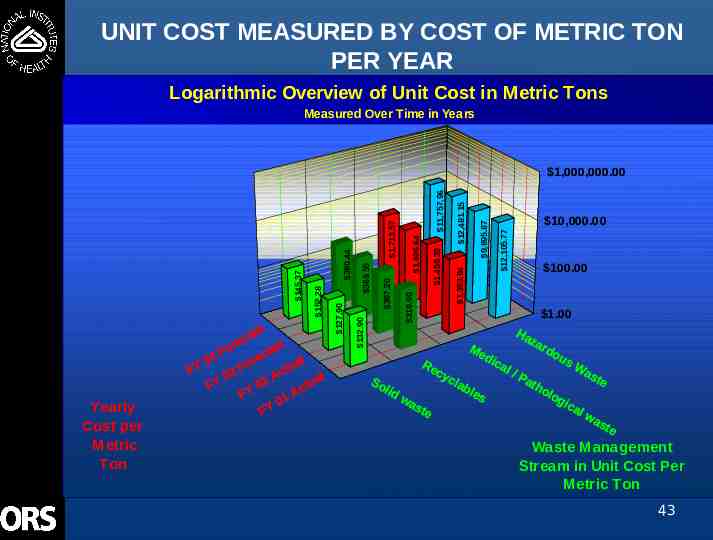
UNIT COST MEASURED BY COST OF METRIC TON PER YEAR Logarithmic Overview of Unit Cost in Metric Tons Measured Over Time in Years Yearly Cost per Metric Ton 10,000.00 12,105.77 9,895.87 12,481.15 1,353.94 11,757.96 1,459.39 1,606.64 319.90 1,713.57 397.20 380.44 369.55 132.90 127.90 152.28 145.37 1,000,000.00 100.00 1.00 Waste Management Stream in Unit Cost Per Metric Ton 43
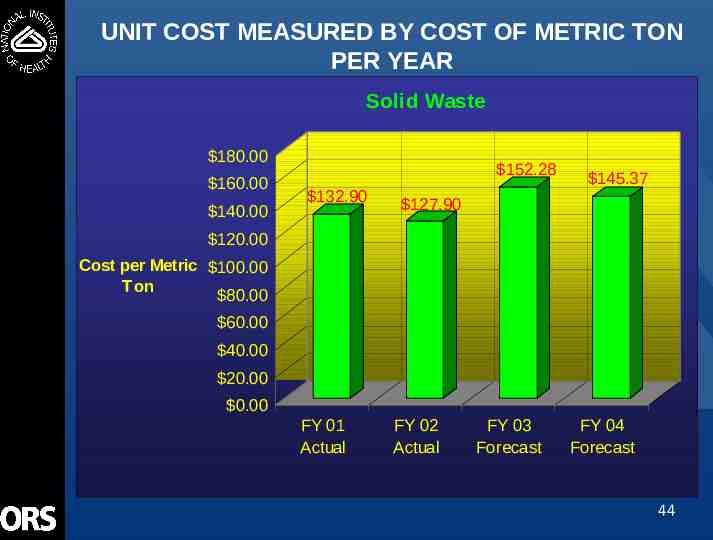
UNIT COST MEASURED BY COST OF METRIC TON PER YEAR Solid Waste 180.00 160.00 140.00 152.28 132.90 145.37 127.90 120.00 Cost per Metric 100.00 Ton 80.00 60.00 40.00 20.00 0.00 FY 01 Actual FY 02 Actual FY 03 Forecast FY 04 Forecast 44
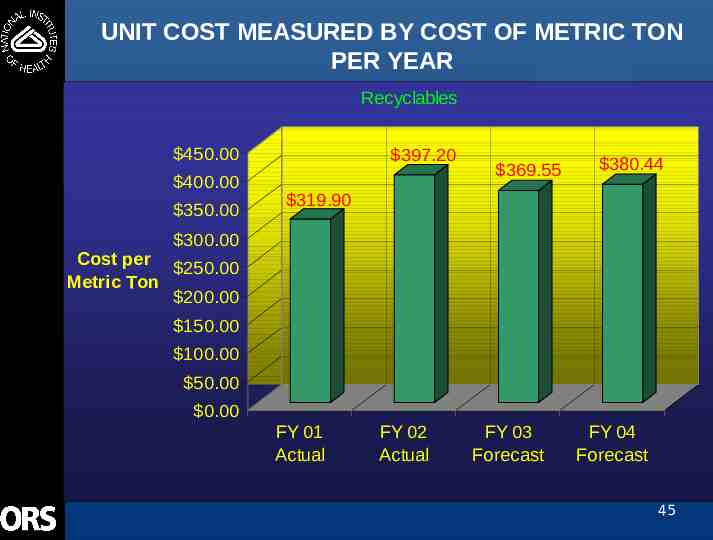
UNIT COST MEASURED BY COST OF METRIC TON PER YEAR Recyclables 450.00 400.00 350.00 397.20 369.55 380.44 319.90 300.00 Cost per 250.00 Metric Ton 200.00 150.00 100.00 50.00 0.00 FY 01 Actual FY 02 Actual FY 03 Forecast FY 04 Forecast 45
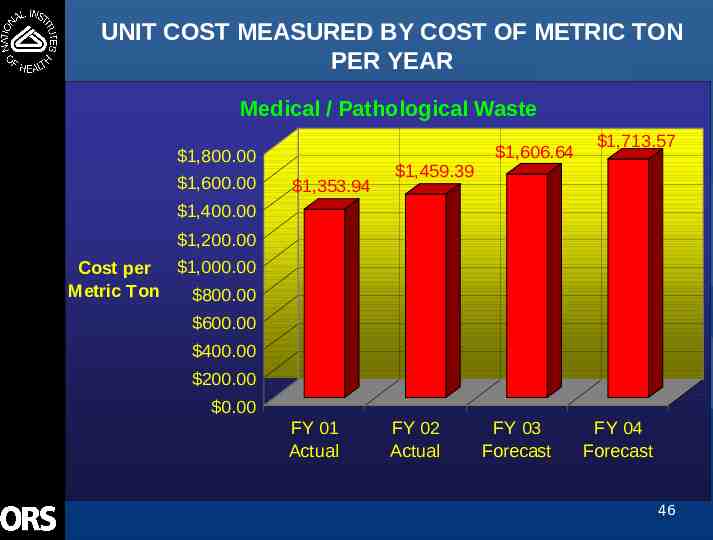
UNIT COST MEASURED BY COST OF METRIC TON PER YEAR Medical / Pathological Waste 1,800.00 1,600.00 1,353.94 1,459.39 1,606.64 1,713.57 1,400.00 1,200.00 Cost per 1,000.00 Metric Ton 800.00 600.00 400.00 200.00 0.00 FY 01 Actual FY 02 Actual FY 03 Forecast FY 04 Forecast 46
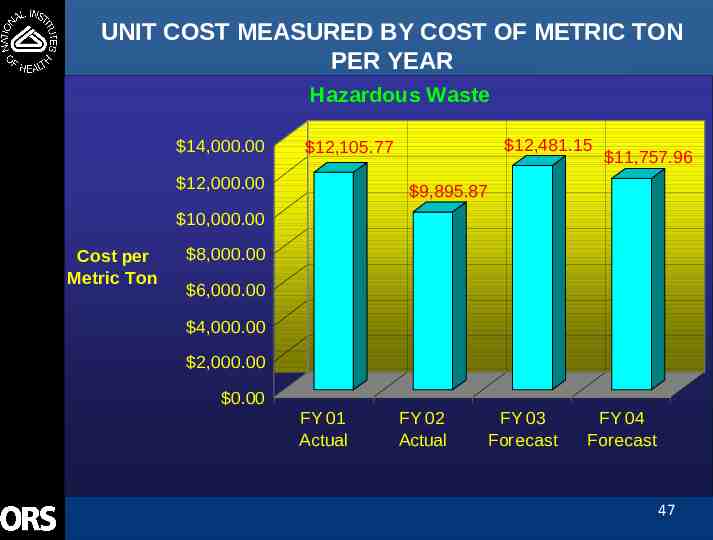
UNIT COST MEASURED BY COST OF METRIC TON PER YEAR Hazardous Waste 14,000.00 12,481.15 12,105.77 12,000.00 11,757.96 9,895.87 10,000.00 Cost per Metric Ton 8,000.00 6,000.00 4,000.00 2,000.00 0.00 FY 01 Actual FY 02 Actual FY 03 Forecast FY 04 Forecast 47
Unit Cost Measure Conclusions EPB provides top quality waste services to the NIH without significant costs increases from year to year 48
Asset Utilization Measures EPB staff are assigned to manage the recycling services and hazardous, medical, and solid waste services. High amount of direct staff involvement required due to complex technical and regulatory nature of work. Work writing permits, reviewing regulatory shipping documents, new building plans impacting our services, and Contractor prepared regulatory reports. Because the staff does not perform repetitive quantifiable tasks, an asset utilization measure of EPB human resources was not practical. 49
Conclusions and Recommendations 50
Conclusions from FY02 ASA Major findings from the FY02 ASA ORS Scorecard showed customer satisfaction at an extremely high level 51
Conclusions from FY02 ASA Other Comments Concerning ASA Process WMS expended approximately 480 total manhours Too much specialized training required ASA demands reduced staff ability to provide services at highest level ASA process needs streamlining to allow standardized inputs from Service Groups after which final report is self-generated 52
Recommendations Award a new 5 year Chemical and Radioactive Waste Contract in FY03 with performance based elements. Work to improve performance in areas identified by process maps Implement customer recommendations from scorecard where possible 53
Appendices 54
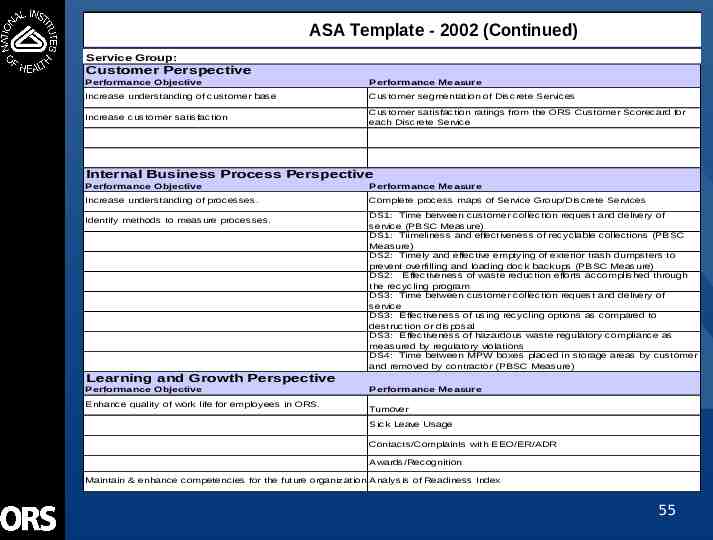
ASA Template - 2002 (Continued) Service Group: Customer Perspective Performance Objective Performance Measure Increase understanding of customer base Customer segmentation of Discrete Services Increase customer satisfaction Customer satisfaction ratings from the ORS Customer Scorecard for each Discrete Service Internal Business Process Perspective Performance Objective Performance Measure Increase understanding of processes. Complete process maps of Service Group/Discrete Services Identify methods to measure processes. DS1: Time between customer collection request and delivery of service (PBSC Measure) DS1: Tiimeliness and effectiveness of recyclable collections (PBSC Measure) DS2: Timely and effective emptying of exterior trash dumpsters to prevent overfilling and loading dock backups (PBSC Measure) DS2: Effectiveness of waste reduction efforts accomplished through the recycling program DS3: Time between customer collection request and delivery of service DS3: Effectiveness of using recycling options as compared to destruction or disposal DS3: Effectiveness of hazardous waste regulatory compliance as measured by regulatory violations DS4: Time between MPW boxes placed in storage areas by customer and removed by contractor (PBSC Measure) Learning and Growth Perspective Performance Objective Enhance quality of work life for employees in ORS. Performance Measure Turnover Sick Leave Usage Contacts/Complaints with EEO/ER/ADR Awards/Recognition Maintain & enhance competencies for the future organization. Analysis of Readiness Index 55
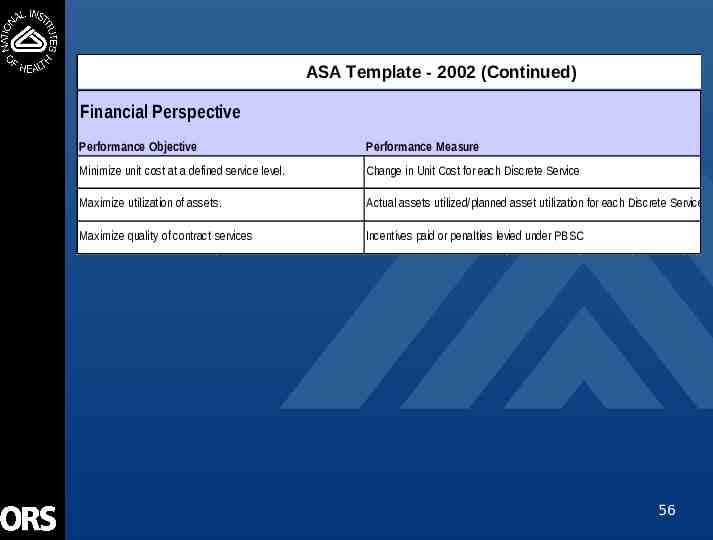
ASA Template - 2002 (Continued) Financial Perspective Performance Objective Performance Measure Minimize unit cost at a defined service level. Change in Unit Cost for each Discrete Service Maximize utilization of assets. Actual assets utilized/planned asset utilization for each Discrete Service Maximize quality of contract services Incentives paid or penalties levied under PBSC 56
FY02 ORS Customer Scorecard Data for the Annual Self Assessments Service Group 18: Provide Waste Management DS3 - Collect and Dispose of Hazardous Waste 16 October 2002 Summary Prepared by the Office of Quality Management (OQM) 57
Survey Distribution Number of Surveys Distributed Collect Chemical Wastes from Laboratories and Provide Empty Containers as Needed 30 Number of Surveys Returned Collect Chemical Wastes from Laboratories and Provide Empty Containers as Needed Response Rate 13 43% 58
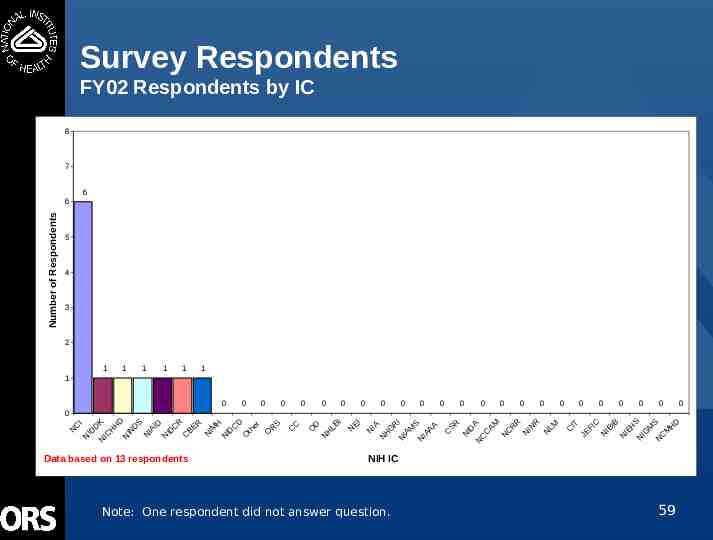
Survey Respondents FY02 Respondents by IC 8 7 6 Number of Respondents 6 5 4 3 2 1 1 1 1 1 1 1 0 0 0 0 0 0 0 0 0 0 0 0 0 0 0 0 0 0 0 0 0 0 0 Data based on 13 respondents C IT JE FI C N IB IB N IE H S N IG M S N C M H D R IN R N LM N R N C N ID N A C C AM SR C G R I N IA M S N IA AA H N IA N I EI N D H LB N O C C DS N IA ID N ID C R C BE R N IM H N ID C D O th er O R S N IN K N IC H I ID D N N C H D 0 NIH IC Note: One respondent did not answer question. 59 0
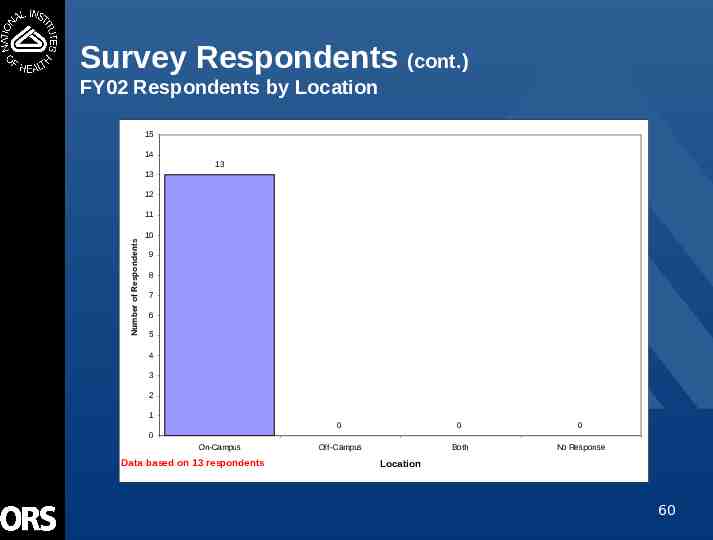
Survey Respondents (cont.) FY02 Respondents by Location 15 14 13 13 12 Number of Respondents 11 10 9 8 7 6 5 4 3 2 1 0 0 0 Off-Campus Both No Response 0 On-Campus Data based on 13 respondents Location 60
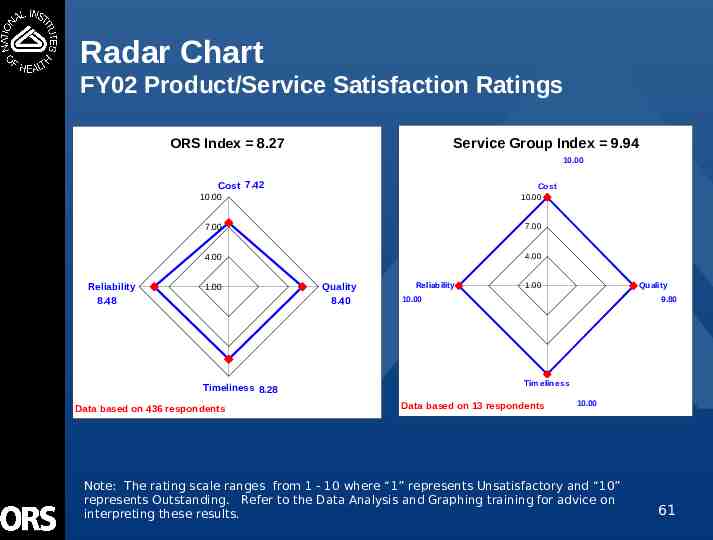
Radar Chart FY02 Product/Service Satisfaction Ratings Service Group Index 9.94 ORS Index 8.27 10.00 Cost 7.42 Cost 10.00 10.00 Reliability 8.48 7.00 7.00 4.00 4.00 1.00 Timeliness 8.28 Data based on 436 respondents Quality 8.40 Reliability 1.00 Quality 10.00 9.80 Tim eliness Data based on 13 respondents 10.00 Note: The rating scale ranges from 1 - 10 where “1” represents Unsatisfactory and “10” represents Outstanding. Refer to the Data Analysis and Graphing training for advice on interpreting these results. 61
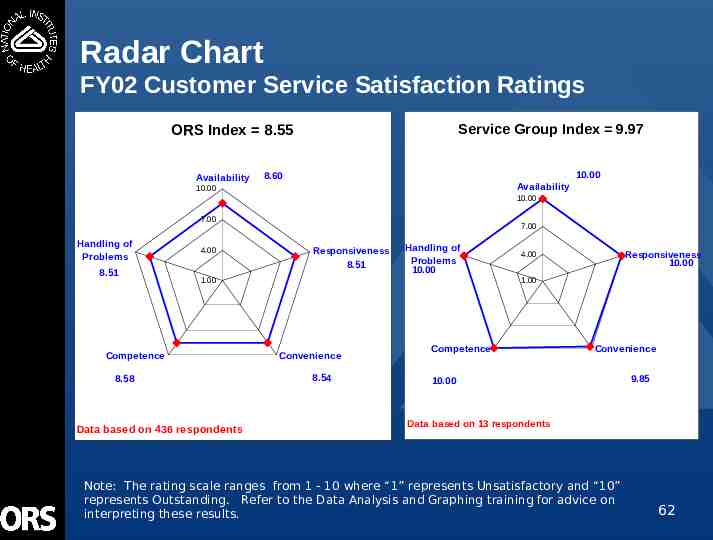
Radar Chart FY02 Customer Service Satisfaction Ratings Service Group Index 9.97 ORS Index 8.55 Availability 10.00 8.60 Availability 10.00 10.00 7.00 Handling of Problems 8.51 4.00 7.00 Responsiveness 8.51 Handling of Problems 10.00 1.00 Competence 8.58 Data based on 436 respondents Responsiveness 10.00 4.00 1.00 Convenience 8.54 Competence Convenience 10.00 9.85 Data based on 13 respondents Note: The rating scale ranges from 1 - 10 where “1” represents Unsatisfactory and “10” represents Outstanding. Refer to the Data Analysis and Graphing training for advice on interpreting these results. 62
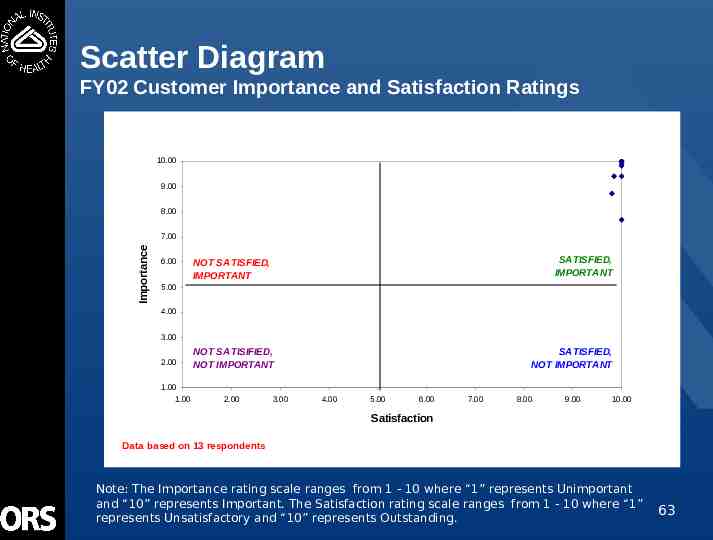
Scatter Diagram FY02 Customer Importance and Satisfaction Ratings 10.00 9.00 8.00 Importance 7.00 6.00 SATISFIED, IMPORTANT NOT SATISFIED, IMPORTANT 5.00 4.00 3.00 2.00 1.00 1.00 NOT SATISIFIED, NOT IMPORTANT 2.00 3.00 SATISFIED, NOT IMPORTANT 4.00 5.00 6.00 7.00 8.00 9.00 10.00 Satisfaction Data based on 13 respondents Note: The Importance rating scale ranges from 1 - 10 where “1” represents Unimportant and “10” represents Important. The Satisfaction rating scale ranges from 1 - 10 where “1” represents Unsatisfactory and “10” represents Outstanding. 63
Scatter Diagram FY02 Customer Importance and Satisfaction Ratings: A Closer Look 10.00 Competence Handling of Problems Availability 9.80 9.60 Reliability Responsiveness Convenience 9.40 Timeliness 9.20 Importance 9.00 8.80 Quality 8.60 8.40 8.20 8.00 7.80 Cost 7.60 7.40 SATISFIED, IMPORTANT 7.20 7.00 7.00 7.20 7.40 7.60 7.80 8.00 8.20 8.40 8.60 8.80 9.00 9.20 9.40 9.60 9.80 10.00 Satisfaction Data based on 13 respondents Note: A smaller portion of the chart is shown so that the individual data points can be labeled. 64
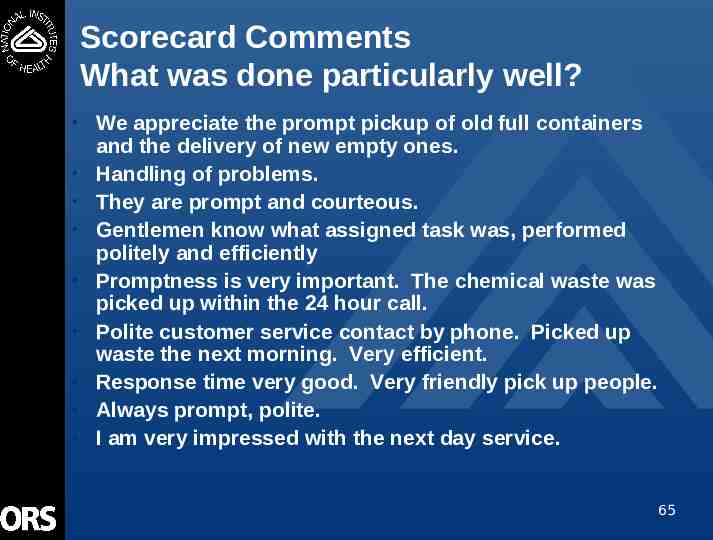
Scorecard Comments What was done particularly well? We appreciate the prompt pickup of old full containers and the delivery of new empty ones. Handling of problems. They are prompt and courteous. Gentlemen know what assigned task was, performed politely and efficiently Promptness is very important. The chemical waste was picked up within the 24 hour call. Polite customer service contact by phone. Picked up waste the next morning. Very efficient. Response time very good. Very friendly pick up people. Always prompt, polite. I am very impressed with the next day service. 65
What needs to be improved? We have never had a problem. Nothing. 66
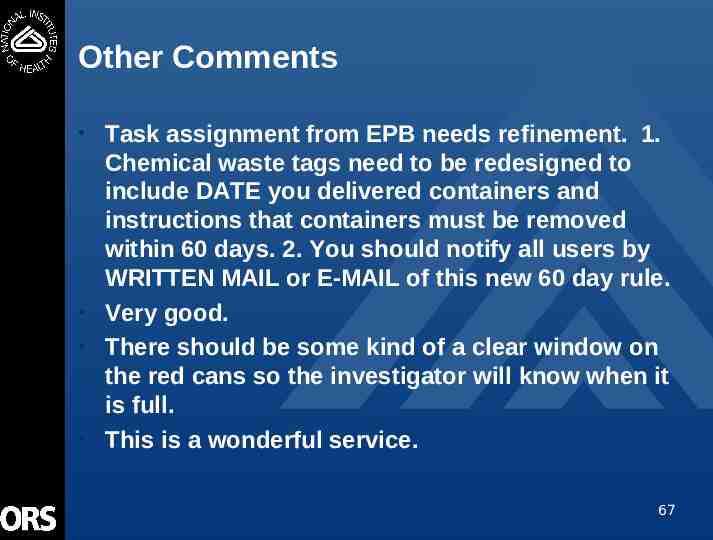
Other Comments Task assignment from EPB needs refinement. 1. Chemical waste tags need to be redesigned to include DATE you delivered containers and instructions that containers must be removed within 60 days. 2. You should notify all users by WRITTEN MAIL or E-MAIL of this new 60 day rule. Very good. There should be some kind of a clear window on the red cans so the investigator will know when it is full. This is a wonderful service. 67
Customer Scorecard Summary Conclusions based on graphs and comments – – Our customers rate the quality of this service very highly This service excels in all measured areas Potential actions based on what you have learned from the data – – Revise the Chemical Waste Tag as suggested Provide NIH wide email notification concerning removal of containers within 60 days 68
Summarizing Your Customer Scorecard Data (cont.) Does the customer satisfaction data, when compared to data in other perspectives, show potential relationships? Answer: None that could be observed From reviewing your data, what could be done to improve your customers’ satisfaction? Answer: Very little based on the data. We will consider customer suggestions concerning the Chemical Waste Tag and the collection containers. 69
Feedback to Scorecard Responders Will provide email back to all responders. Email will thank them for participating and give a summary of the results of the surveys. The email will express our commitment to providing the highest quality of service and continuing to support the NIH mission of biomedical research. 70
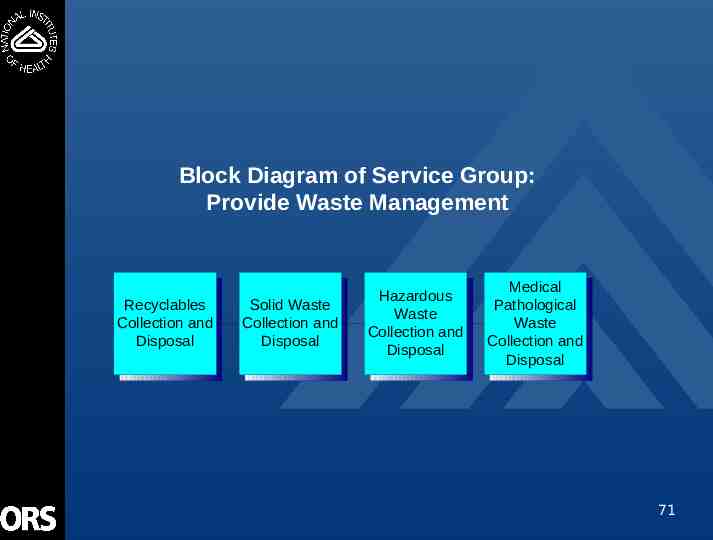
Block Diagram of Service Group: Provide Waste Management Recyclables Collection and Disposal Solid Waste Collection and Disposal Hazardous Waste Collection and Disposal Medical Pathological Waste Collection and Disposal 71
Process Flow Charts 72
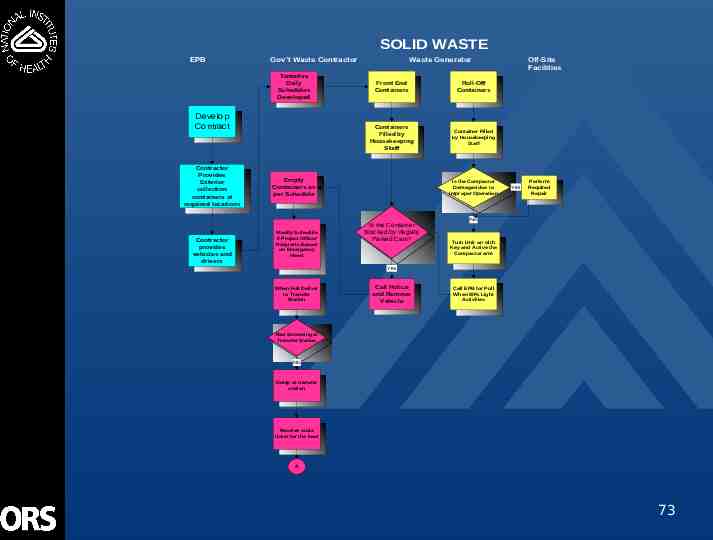
SOLID WASTE EPB Gov’t Waste Contractor Tentative Daily Schedules Developed Develop Contract Contractor Provides Exterior collection containers at required locations Contractor provides vehicles and drivers Waste Generator Front End Containers Roll-Off Containers Containers Filled by Housekeeping Staff Container Filled by Housekeeping Staff Empty Containers as per Schedule Modify Schedule if Project Officer Requests Based on Emergency Need Is the Compactor Damaged due to Improper Operation Is the Container Blocked by Illegally Parked Cars? Off-Site Facilities Yes Perform Required Repair No Turn Unit on with Key and Active the Compactor arm Yes When Full Deliver to Transfer Station Call Police and Remove Vehicle Call EPB for Pull When 80% Light Activities Rad Screening at Transfer Station No Dump at transfer station Receive scale ticket for the load A 73
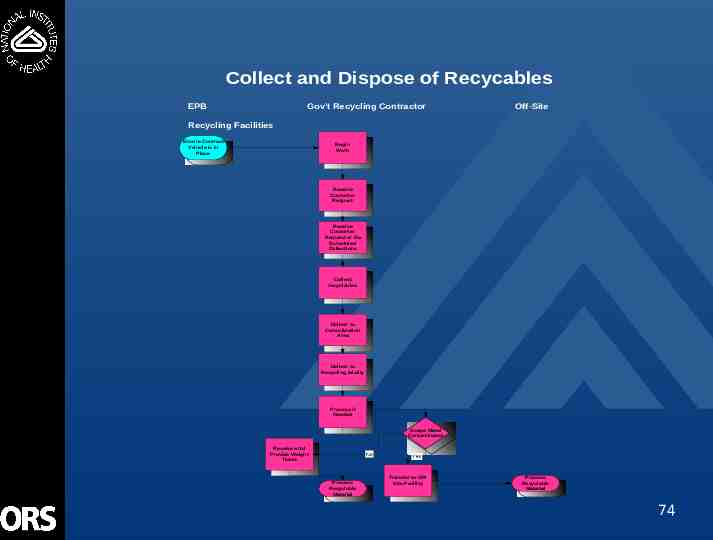
Collect and Dispose of Recycables EPB Gov’t Recycling Contractor Off-Site Recycling Facilities Ensure Contract Vehicle is in Place Begin Work Receive Customer Request Receive Customer Request or Do Scheduled Collections Collect recyclables Deliver to Consolidation Area Deliver to Recycling falciity Process if Needed Scape Metal Contaminated Receive amd Provide Weight Ticket No Process Recyclable Material Yes Transfer to OffSite Facility Process Recyclable Material 74
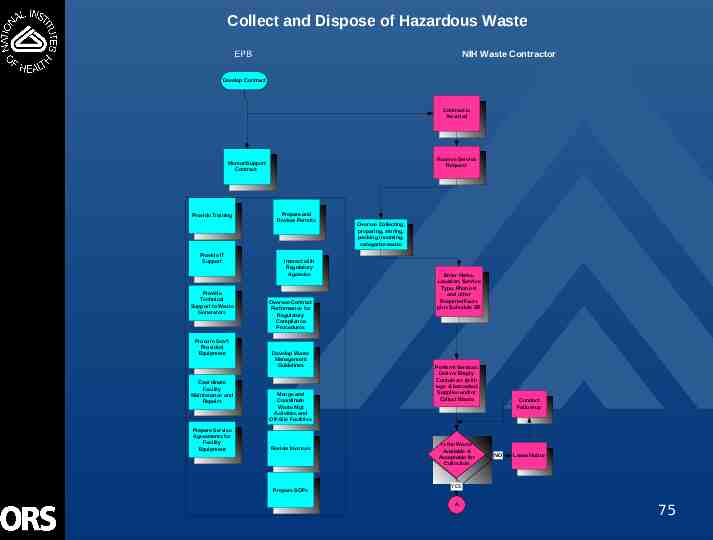
Collect and Dispose of Hazardous Waste EPB NIH Waste Contractor Develop Contract Contract is Awarded Receive Service Request Mentor/Support Contract Provide Training Provide IT Support Provide Technical Support to Waste Generators Procure Gov’t Provided Equipment Coordinate Facility Maintenance and Repairs Prepare Service Agreements for Facility Equipment Prepare and Review Permits Interact with Regulatory Agencies Oversee Contract Performance for Regulatory Compliance Procedures Develop Waste Management Guidelines Mange and Coordinate Waste Mgt Activities and Off-Site Facilities Review Invoices Prepare SOPs Oversee Collecting, preparing, storing, packing incoming, categorize waste Enter Name, Location, Service Type, Phone #, and other Required Facts plus Schedule SR Perform Services Deliver Empty Containers (with tags & barcodes) Supplies and/or Collect Waste Is the Waste Available & Acceptable for Collection Conduct Follow-up NO Leave Notice YES A 75
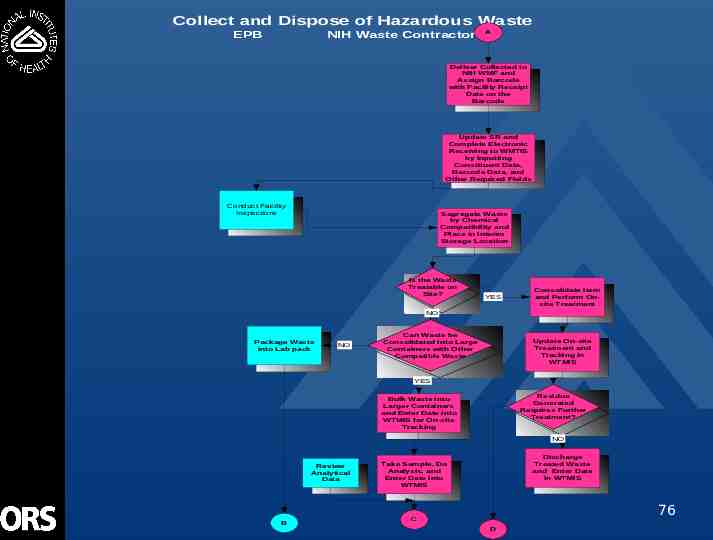
Collect and Dispose of Hazardous Waste EPB NIH Waste Contractor A Deliver Collected to NIH WMF and Assign Barcode with Facility Receipt Date on the Barcode Update SR and Complete Electronic Receiving to WMTIS by Inputting Constituent Data, Barcode Data, and Other Required Fields Conduct Facility Inspections Segregate Waste by Chemical Compatibility and Place in Interim Storage Location Is the Waste Treatable on Site? YES Consolidate Item and Perform Onsite Treatment NO Package Waste into Lab pack NO Can Waste be Consolidated into Large Containers with Other Compatible Waste Update On-site Treatment and Tracking in WTMIS YES Residue Generated Requires Further Treatment? Bulk Waste into Larger Containers and Enter Date into WTMIS for On-site Tracking NO Review Analytical Data B Discharge Treated Waste and Enter Date in WTMIS Take Sample, Do Analysis, and Enter Date into WTMIS 76 C D
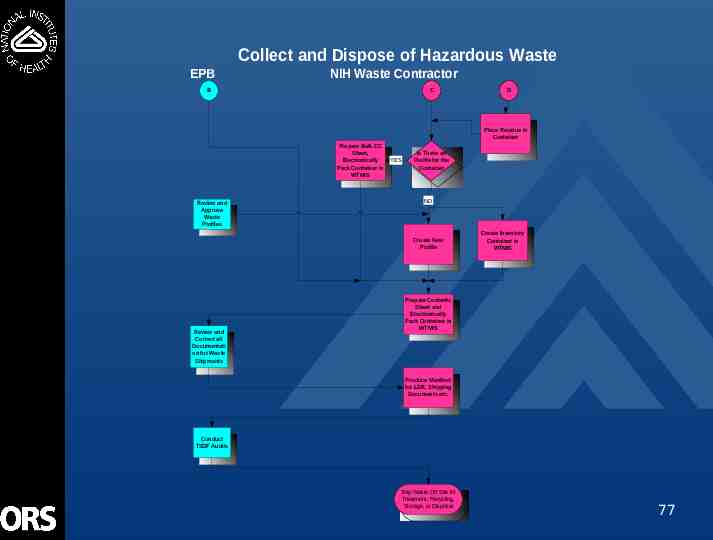
Collect and Dispose of Hazardous Waste EPB NIH Waste Contractor B C D Place Residue in Container Prepare Bulk CC Sheet, Electronically Pack Container in WTMIS Review and Approve Waste Profiles YES Is There an Profile for the Container NO Create New Profile Review and Correct all Documentati on for Waste Shipments Create Inventory Container in WTMIS Prepare Contents Sheet and Electronically Pack Container in WTMIS Produce Manifest for LDR, Shipping Documents etc. Conduct TSDF Audits Ship Waste Off Site for Treatment, Recycling, Storage, or Disposal 77
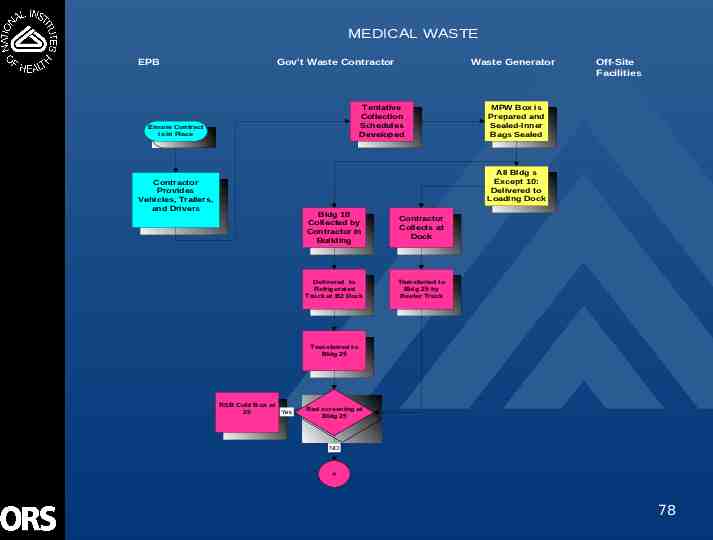
MEDICAL WASTE EPB Gov’t Waste Contractor Waste Generator Tentative Collection Schedules Developed Ensure Contract is in Place Off-Site Facilities MPW Box is Prepared and Sealed-Inner Bags Sealed All Bldg s Except 10: Delivered to Loading Dock Contractor Provides Vehicles, Trailers, and Drivers Bldg 10 Collected by Contractor in Building Contractor Collects at Dock Delivered to Refrigerated Truck at B2 Dock Transferred to Bldg 25 by Reefer Truck Transferred to Bldg 25 RSB Cold Box at 25 Yes Rad screening at Bldg 25 NO A 78
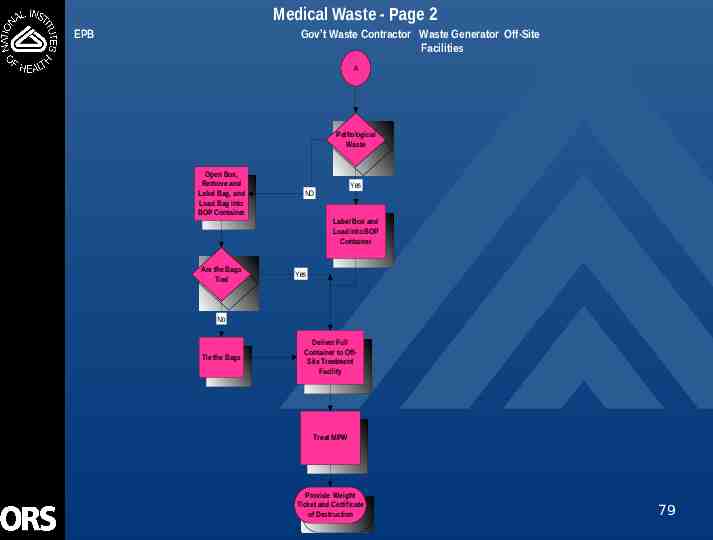
Medical Waste - Page 2 EPB Gov’t Waste Contractor Waste Generator Off-Site Facilities A Pathological Waste Open Box, Remove and Label Bag, and Load Bag into BOP Container Yes NO Label Box and Load into BOP Container Are the Bags Tied Yes No Tie the Bags Deliver Full Container to OffSite Treatment Facility Treat MPW Provide Weight Ticket and Certificate of Destruction 79
Collect and Dispose of Recycables EPB Gov’t Recycling Contractor Off-Site Recycling Facilities Ensure Contract Vehicle is in Place Begin Work Receive Customer Request Receive Customer Request or Do Scheduled Collections Collect recyclables Deliver to Consolidation Area Deliver to Recycling falciity Process if Needed Scape Metal Contaminated Receive amd Provide Weight Ticket No Process Recyclable Material Yes Transfer to OffSite Facility Process Recyclable Material 80
FY02 Learning and Growth (L&G) Data for the Annual Self Assessments Service Group 18: Provide Waste Management 26 September 2002 Summary Prepared by the Office of Quality Management 81
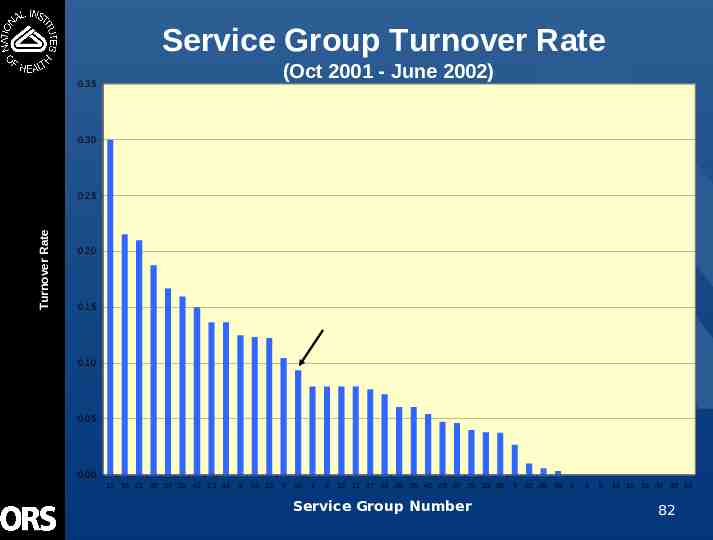
Service Group Turnover Rate (Oct 2001 - June 2002) 0.35 0.30 Turnover Rate 0.25 0.20 0.15 0.10 0.05 0.00 12 16 21 30 27 20 42 13 41 3 24 23 7 18 1 2 10 11 17 31 26 25 40 28 37 29 33 39 Service Group Number 5 32 36 38 4 8 9 14 15 19 34 35 43 82
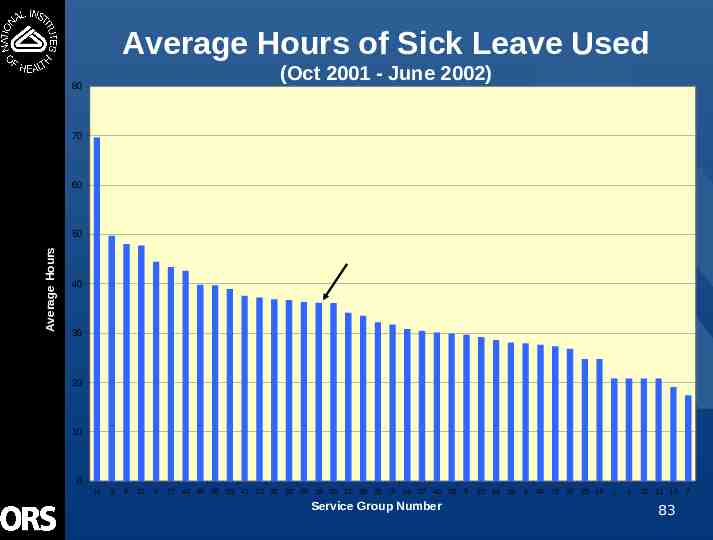
Average Hours of Sick Leave Used (Oct 2001 - June 2002) 80 70 60 Average Hours 50 40 30 20 10 0 14 3 9 31 8 17 43 38 36 33 41 12 30 32 28 18 29 21 39 20 16 24 27 40 35 Service Group Number 5 23 42 19 4 34 15 37 25 26 1 2 10 11 13 83 7
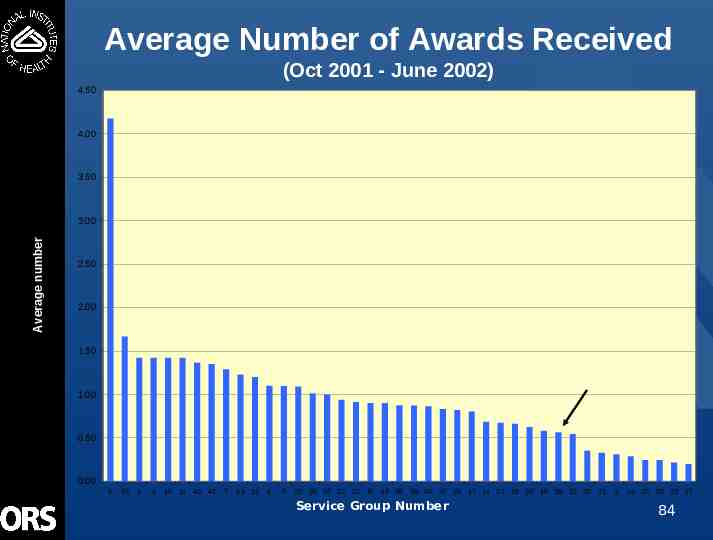
Average Number of Awards Received (Oct 2001 - June 2002) 4.50 4.00 3.50 Average number 3.00 2.50 2.00 1.50 1.00 0.50 0.00 9 43 1 2 10 11 40 42 7 41 12 4 5 28 39 35 32 33 8 15 36 38 34 37 29 17 14 31 16 30 19 18 13 20 21 Service Group Number 3 24 26 25 23 27 84
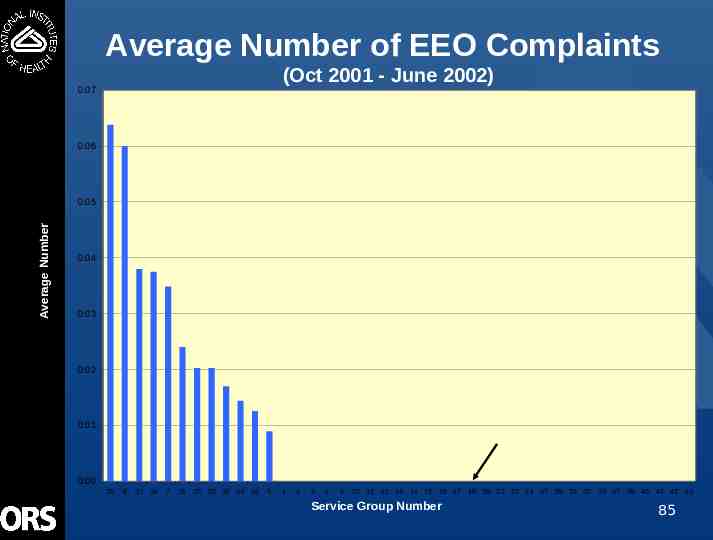
Average Number of EEO Complaints (Oct 2001 - June 2002) 0.07 0.06 Average Number 0.05 0.04 0.03 0.02 0.01 0.00 20 8 33 34 7 31 26 25 38 36 32 5 1 2 3 4 9 10 11 12 13 14 15 16 17 18 19 21 23 24 27 28 29 30 35 37 39 40 41 42 43 Service Group Number 85
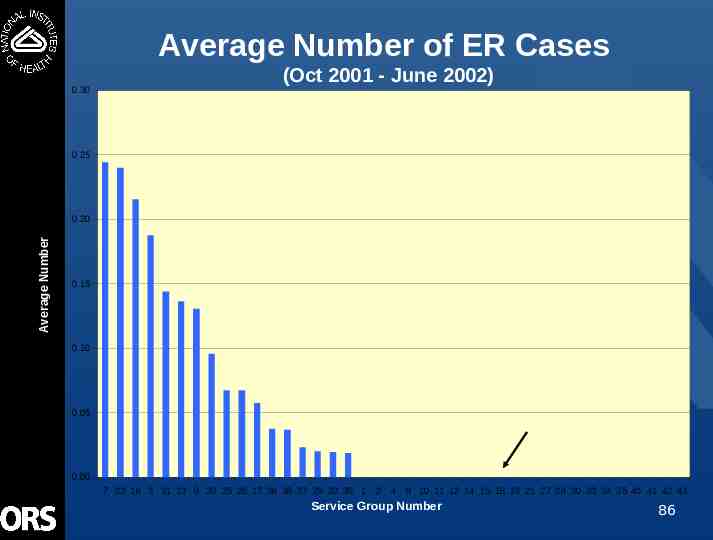
Average Number of ER Cases 0.30 (Oct 2001 - June 2002) 0.25 Average Number 0.20 0.15 0.10 0.05 0.00 7 23 16 3 31 13 9 20 25 26 17 36 38 37 29 32 39 1 2 4 8 10 11 12 14 15 18 19 21 27 28 30 33 34 35 40 41 42 43 Service Group Number 86
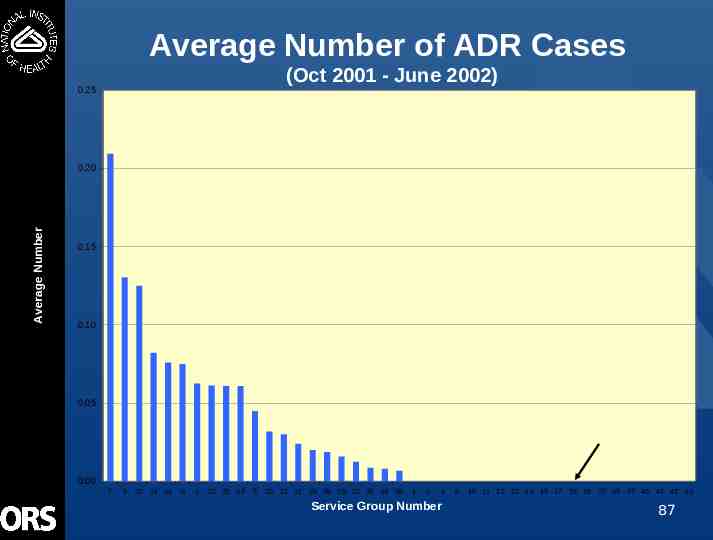
Average Number of ADR Cases (Oct 2001 - June 2002) 0.25 Average Number 0.20 0.15 0.10 0.05 0.00 7 9 30 24 33 34 3 23 26 25 5 20 21 31 29 39 28 32 36 16 38 1 2 4 Service Group Number 8 10 11 12 13 14 15 17 18 19 27 35 37 40 41 42 43 87
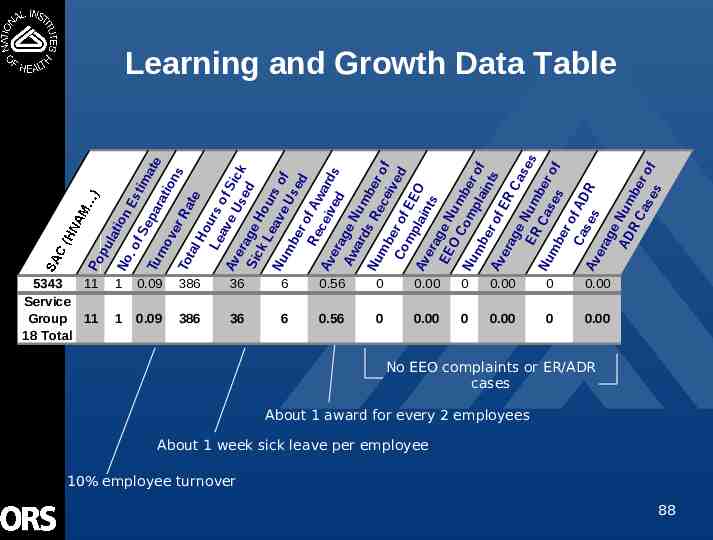
5343 11 Service Group 11 18 Total la t ion Es .o fS tim ep ate Tu a ra rn tio ov ns er To Ra tal te Ho Le urs av of Av e U Sic era se k d Sic g e k L Ho u ea r Nu ve s o f mb Us er ed of Re A c e wa r Av ive d s era d Aw g e N ard um s R be Nu ec r of mb e iv e ed Co r of mp EE lai O Av nts era EE g e N O u Co mb Nu mp e r mb lai of er nts of Av ER era ge Ca se N u ER s mb Ca Nu er se of mb s er o Ca f A D se Av s R era ge AD Nu m R Ca ber s e of s pu No Po Learning and Growth Data Table 1 0.09 386 36 6 0.56 0 0.00 0 0.00 0 0.00 1 0.09 386 36 6 0.56 0 0.00 0 0.00 0 0.00 No EEO complaints or ER/ADR cases About 1 award for every 2 employees About 1 week sick leave per employee 10% employee turnover 88
Summary of Service Group 18 Learning and Growth Data Ten percent employee turnover About 1 week sick leave used per employee About one award for every 2 employees No EEO, ER, or ADR issues 89
Conclusions from Turnover, Sick Leave, Awards, EEO/ER/ADR Data No significant conclusions can be drawn from the data 90
Answers to Readiness Questions 1. What are the right mix of skills and abilities needed to carry out the mission of this service group? Recycling: Understanding of industry equipment, operations and work practices, basic PC skills, contract management skills, communication skills, a full understanding of applicable regulations and required reports, good people skills and customer service skills Solid Waste: Understanding of industry equipment operations and work practices, basic PC skills, contract management skills, communication skills, a full understanding of applicable regulations and required reports, good people skills and customer service skills 91
Answers to Readiness Questions (Cont.) Hazardous Waste: Understanding of hazardous waste regulations and their application at the NIH, ability to interpret new regulations and permit conditions knowledge of the industry (transportation, treatment, and disposal), good college science background in chemistry, biology, and physics, good PC skills for data tracking and document preparation, contract management skills, communication skills, good people skills and customer service skills Medical Waste: Understanding of industry operations and work practices, college background in biology and general sciences, understanding of state and DOT medical waste regulations, basic PC skills, contract management skills, communication skills, good people skills and customer service skills 92
Answers to Readiness Questions (Cont.) 2. Will the service group have sufficient numbers of people, with the right skills and abilities to carry out its mission in the next three years? In 2004, an additional EPB staff member will be required to manage proposed Twinbrook Research Complex Waste Facility. Additional staff resources also required 2004-2006 to support increased service demands created by occupancy phases of following new buildings: CRC, NRC and Twinbrook Research Complex. 93
Answers to Readiness Questions (Cont.) 3. What are going to be the training needs of the employees and contractors employed in this service group in the next two to three years? Will continue our existing training track including: regulatory and industry specific training, customer relations and leadership skills training, on-site training required by permits, and IT training related to data tracking and contract management. A stronger emphasis will be placed on IT training related to data management and on leadership/management skills. 94
Answers to Readiness Questions (Cont.) 4. What will be the right tools or materials (e.g., information, software applications, hardware, specialized equipment) needed to carry out the mission of this service group in the next three years? Industrial waste handling equipment, hazardous waste analytical equipment, replacement computers, hazardous waste tracking software, and data tracking software. Onsite staging area for dumpsters with suspected hazardous material contamination. 95
Answers to Readiness Questions (Cont.) 5. Does the service group have the right quantity of tools or materials needed to carry out its mission in the next three years? Mainly need to continue existing hazardous waste tracking software enhancements for more detailed data tracking. 6. What are the anticipated implications of not obtaining the right mix of skills and abilities, or tools and materials (e.g., service disruption, inefficiencies, increased turnover of key personnel) in meeting service or mission expectations? Greater difficulties in tracking and retrieving critical hazardous waste data and reduced work efficiency by contractor staff. 96