Balanced Scorecard Workshop Presented by: Matt H. Evans, CPA, CMA,

61 Slides539.50 KB
Balanced Scorecard Workshop Presented by: Matt H. Evans, CPA, CMA, CFM Public Sector Retreat on Malcolm Baldrige Performance Excellence 1
Purpose of the Workshop Introduce the Balanced Scorecard to the Organization Make sure everyone understands how the scorecard works Communicate how the Balanced Scorecard fits with the Malcolm Baldrige Model of performance excellence 2
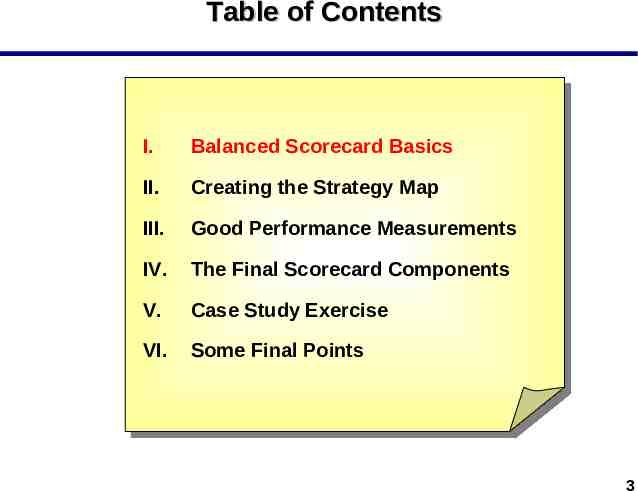
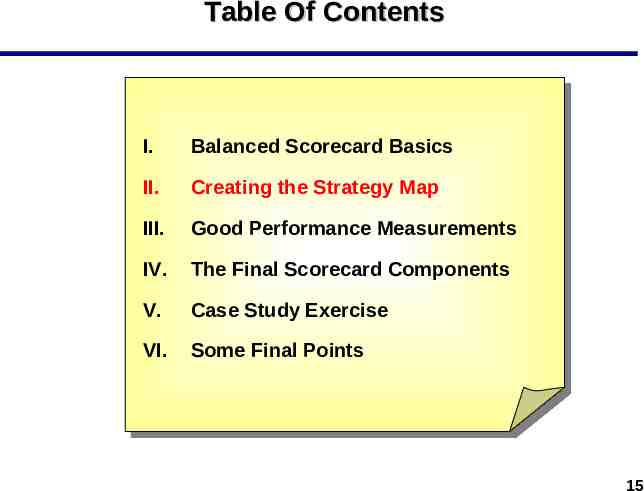
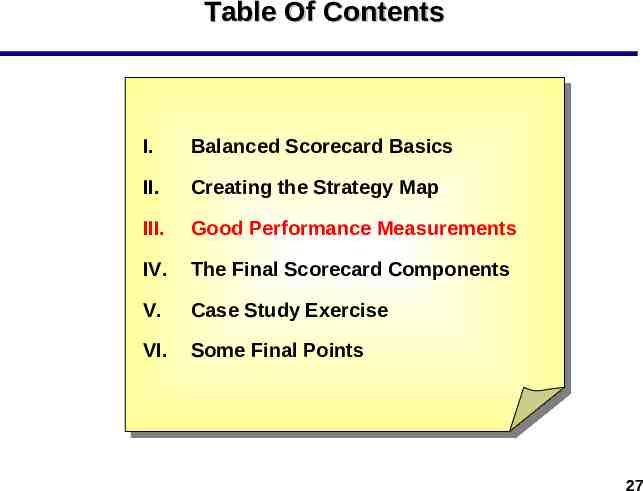
Table of Contents I. Balanced Scorecard Basics II. Creating the Strategy Map III. Good Performance Measurements IV. The Final Scorecard Components V. Case Study Exercise VI. Some Final Points 3
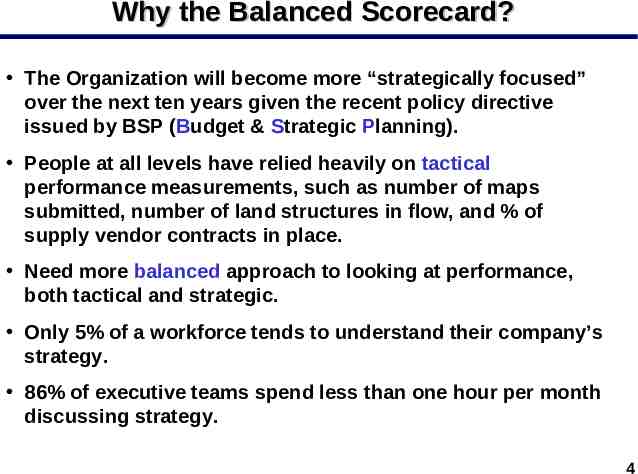
Why the Balanced Scorecard? The Organization will become more “strategically focused” over the next ten years given the recent policy directive issued by BSP (Budget & Strategic Planning). People at all levels have relied heavily on tactical performance measurements, such as number of maps submitted, number of land structures in flow, and % of supply vendor contracts in place. Need more balanced approach to looking at performance, both tactical and strategic. Only 5% of a workforce tends to understand their company’s strategy. 86% of executive teams spend less than one hour per month discussing strategy. 4
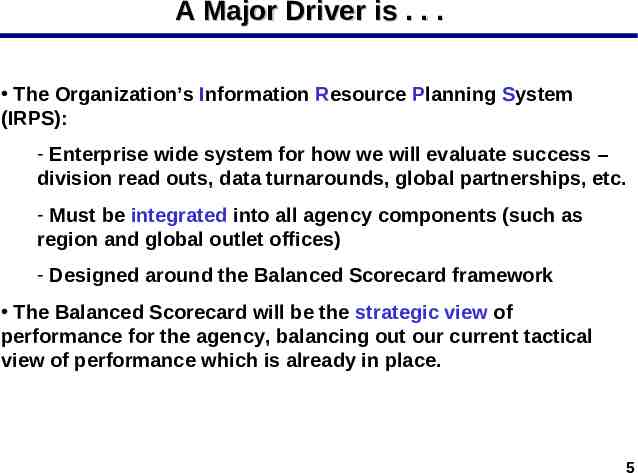
A Major Driver is . . . The Organization’s Information Resource Planning System (IRPS): - Enterprise wide system for how we will evaluate success – division read outs, data turnarounds, global partnerships, etc. - Must be integrated into all agency components (such as region and global outlet offices) - Designed around the Balanced Scorecard framework The Balanced Scorecard will be the strategic view of performance for the agency, balancing out our current tactical view of performance which is already in place. 5
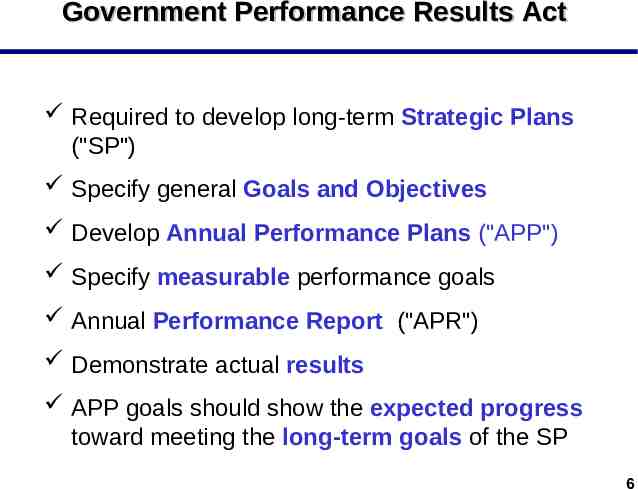
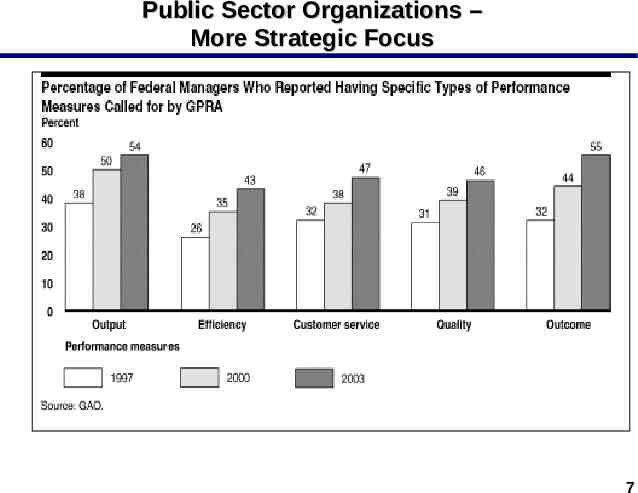
Government Performance Results Act Required to develop long-term Strategic Plans ("SP") Specify general Goals and Objectives Develop Annual Performance Plans ("APP") Specify measurable performance goals Annual Performance Report ("APR") Demonstrate actual results APP goals should show the expected progress toward meeting the long-term goals of the SP 6
Public Sector Organizations – More Strategic Focus 7
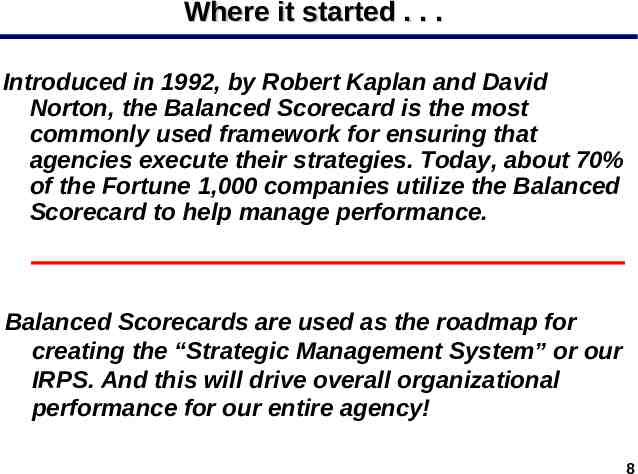
Where it started . . . Introduced in 1992, by Robert Kaplan and David Norton, the Balanced Scorecard is the most commonly used framework for ensuring that agencies execute their strategies. Today, about 70% of the Fortune 1,000 companies utilize the Balanced Scorecard to help manage performance. Balanced Scorecards are used as the roadmap for creating the “Strategic Management System” or our IRPS. And this will drive overall organizational performance for our entire agency! 8
Some Basic Principles Quantifies the Agency Strategy in measurable terms Strategy is summarized on a Strategy Map over four views of performance (perspectives). Must capture a cause-effect relationship between strategic objectives over the four perspectives on the Strategy Map. Critical Components include: - Measurements - Targets - Initiatives Everything must be linked: Goals to Objectives, Objectives to Measurements, Measurements to Targets. 9
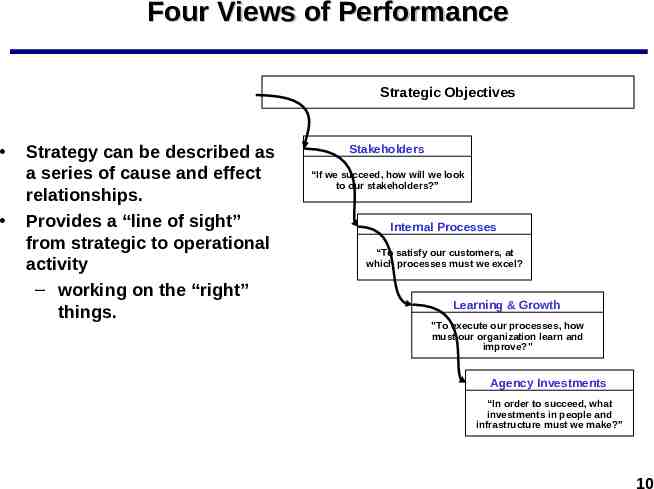
Four Views of Performance Strategic Objectives Strategy can be described as a series of cause and effect relationships. Provides a “line of sight” from strategic to operational activity – working on the “right” things. Stakeholders “If we succeed, how will we look to our stakeholders?” Internal Processes “To satisfy our customers, at which processes must we excel? Learning & Growth "To execute our processes, how must our organization learn and improve?" Agency Investments “In order to succeed, what investments in people and infrastructure must we make?” 10
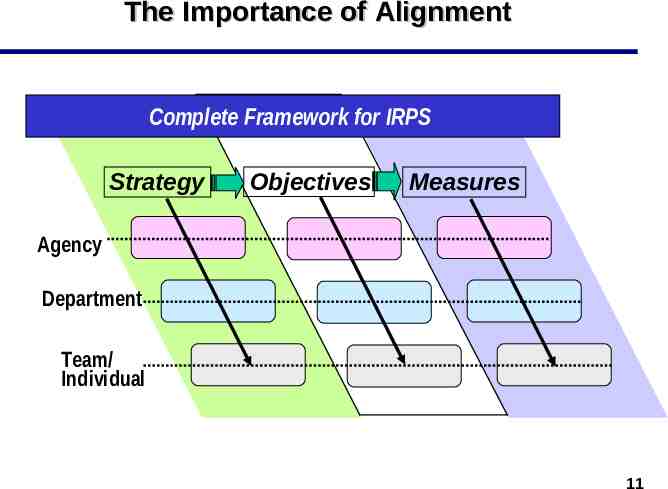
The Importance of Alignment Complete Framework for IRPS Strategy Objectives Measures Agency Department Team/ Individual 11
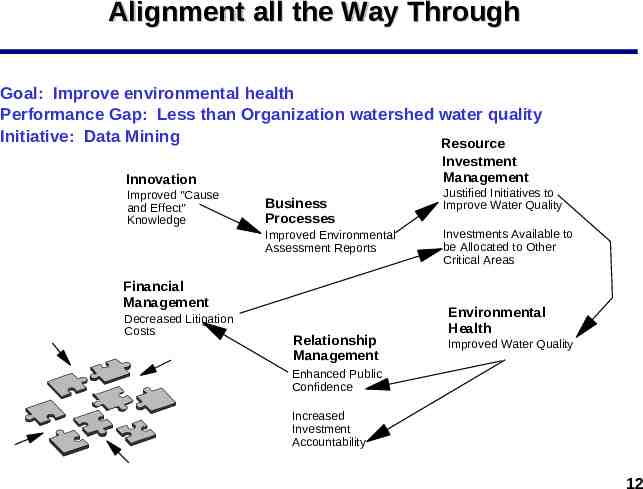
Alignment all the Way Through Goal: Improve environmental health Performance Gap: Less than Organization watershed water quality Initiative: Data Mining Resource Investment Management Innovation Improved "Cause and Effect" Knowledge Business Processes Improved Environmental Assessment Reports Financial Management Decreased Litigation Costs Relationship Management Justified Initiatives to Improve Water Quality Investments Available to be Allocated to Other Critical Areas Environmental Health Improved Water Quality Enhanced Public Confidence Increased Investment Accountability 12
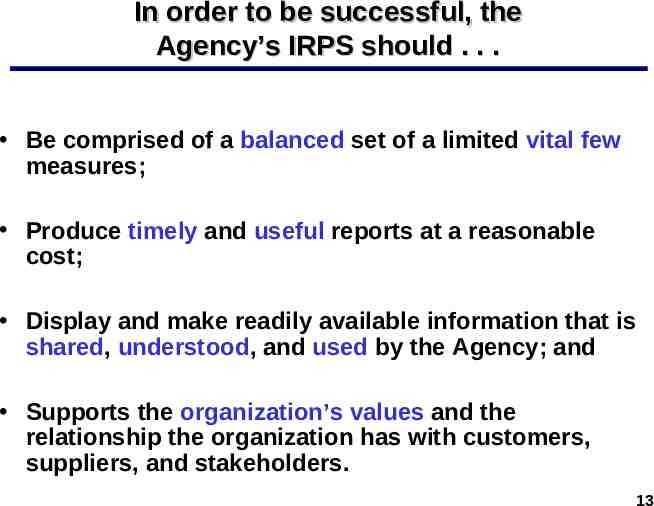
In order to be successful, the Agency’s IRPS should . . . Be comprised of a balanced set of a limited vital few measures; Produce timely and useful reports at a reasonable cost; Display and make readily available information that is shared, understood, and used by the Agency; and Supports the organization’s values and the relationship the organization has with customers, suppliers, and stakeholders. 13
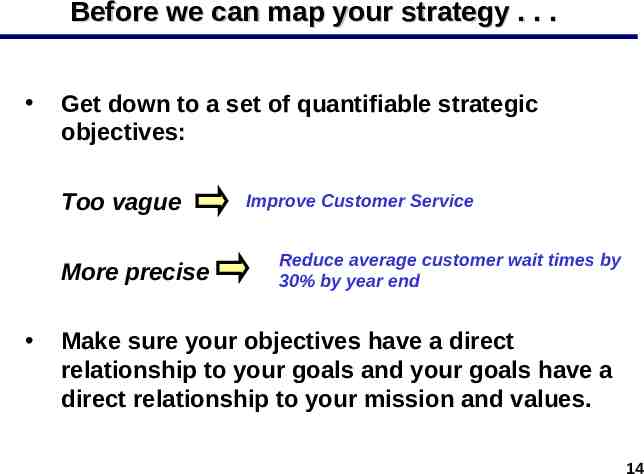
Before we can map your strategy . . . Get down to a set of quantifiable strategic objectives: Too vague More precise Improve Customer Service Reduce average customer wait times by 30% by year end Make sure your objectives have a direct relationship to your goals and your goals have a direct relationship to your mission and values. 14
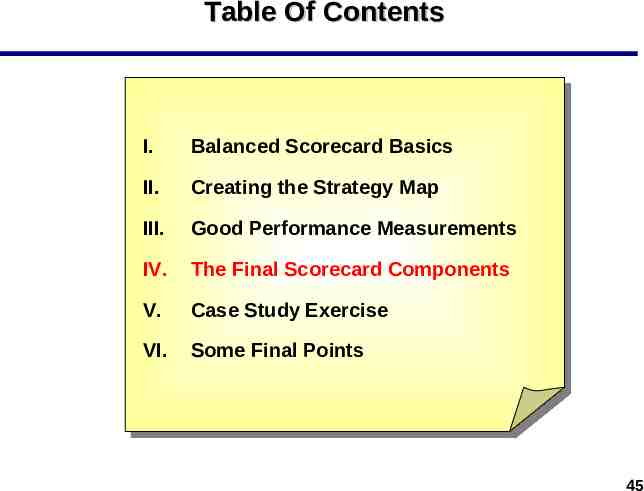
Table Of Contents I. Balanced Scorecard Basics II. Creating the Strategy Map III. Good Performance Measurements IV. The Final Scorecard Components V. Case Study Exercise VI. Some Final Points 15
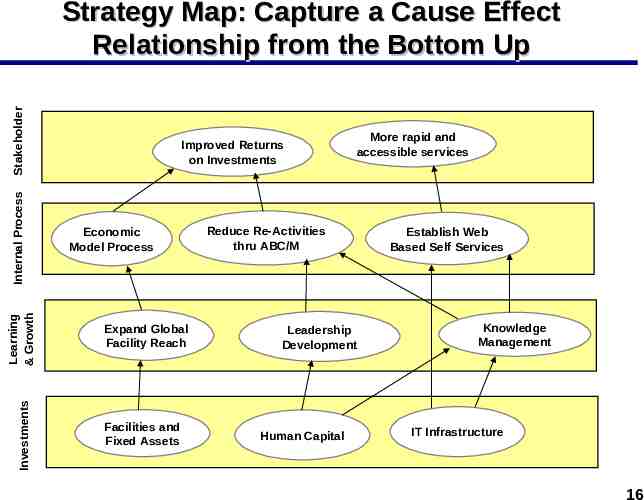
Investments Learning & Growth Internal Process Stakeholder Strategy Map: Capture a Cause Effect Relationship from the Bottom Up Improved Returns on Investments Economic Model Process Expand Global Facility Reach Facilities and Fixed Assets More rapid and accessible services Reduce Re-Activities thru ABC/M Leadership Development Human Capital Establish Web Based Self Services Knowledge Management IT Infrastructure 16
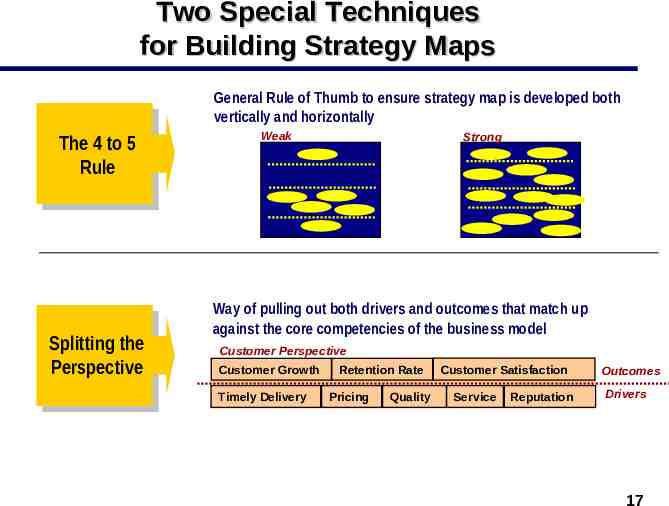
Two Special Techniques for Building Strategy Maps General Rule of Thumb to ensure strategy map is developed both vertically and horizontally The 4 to 5 Rule Splitting the Perspective Weak Strong Way of pulling out both drivers and outcomes that match up against the core competencies of the business model Customer Perspective Customer Growth Timely Delivery Retention Rate Pricing Quality Customer Satisfaction Service Reputation Outcomes Drivers 17
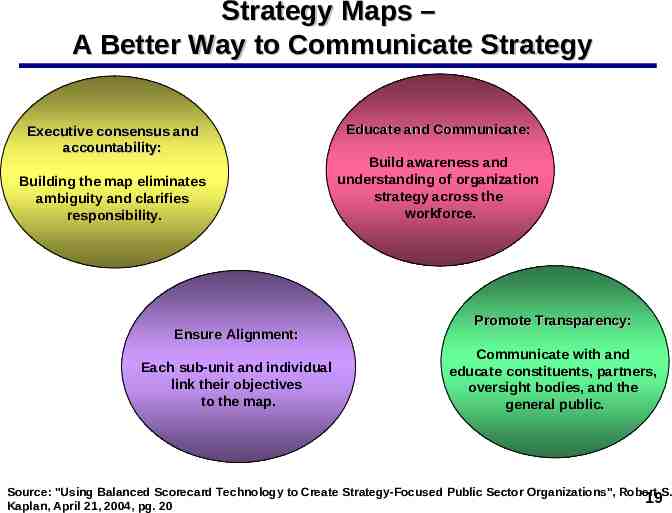
Key Benefits of Strategy Maps Articulates how the organization creates value for its constituents and legitimizing authority Displays key priorities and relationships between outcomes (the "what") and performance enablers or drivers (the "how") Provides a clear view of "how I fit in" for sub-organizations, teams, and individuals "Cascading the scorecard throughout the organization, and clearly mapping the various units and functions back to the organization or agency-wide map is critical to leveraging and ensuring alignment" 18
Strategy Maps – A Better Way to Communicate Strategy Executive consensus and accountability: Building the map eliminates ambiguity and clarifies responsibility. Ensure Alignment: Each sub-unit and individual link their objectives to the map. Educate and Communicate: Build awareness and understanding of organization strategy across the workforce. Promote Transparency: Communicate with and educate constituents, partners, oversight bodies, and the general public. Source: "Using Balanced Scorecard Technology to Create Strategy-Focused Public Sector Organizations", Robert S. 19 Kaplan, April 21, 2004, pg. 20
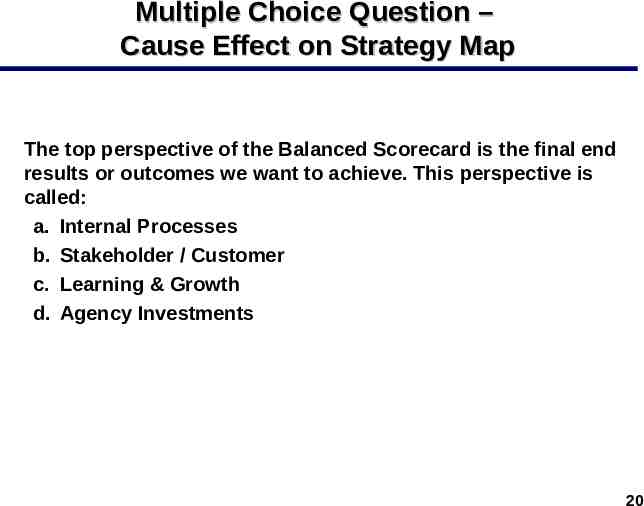
Multiple Choice Question – Cause Effect on Strategy Map The top perspective of the Balanced Scorecard is the final end results or outcomes we want to achieve. This perspective is called: a. Internal Processes b. Stakeholder / Customer c. Learning & Growth d. Agency Investments 20
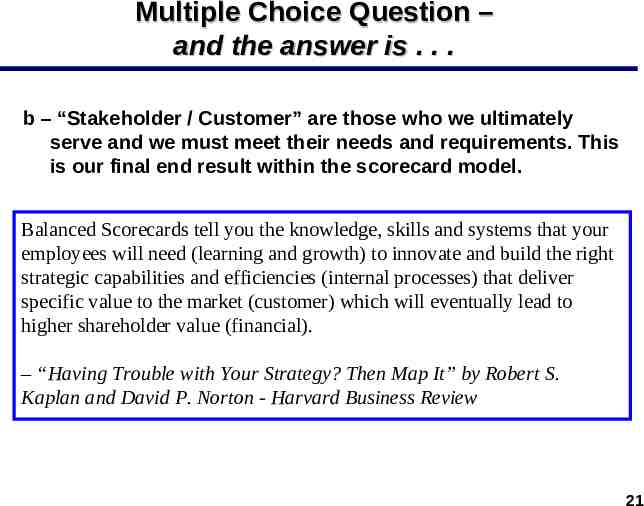
Multiple Choice Question – and the answer is . . . b – “Stakeholder / Customer” are those who we ultimately serve and we must meet their needs and requirements. This is our final end result within the scorecard model. Balanced Scorecards tell you the knowledge, skills and systems that your employees will need (learning and growth) to innovate and build the right strategic capabilities and efficiencies (internal processes) that deliver specific value to the market (customer) which will eventually lead to higher shareholder value (financial). – “Having Trouble with Your Strategy? Then Map It” by Robert S. Kaplan and David P. Norton - Harvard Business Review 21
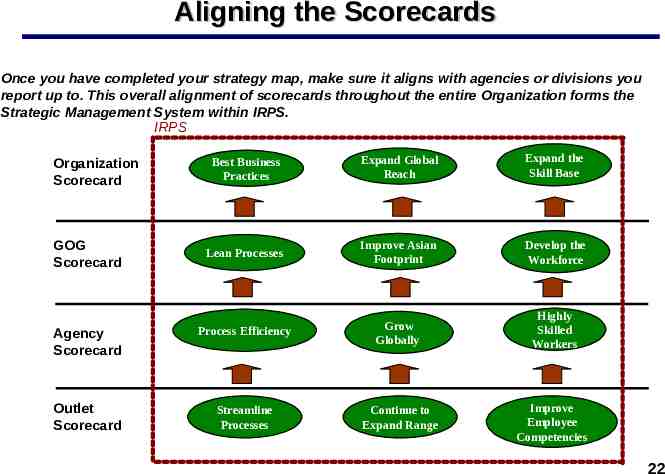
Aligning the Scorecards Once you have completed your strategy map, make sure it aligns with agencies or divisions you report up to. This overall alignment of scorecards throughout the entire Organization forms the Strategic Management System within IRPS. IRPS Best Business Practices Expand Global Reach Expand the Skill Base Lean Processes Improve Asian Footprint Develop the Workforce Agency Scorecard Process Efficiency Grow Globally Highly Skilled Workers Outlet Scorecard Streamline Processes Continue to Expand Range Improve Employee Competencies Organization Scorecard GOG Scorecard 22
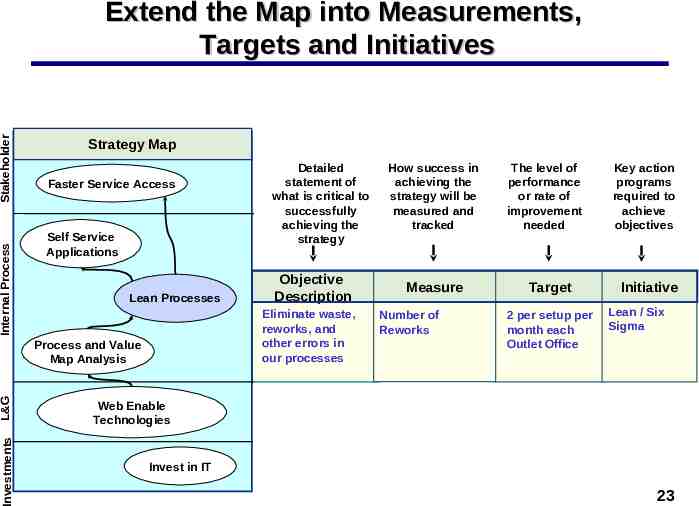
Internal Process Stakeholder Extend the Map into Measurements, Targets and Initiatives Strategy Map Faster Service Access Self Service Applications Lean Processes L&G Objective Description Eliminate waste, reworks, and other errors in our processes Process and Value Map Analysis Investments Detailed statement of what is critical to successfully achieving the strategy How success in achieving the strategy will be measured and tracked Measure Number of Reworks The level of performance or rate of improvement needed Target 2 per setup per month each Outlet Office Key action programs required to achieve objectives Initiative Lean / Six Sigma Web Enable Technologies Invest in IT 23
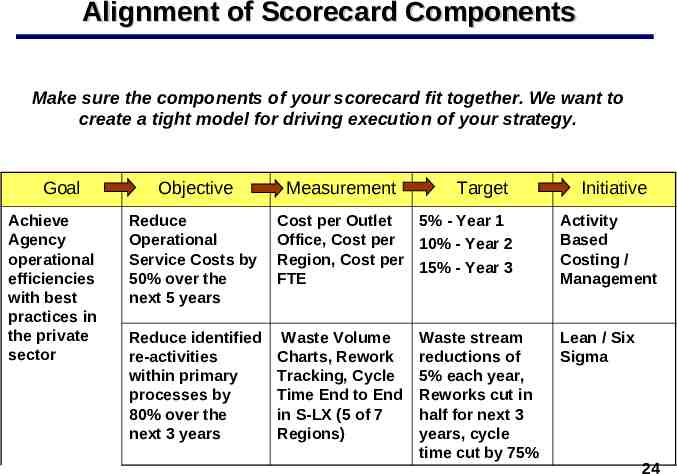
Alignment of Scorecard Components Make sure the components of your scorecard fit together. We want to create a tight model for driving execution of your strategy. Goal Achieve Agency operational efficiencies with best practices in the private sector Objective Measurement Target Initiative Reduce Operational Service Costs by 50% over the next 5 years Cost per Outlet 5% - Year 1 Office, Cost per 10% - Year 2 Region, Cost per 15% - Year 3 FTE Activity Based Costing / Management Reduce identified re-activities within primary processes by 80% over the next 3 years Waste Volume Charts, Rework Tracking, Cycle Time End to End in S-LX (5 of 7 Regions) Lean / Six Sigma Waste stream reductions of 5% each year, Reworks cut in half for next 3 years, cycle time cut by 75% 24
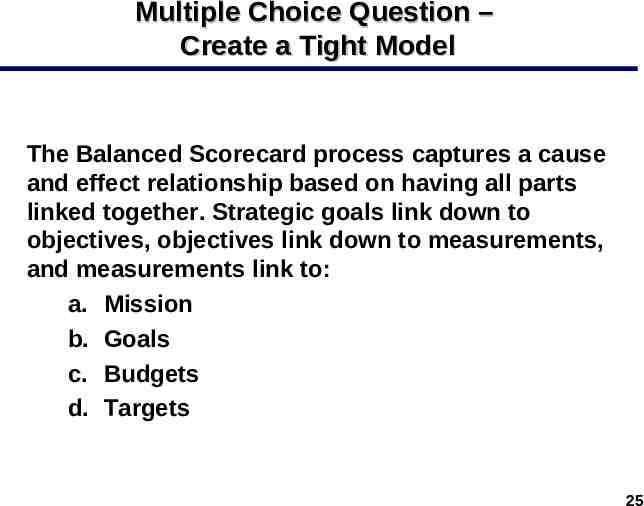
Multiple Choice Question – Create a Tight Model The Balanced Scorecard process captures a cause and effect relationship based on having all parts linked together. Strategic goals link down to objectives, objectives link down to measurements, and measurements link to: a. Mission b. Goals c. Budgets d. Targets 25
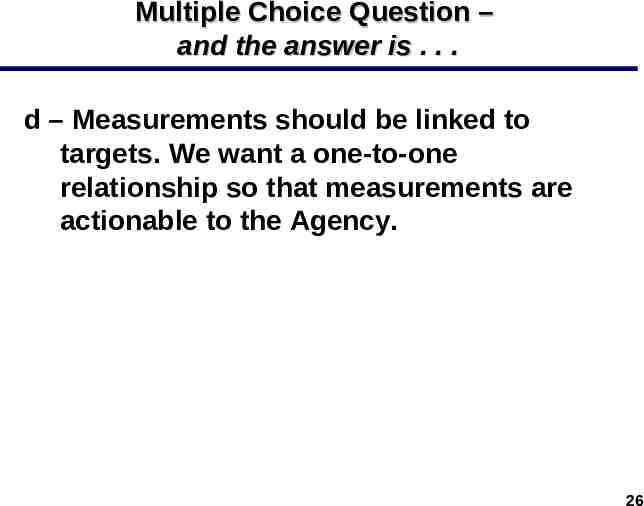
Multiple Choice Question – and the answer is . . . d – Measurements should be linked to targets. We want a one-to-one relationship so that measurements are actionable to the Agency. 26
Table Of Contents I. Balanced Scorecard Basics II. Creating the Strategy Map III. Good Performance Measurements IV. The Final Scorecard Components V. Case Study Exercise VI. Some Final Points 27
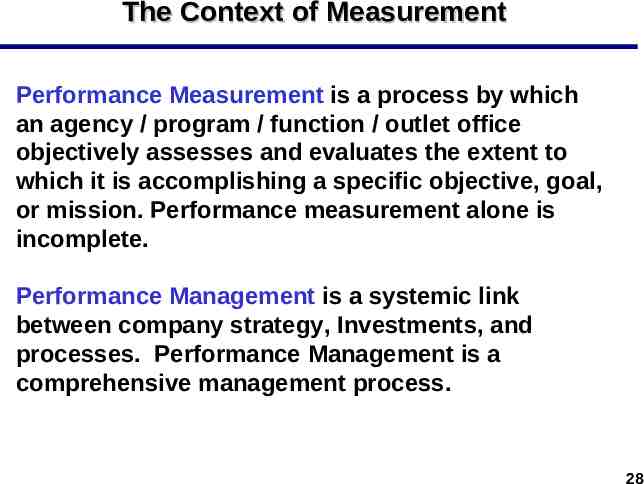
The Context of Measurement Performance Measurement is a process by which an agency / program / function / outlet office objectively assesses and evaluates the extent to which it is accomplishing a specific objective, goal, or mission. Performance measurement alone is incomplete. Performance Management is a systemic link between company strategy, Investments, and processes. Performance Management is a comprehensive management process. 28
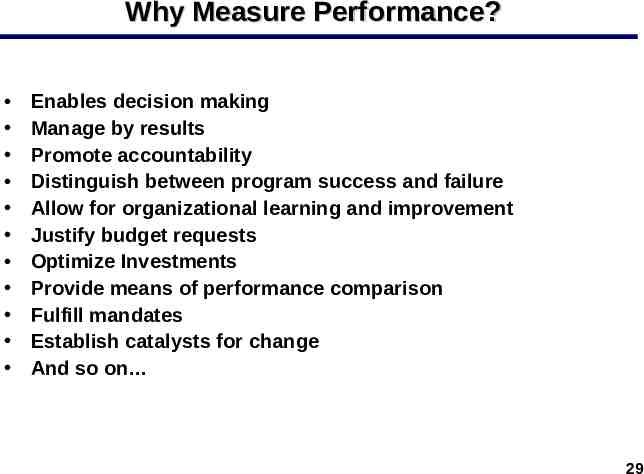
Why Measure Performance? Enables decision making Manage by results Promote accountability Distinguish between program success and failure Allow for organizational learning and improvement Justify budget requests Optimize Investments Provide means of performance comparison Fulfill mandates Establish catalysts for change And so on 29
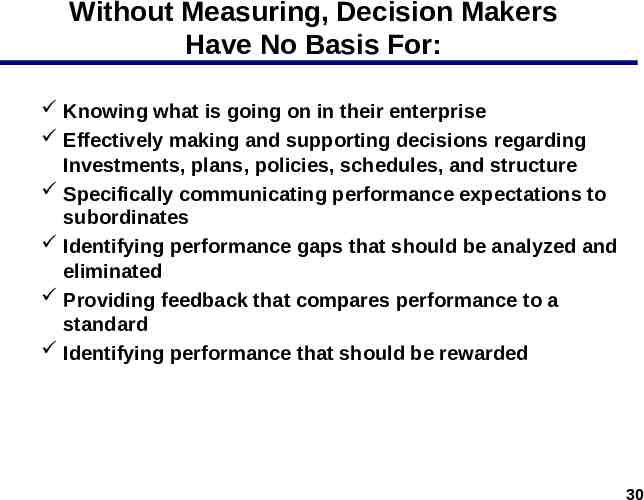
Without Measuring, Decision Makers Have No Basis For: Knowing what is going on in their enterprise Effectively making and supporting decisions regarding Investments, plans, policies, schedules, and structure Specifically communicating performance expectations to subordinates Identifying performance gaps that should be analyzed and eliminated Providing feedback that compares performance to a standard Identifying performance that should be rewarded 30
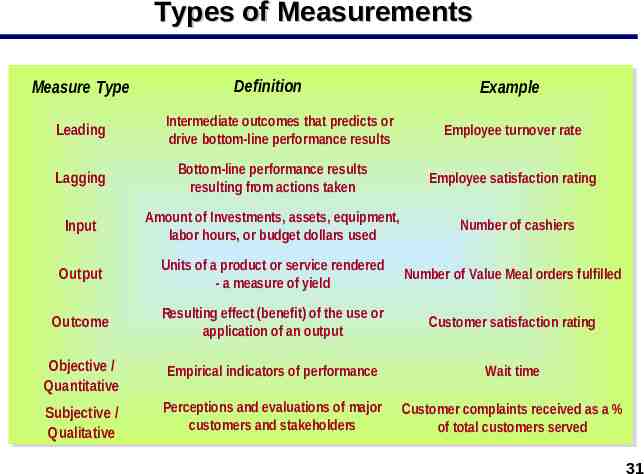
Types of Measurements Measure Type Leading Definition Intermediate outcomes that predicts or drive bottom-line performance results Example Employee turnover rate Lagging Bottom-line performance results resulting from actions taken Input Amount of Investments, assets, equipment, labor hours, or budget dollars used Output Units of a product or service rendered - a measure of yield Number of Value Meal orders fulfilled Outcome Resulting effect (benefit) of the use or application of an output Customer satisfaction rating Objective / Quantitative Empirical indicators of performance Wait time Subjective / Qualitative Perceptions and evaluations of major customers and stakeholders Customer complaints received as a % of total customers served Employee satisfaction rating Number of cashiers 31
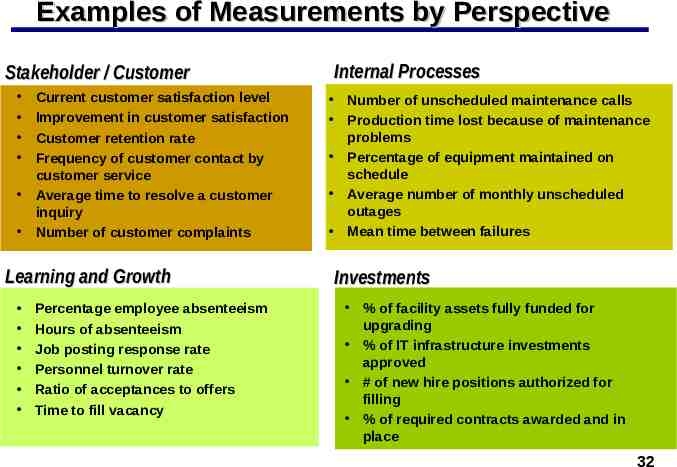
Examples of Measurements by Perspective Stakeholder / Customer Current customer satisfaction level Improvement in customer satisfaction Customer retention rate Frequency of customer contact by customer service Average time to resolve a customer inquiry Number of customer complaints Learning and Growth Percentage employee absenteeism Hours of absenteeism Job posting response rate Personnel turnover rate Ratio of acceptances to offers Time to fill vacancy Internal Processes Number of unscheduled maintenance calls Production time lost because of maintenance problems Percentage of equipment maintained on schedule Average number of monthly unscheduled outages Mean time between failures Investments % of facility assets fully funded for upgrading % of IT infrastructure investments approved # of new hire positions authorized for filling % of required contracts awarded and in place 32
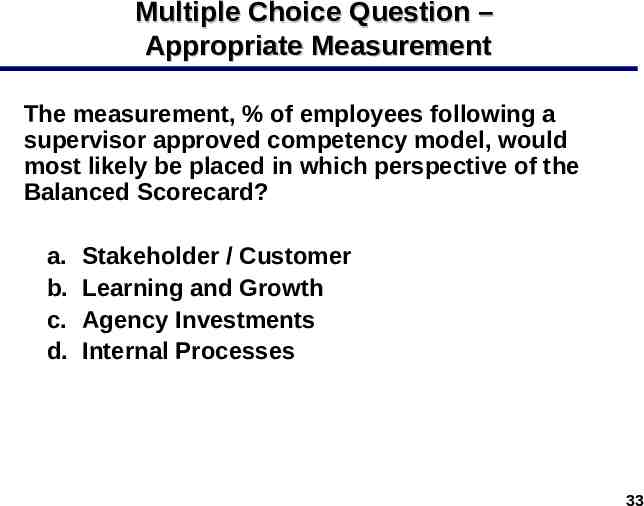
Multiple Choice Question – Appropriate Measurement The measurement, % of employees following a supervisor approved competency model, would most likely be placed in which perspective of the Balanced Scorecard? a. b. c. d. Stakeholder / Customer Learning and Growth Agency Investments Internal Processes 33
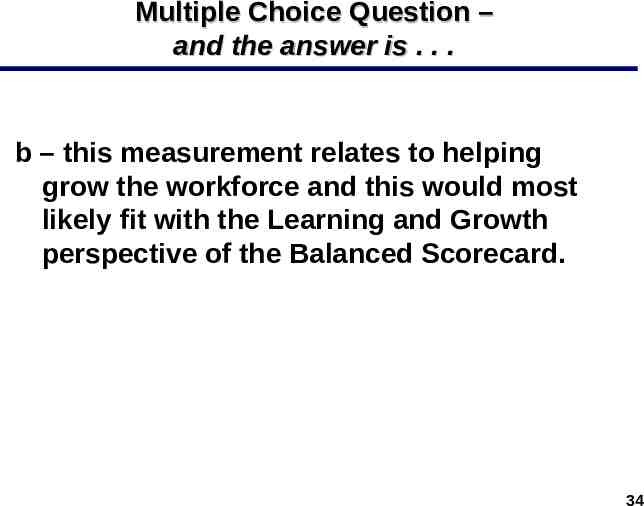
Multiple Choice Question – and the answer is . . . b – this measurement relates to helping grow the workforce and this would most likely fit with the Learning and Growth perspective of the Balanced Scorecard. 34
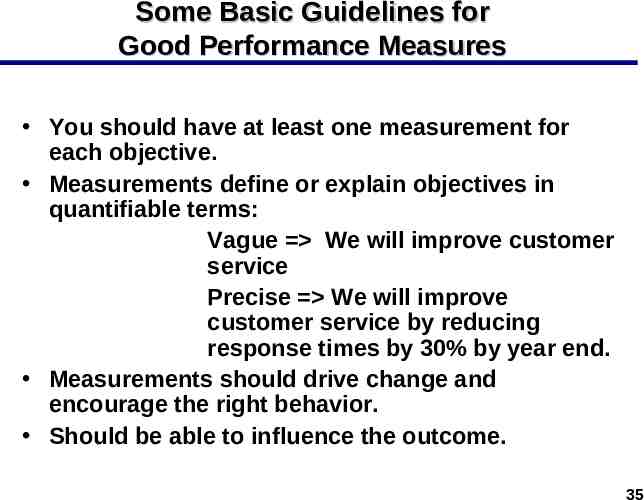
Some Basic Guidelines for Good Performance Measures You should have at least one measurement for each objective. Measurements define or explain objectives in quantifiable terms: Vague We will improve customer service Precise We will improve customer service by reducing response times by 30% by year end. Measurements should drive change and encourage the right behavior. Should be able to influence the outcome. 35
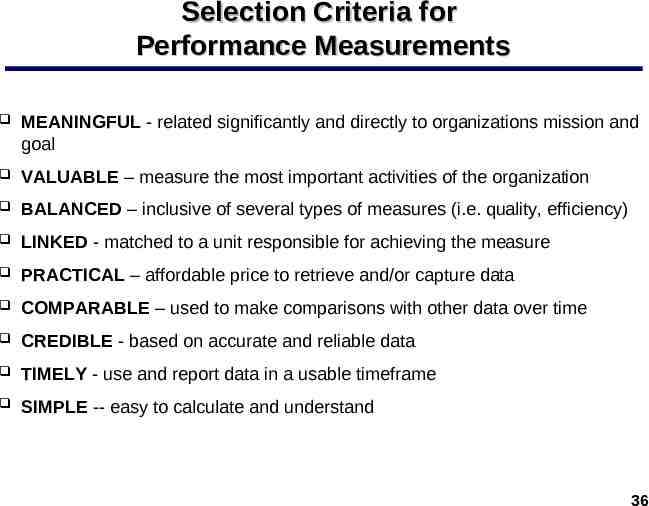
Selection Criteria for Performance Measurements MEANINGFUL - related significantly and directly to organizations mission and goal VALUABLE – measure the most important activities of the organization BALANCED – inclusive of several types of measures (i.e. quality, efficiency) LINKED - matched to a unit responsible for achieving the measure PRACTICAL – affordable price to retrieve and/or capture data COMPARABLE – used to make comparisons with other data over time CREDIBLE - based on accurate and reliable data TIMELY - use and report data in a usable timeframe SIMPLE -- easy to calculate and understand 36
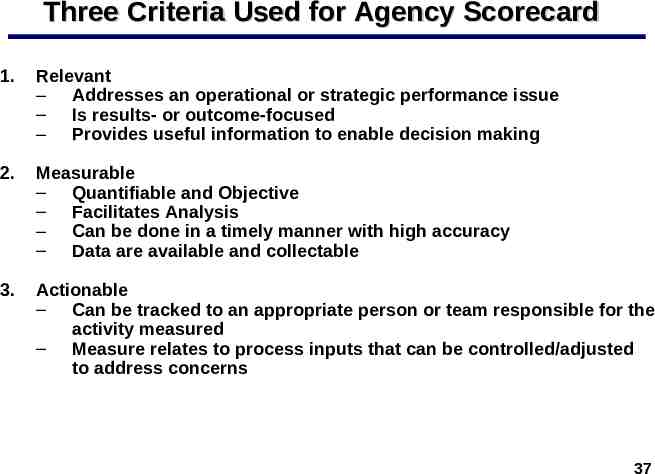
Three Criteria Used for Agency Scorecard 1. Relevant – Addresses an operational or strategic performance issue – Is results- or outcome-focused – Provides useful information to enable decision making 2. Measurable – Quantifiable and Objective – Facilitates Analysis – Can be done in a timely manner with high accuracy – Data are available and collectable 3. Actionable – Can be tracked to an appropriate person or team responsible for the activity measured – Measure relates to process inputs that can be controlled/adjusted to address concerns 37
Scoring Measurements Against the Three Selection Criteria A “0” or “1” in any column indicates that you need to revisit this measurement before implementation. Measurement Relevant Measurable Actionable % of Global Outlets that follow the end to end process defined in IRPS 3 1 2 Number of score studies completed 3 2 3 % of Region Centers using ABC Models to manage 65% of their allocation costs 3 2 3 % of eligible employees who are participating in the Competency Model Development Program 3 2 2 % of map points loaded and operational in GPS Tracking 3 2 2 0 Does not apply 1 Poor 2 Acceptable 3 Good 38
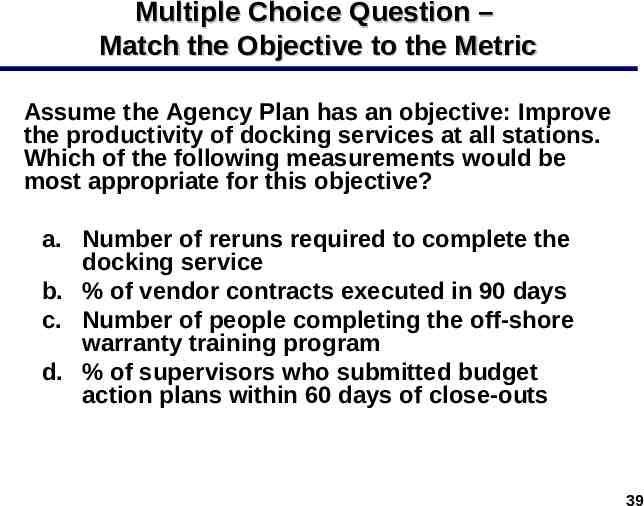
Multiple Choice Question – Match the Objective to the Metric Assume the Agency Plan has an objective: Improve the productivity of docking services at all stations. Which of the following measurements would be most appropriate for this objective? a. Number of reruns required to complete the docking service b. % of vendor contracts executed in 90 days c. Number of people completing the off-shore warranty training program d. % of supervisors who submitted budget action plans within 60 days of close-outs 39
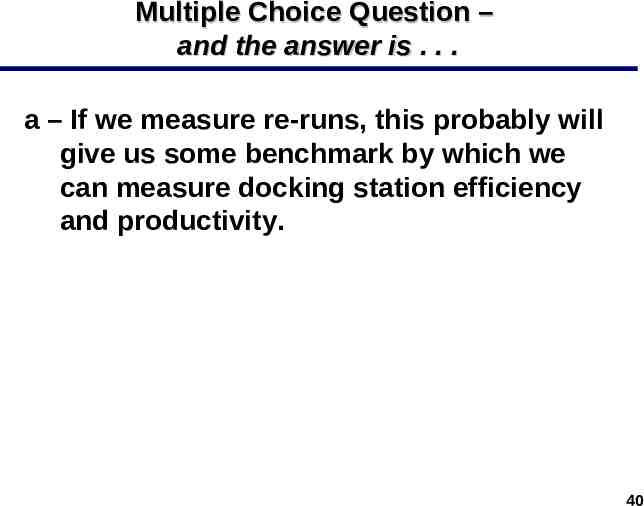
Multiple Choice Question – and the answer is . . . a – If we measure re-runs, this probably will give us some benchmark by which we can measure docking station efficiency and productivity. 40
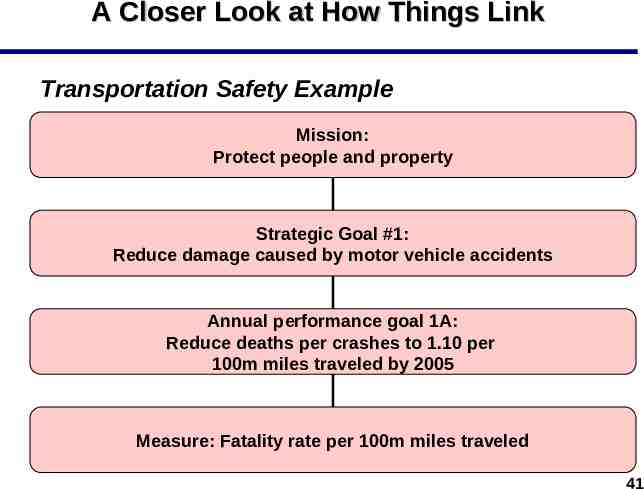
A Closer Look at How Things Link Transportation Safety Example Mission: Protect people and property Strategic Goal #1: Reduce damage caused by motor vehicle accidents Annual performance goal 1A: Reduce deaths per crashes to 1.10 per 100m miles traveled by 2005 Measure: Fatality rate per 100m miles traveled 41
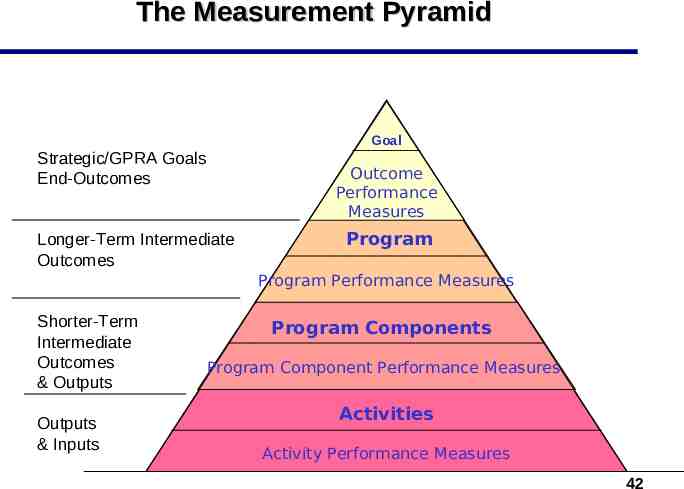
The Measurement Pyramid Goal Strategic/GPRA Goals End-Outcomes Outcome Performance Measures Longer-Term Intermediate Outcomes Program Program Performance Measures Shorter-Term Intermediate Outcomes & Outputs Outputs & Inputs Program Components Program Component Performance Measures Activities Activity Performance Measures 42
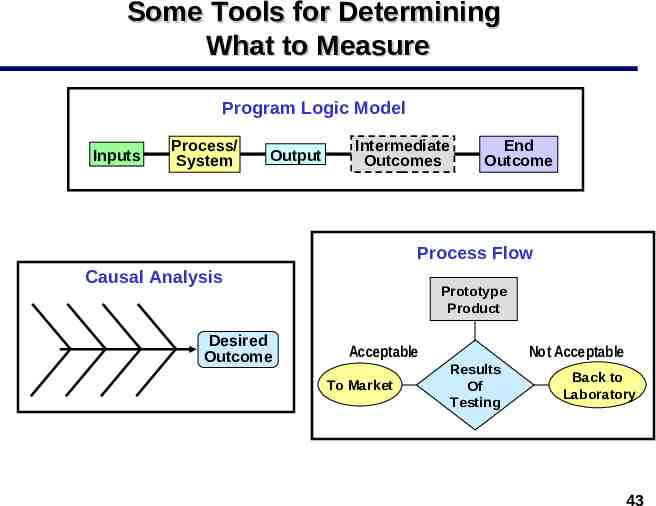
Some Tools for Determining What to Measure Program Logic Model Inputs Process/ System Output Intermediate Outcomes End Outcome Process Flow Causal Analysis Desired Outcome Prototype Product Acceptable To Market Not Acceptable Results Of Testing Back to Laboratory 43
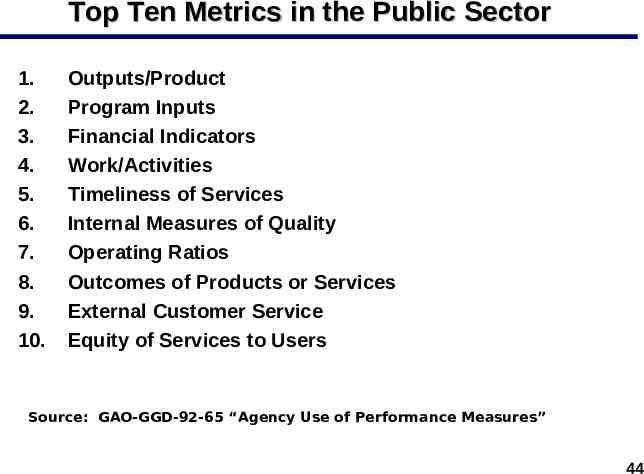
Top Ten Metrics in the Public Sector 1. 2. 3. 4. 5. 6. 7. 8. 9. 10. Outputs/Product Program Inputs Financial Indicators Work/Activities Timeliness of Services Internal Measures of Quality Operating Ratios Outcomes of Products or Services External Customer Service Equity of Services to Users Source: GAO-GGD-92-65 “Agency Use of Performance Measures” 44
Table Of Contents I. Balanced Scorecard Basics II. Creating the Strategy Map III. Good Performance Measurements IV. The Final Scorecard Components V. Case Study Exercise VI. Some Final Points 45
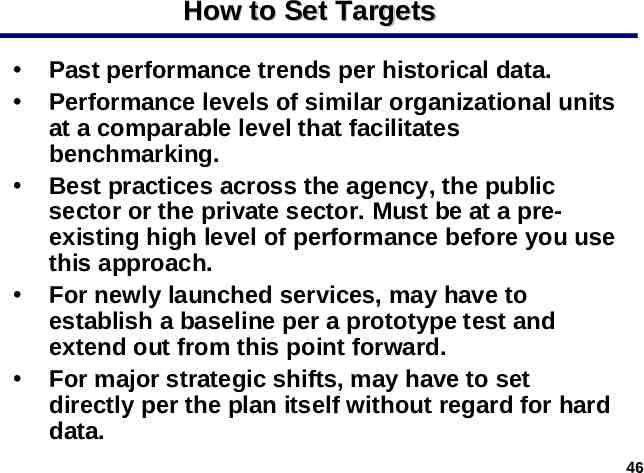
How to Set Targets Past performance trends per historical data. Performance levels of similar organizational units at a comparable level that facilitates benchmarking. Best practices across the agency, the public sector or the private sector. Must be at a preexisting high level of performance before you use this approach. For newly launched services, may have to establish a baseline per a prototype test and extend out from this point forward. For major strategic shifts, may have to set directly per the plan itself without regard for hard data. 46
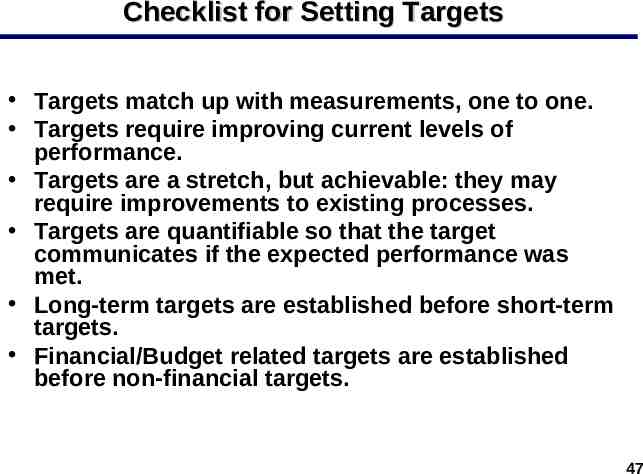
Checklist for Setting Targets Targets match up with measurements, one to one. Targets require improving current levels of performance. Targets are a stretch, but achievable: they may require improvements to existing processes. Targets are quantifiable so that the target communicates if the expected performance was met. Long-term targets are established before short-term targets. Financial/Budget related targets are established before non-financial targets. 47
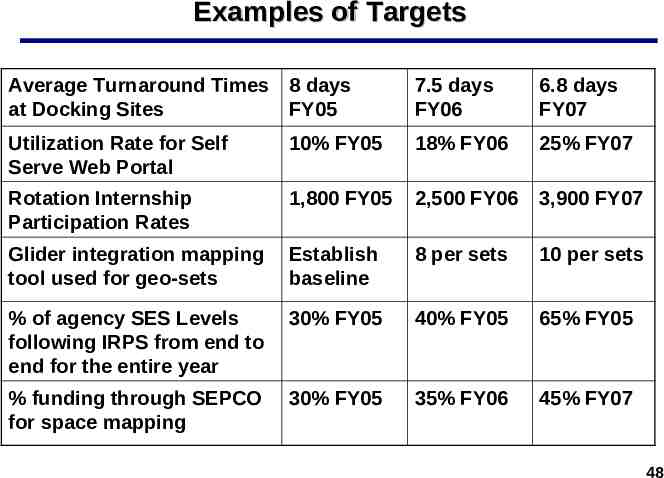
Examples of Targets Average Turnaround Times at Docking Sites 8 days FY05 7.5 days FY06 6.8 days FY07 Utilization Rate for Self Serve Web Portal 10% FY05 18% FY06 25% FY07 Rotation Internship Participation Rates 1,800 FY05 2,500 FY06 3,900 FY07 Glider integration mapping tool used for geo-sets Establish baseline 8 per sets 10 per sets % of agency SES Levels following IRPS from end to end for the entire year 30% FY05 40% FY05 65% FY05 % funding through SEPCO for space mapping 30% FY05 35% FY06 45% FY07 48
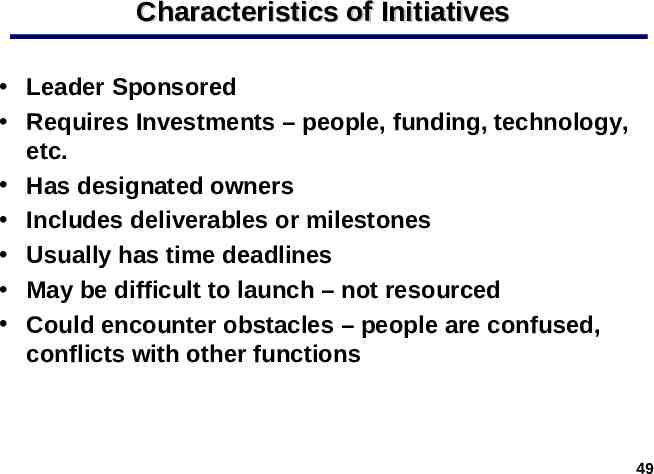
Characteristics of Initiatives Leader Sponsored Requires Investments – people, funding, technology, etc. Has designated owners Includes deliverables or milestones Usually has time deadlines May be difficult to launch – not resourced Could encounter obstacles – people are confused, conflicts with other functions 49
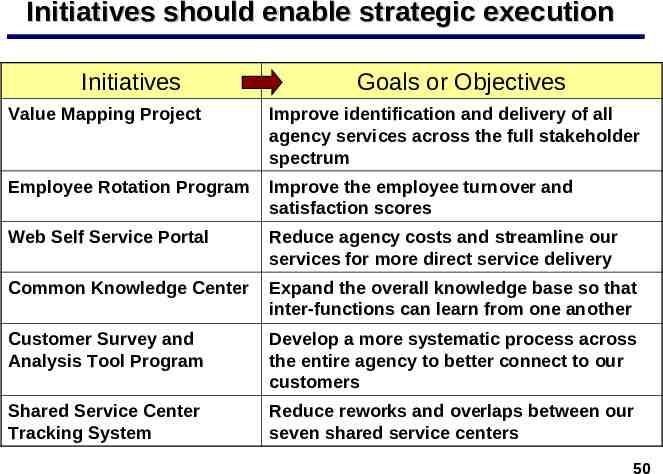
Initiatives should enable strategic execution Initiatives Goals or Objectives Value Mapping Project Improve identification and delivery of all agency services across the full stakeholder spectrum Employee Rotation Program Improve the employee turnover and satisfaction scores Web Self Service Portal Reduce agency costs and streamline our services for more direct service delivery Common Knowledge Center Expand the overall knowledge base so that inter-functions can learn from one another Customer Survey and Analysis Tool Program Develop a more systematic process across the entire agency to better connect to our customers Shared Service Center Tracking System Reduce reworks and overlaps between our seven shared service centers 50
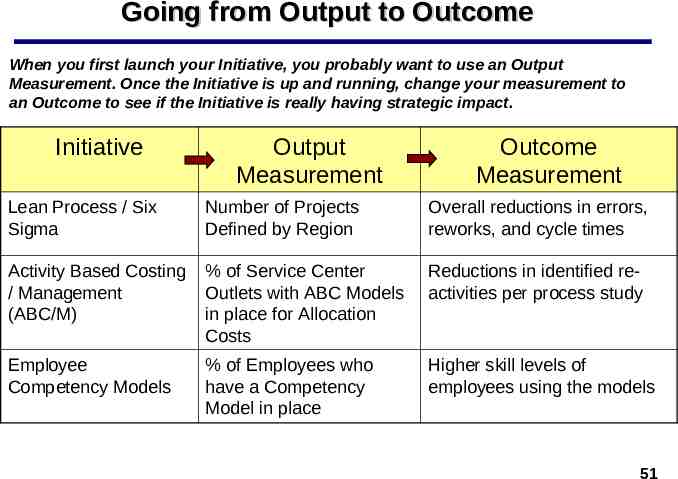
Going from Output to Outcome When you first launch your Initiative, you probably want to use an Output Measurement. Once the Initiative is up and running, change your measurement to an Outcome to see if the Initiative is really having strategic impact. Initiative Output Measurement Outcome Measurement Lean Process / Six Sigma Number of Projects Defined by Region Overall reductions in errors, reworks, and cycle times Activity Based Costing / Management (ABC/M) % of Service Center Outlets with ABC Models in place for Allocation Costs Reductions in identified reactivities per process study Employee Competency Models % of Employees who have a Competency Model in place Higher skill levels of employees using the models 51
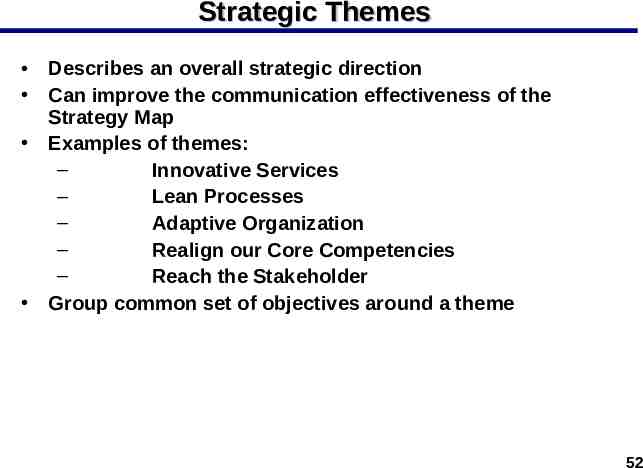
Strategic Themes Describes an overall strategic direction Can improve the communication effectiveness of the Strategy Map Examples of themes: – Innovative Services – Lean Processes – Adaptive Organization – Realign our Core Competencies – Reach the Stakeholder Group common set of objectives around a theme 52
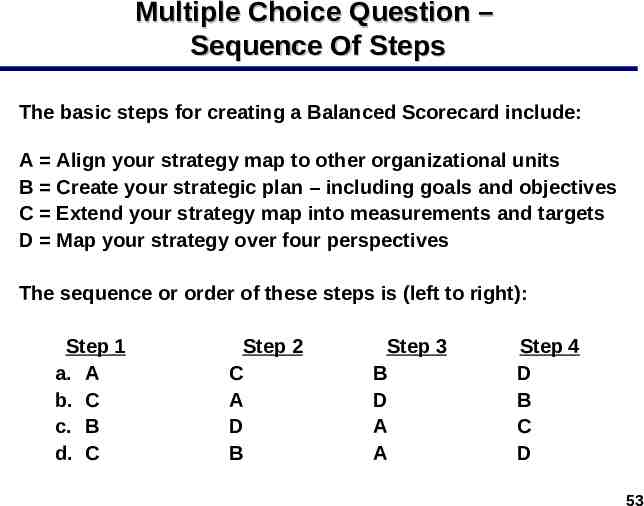
Multiple Choice Question – Sequence Of Steps The basic steps for creating a Balanced Scorecard include: A Align your strategy map to other organizational units B Create your strategic plan – including goals and objectives C Extend your strategy map into measurements and targets D Map your strategy over four perspectives The sequence or order of these steps is (left to right): Step 1 a. A b. C c. B d. C Step 2 C A D B Step 3 B D A A Step 4 D B C D 53
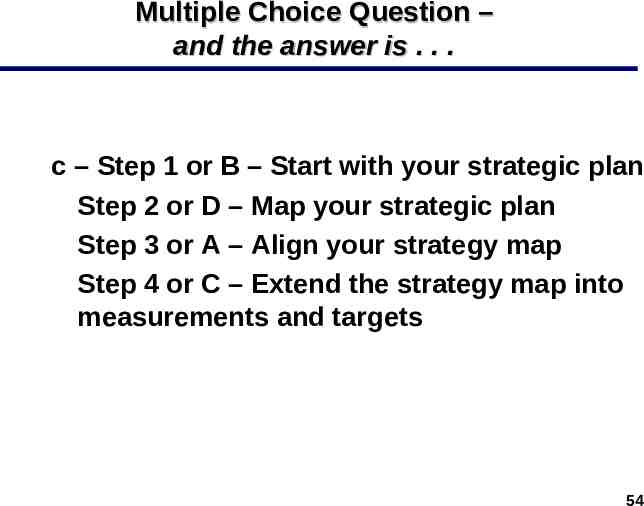
Multiple Choice Question – and the answer is . . . c – Step 1 or B – Start with your strategic plan Step 2 or D – Map your strategic plan Step 3 or A – Align your strategy map Step 4 or C – Extend the strategy map into measurements and targets 54
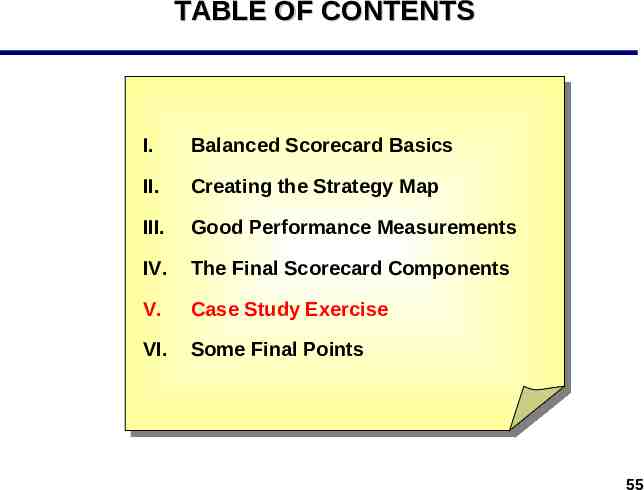
TABLE OF CONTENTS I. Balanced Scorecard Basics II. Creating the Strategy Map III. Good Performance Measurements IV. The Final Scorecard Components V. Case Study Exercise VI. Some Final Points 55
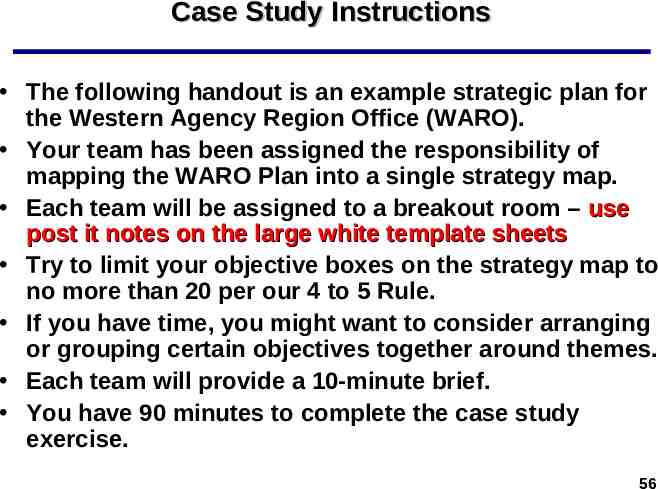
Case Study Instructions The following handout is an example strategic plan for the Western Agency Region Office (WARO). Your team has been assigned the responsibility of mapping the WARO Plan into a single strategy map. Each team will be assigned to a breakout room – use post it notes on the large white template sheets Try to limit your objective boxes on the strategy map to no more than 20 per our 4 to 5 Rule. If you have time, you might want to consider arranging or grouping certain objectives together around themes. Each team will provide a 10-minute brief. You have 90 minutes to complete the case study exercise. 56
TABLE OF CONTENTS I. Balanced Scorecard Basics II. Creating the Strategy Map III. Good Performance Measurements IV. The Final Scorecard Components V. Case Study Exercise VI. Some Final Points 57
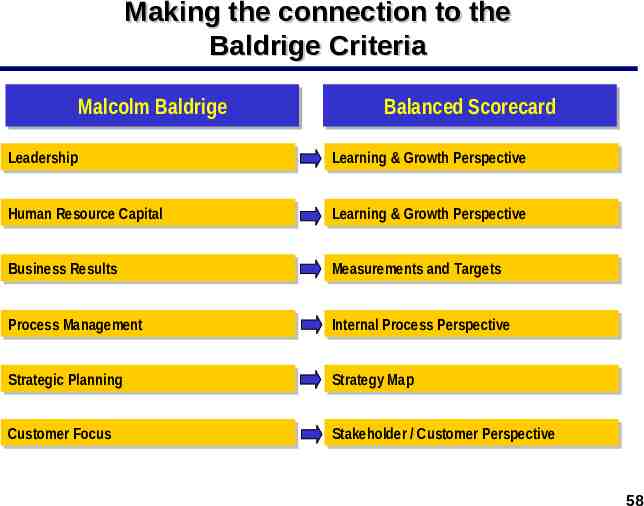
Making the connection to the Baldrige Criteria Malcolm Malcolm Baldrige Baldrige Balanced Balanced Scorecard Scorecard Leadership Leadership Learning Learning && Growth Growth Perspective Perspective Human Human Resource Resource Capital Capital Learning Learning && Growth Growth Perspective Perspective Business Business Results Results Measurements Measurements and and Targets Targets Process Process Management Management Internal Internal Process Process Perspective Perspective Strategic Strategic Planning Planning Strategy Strategy Map Map Customer Customer Focus Focus Stakeholder Stakeholder // Customer Customer Perspective Perspective 58
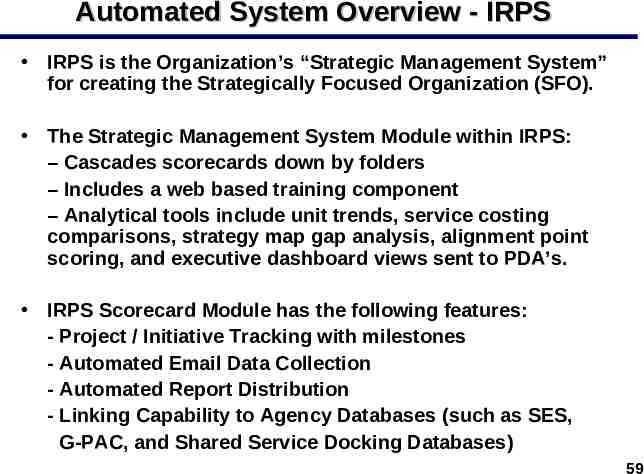
Automated System Overview - IRPS IRPS is the Organization’s “Strategic Management System” for creating the Strategically Focused Organization (SFO). The Strategic Management System Module within IRPS: – Cascades scorecards down by folders – Includes a web based training component – Analytical tools include unit trends, service costing comparisons, strategy map gap analysis, alignment point scoring, and executive dashboard views sent to PDA’s. IRPS Scorecard Module has the following features: - Project / Initiative Tracking with milestones - Automated Email Data Collection - Automated Report Distribution - Linking Capability to Agency Databases (such as SES, G-PAC, and Shared Service Docking Databases) 59
Highlight Important Steps Cascade and align strategy down to the Outlet level (and beyond – personal scorecards) where execution takes place. Capture cause effect linkages as you cascade and align down. This will ensure that all of the Agency is moving in the same strategic direction. Identify and commit to projects and initiatives that will drive strategic execution. Establish performance outcomes in the form of measurements and targets. Review results on a regular basis within the Quarterly Leadership Briefings using the Balanced Scorecard framework. 60
Additional Information Training Slides (1) Performance Based Handbook (1) Performance Measurement Tool Kit (1) Formal Training: – Offered Quarterly at the Central and Western Region Offices – Annual Leadership Conference – 2 Hour Workshop Web Based Training: – IRPS SMS – Option 6, self serve registration (1) Posted on the internet at: www.exinfm.com/workshop.html Contact Information: Matt Evans, [email protected],877-689-4097 61