Chapter 6 Process Design and Facility Layout 1


73 Slides832.50 KB
Chapter 6 Process Design and Facility Layout 1
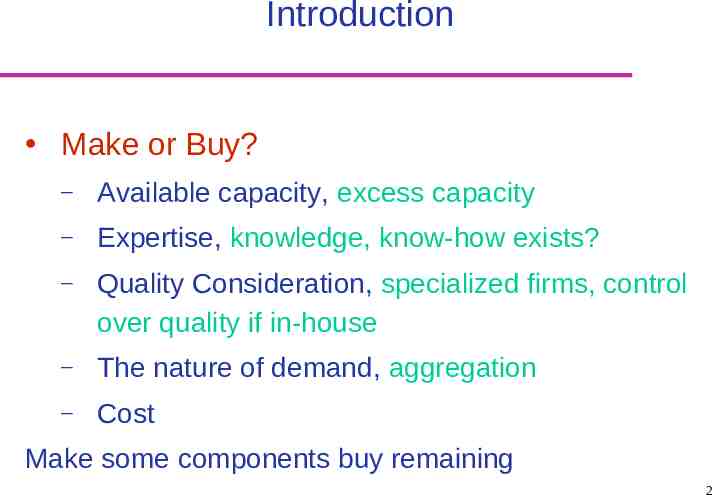
Introduction Make or Buy? – Available capacity, excess capacity – Expertise, knowledge, know-how exists? – Quality Consideration, specialized firms, control over quality if in-house – The nature of demand, aggregation – Cost Make some components buy remaining 2
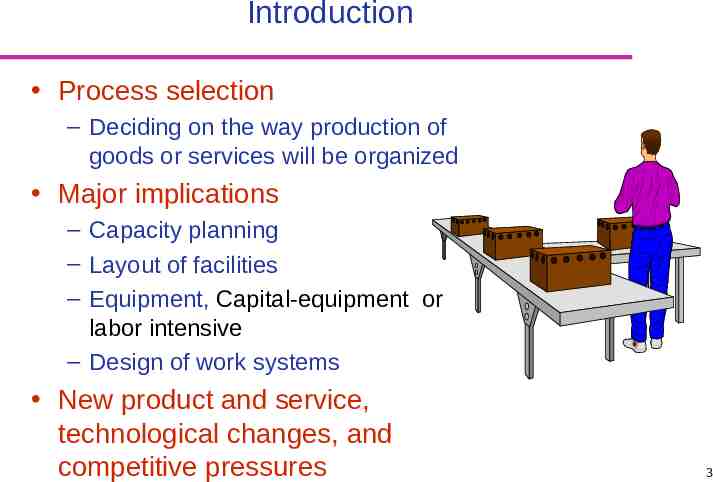
Introduction Process selection – Deciding on the way production of goods or services will be organized Major implications – Capacity planning – Layout of facilities – Equipment, Capital-equipment or labor intensive – Design of work systems New product and service, technological changes, and competitive pressures 3
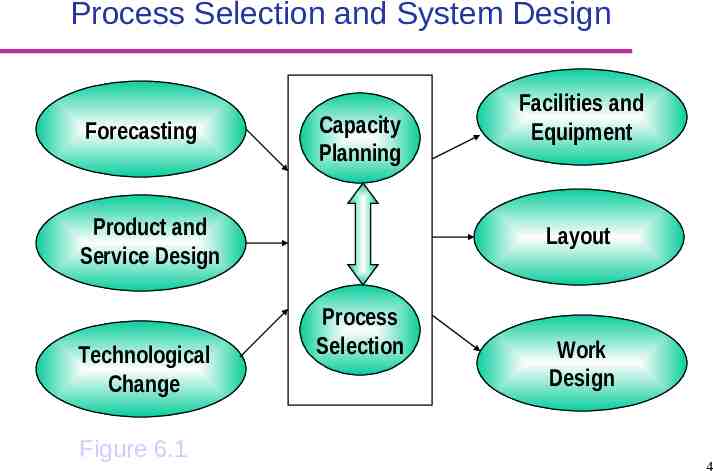
Process Selection and System Design Forecasting Capacity Planning Product and Service Design Technological Change Figure 6.1 Facilities and Equipment Layout Process Selection Work Design 4
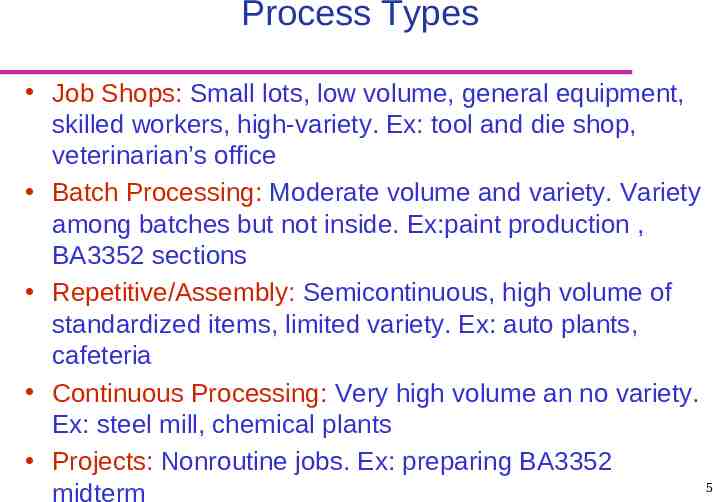
Process Types Job Shops: Small lots, low volume, general equipment, skilled workers, high-variety. Ex: tool and die shop, veterinarian’s office Batch Processing: Moderate volume and variety. Variety among batches but not inside. Ex:paint production , BA3352 sections Repetitive/Assembly: Semicontinuous, high volume of standardized items, limited variety. Ex: auto plants, cafeteria Continuous Processing: Very high volume an no variety. Ex: steel mill, chemical plants Projects: Nonroutine jobs. Ex: preparing BA3352 5 midterm
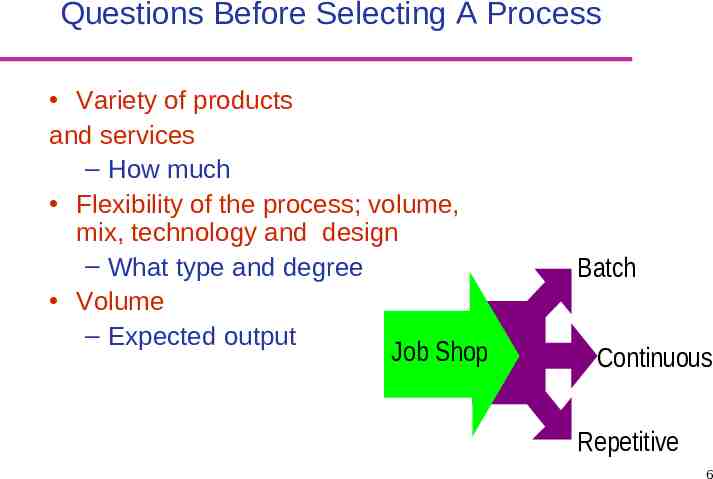
Questions Before Selecting A Process Variety of products and services – How much Flexibility of the process; volume, mix, technology and design – What type and degree Volume – Expected output Job Shop Batch Continuous Repetitive 6
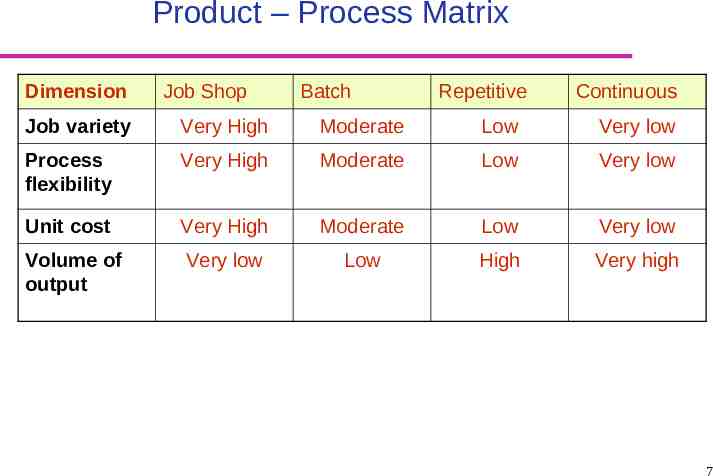
Product – Process Matrix Dimension Job Shop Batch Repetitive Continuous Job variety Very High Moderate Low Very low Process flexibility Very High Moderate Low Very low Unit cost Very High Moderate Low Very low Volume of output Very low Low High Very high 7
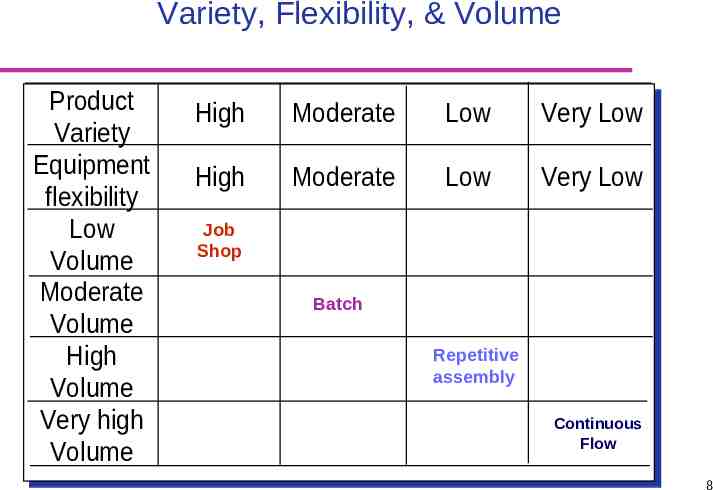
Variety, Flexibility, & Volume Product Product Variety Variety Equipment Equipment flexibility flexibility Low Low Volume Volume Moderate Moderate Volume Volume High High Volume Volume Very Veryhigh high Volume Volume High High Moderate Moderate Low Low Very VeryLow Low High High Moderate Moderate Low Low Very VeryLow Low Job Shop Batch Repetitive assembly Continuous Flow 8
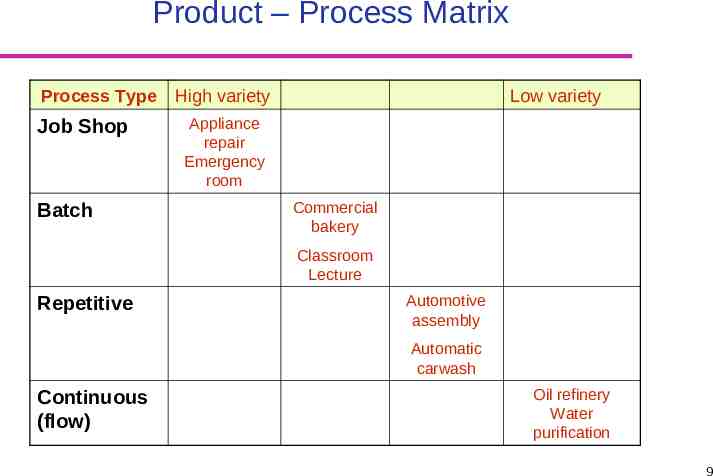
Product – Process Matrix Process Type High variety Job Shop Batch Low variety Appliance repair Emergency room Commercial bakery Classroom Lecture Repetitive Automotive assembly Automatic carwash Continuous (flow) Oil refinery Water purification 9
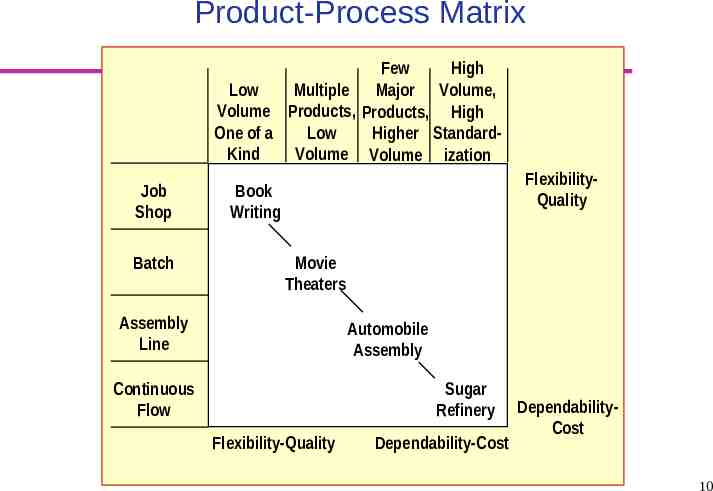
Product-Process Matrix Few High Low Multiple Major Volume, Volume Products, Products, High One of a Low Higher StandardKind Volume Volume ization Job Shop Batch FlexibilityQuality Book Writing Movie Theaters Assembly Line Automobile Assembly Continuous Flow Sugar Refinery Flexibility-Quality Dependability-Cost DependabilityCost 10
Automation: Machinery that has sensing and control devices that enables it to operate Fixed automation: Low production cost and high volume but with minimal variety and high changes cost – Assembly line Programmable automation: Economically producing a wide variety of low volume products in small batches – Computer-aided design and manufacturing systems (CAD/CAM) – Numerically controlled (NC) machines / CNC – Industrial robots (arms) Flexible automation: Require less changeover time and allow continuous operation of equipment and product variety – Manufacturing cell – Flexible manufacturing systems: Use of high automation to achieve repetitive process efficiency with job shop process Automated retrieval and storage Automated guided vehicles – Computer-integrated manufacturing (CIM) 11
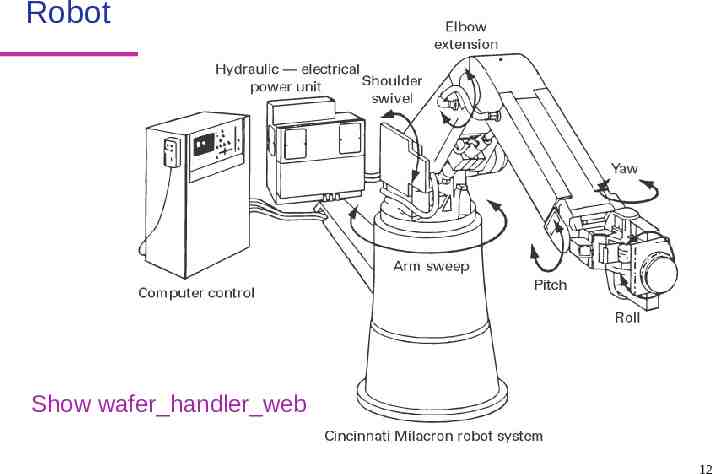
Robot Show wafer handler web 12
Flexible Manufacturing System Group of machines that include supervisory computer control, automatic material handling, robots and other processing equipment – Advantage: reduce labor costs and more consistent quality lower capital investment and higher flexibility than hard automation relative quick changeover time – Disadvantage used for a family of products and require longer planning and development times 13
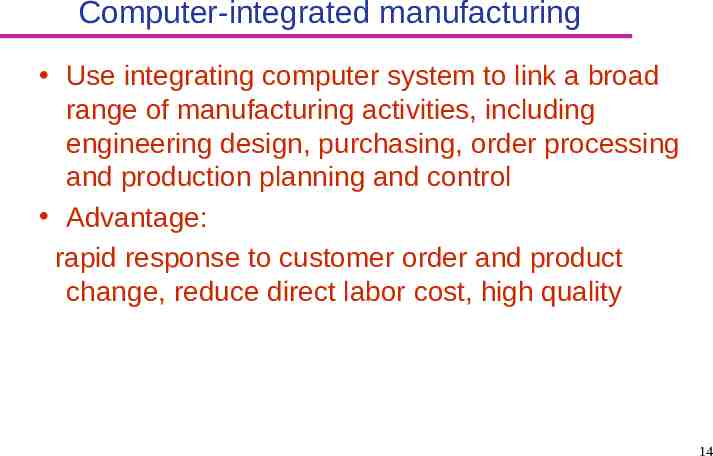
Computer-integrated manufacturing Use integrating computer system to link a broad range of manufacturing activities, including engineering design, purchasing, order processing and production planning and control Advantage: rapid response to customer order and product change, reduce direct labor cost, high quality 14
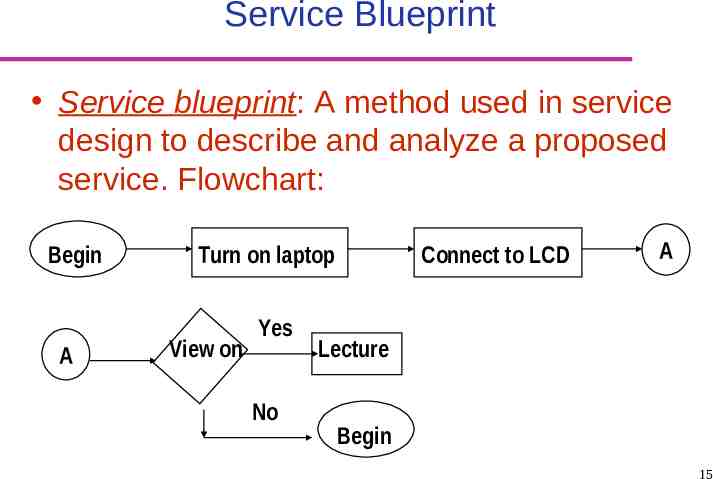
Service Blueprint Service blueprint: A method used in service design to describe and analyze a proposed service. Flowchart: Begin A Turn on laptop View on Yes No Connect to LCD A Lecture Begin 15
Service Process Design Establish boundaries Identify steps involved Prepare a flowchart Identify potential failure points Establish a time frame for operations Analyze profitability 16
Layout Layout: the configuration of departments, work centers, and equipment, – Whose design involves particular emphasis on movement of work (customers or materials) through the system Importance of layout – Requires substantial investments of money and effort – Involves long-term commitments – Has significant impact on cost and efficiency of shortterm operations 17
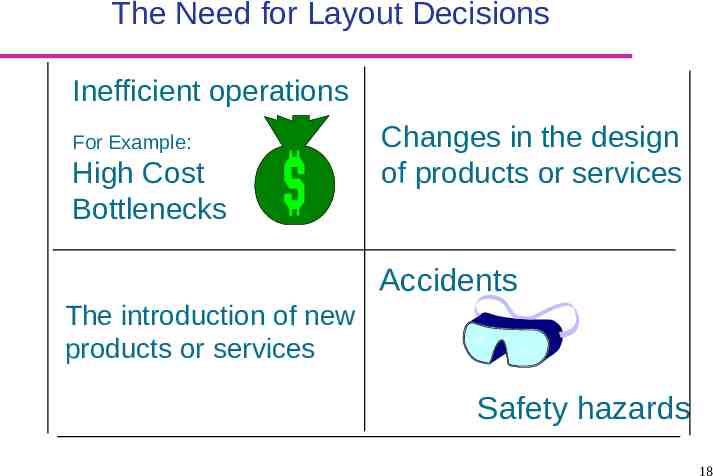
The Need for Layout Decisions Inefficient operations For Example: High Cost Bottlenecks Changes in the design of products or services Accidents The introduction of new products or services Safety hazards 18
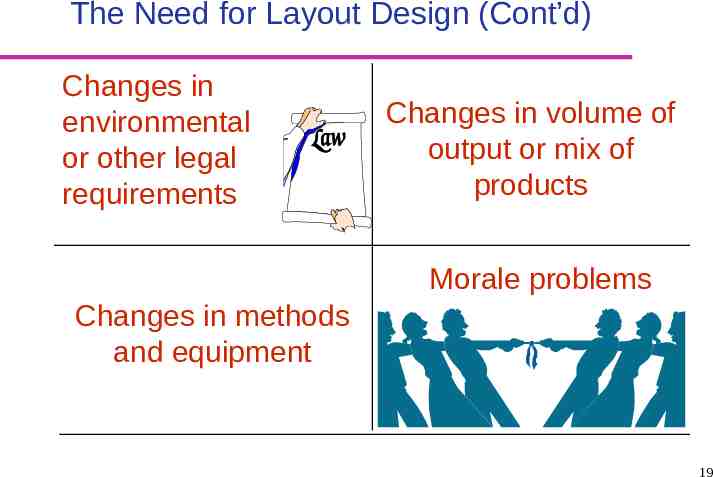
The Need for Layout Design (Cont’d) Changes in environmental or other legal requirements Changes in volume of output or mix of products Morale problems Changes in methods and equipment 19
Basic Layout Types Product Layout – Layout that uses standardized processing operations to achieve smooth, rapid, high-volume flow Auto plants, cafeterias Process Layout – Layout that can handle varied processing requirements Tool and die shops, university departments Fixed Position Layout – Layout in which the product or project remains stationary, and workers, materials, and equipment are moved as needed Building projects, disabled patients at hospitals Combination Layouts 20
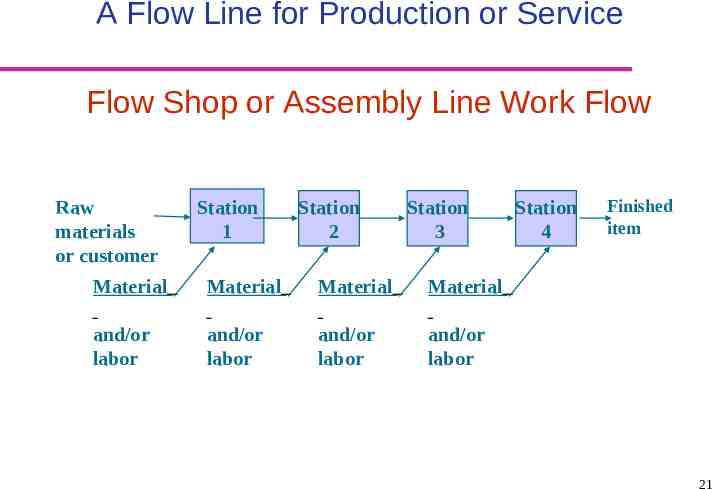
A Flow Line for Production or Service Flow Shop or Assembly Line Work Flow Raw materials or customer Station 1 Station 2 Station 3 Material Material Material Material and/or labor and/or labor and/or labor and/or labor Station 4 Finished item 21
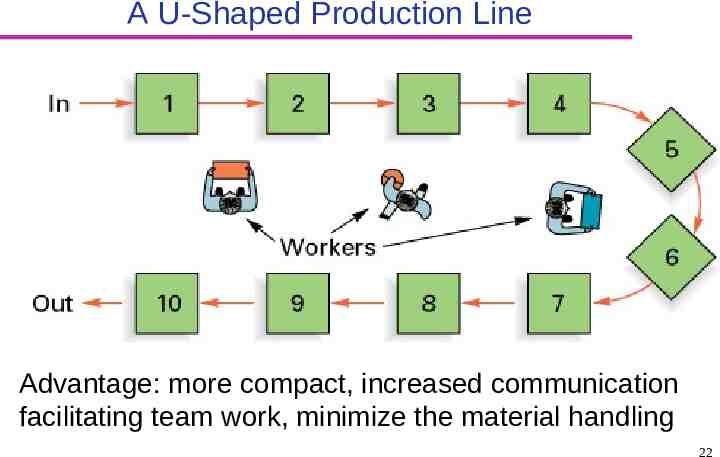
A U-Shaped Production Line Advantage: more compact, increased communication facilitating team work, minimize the material handling 22
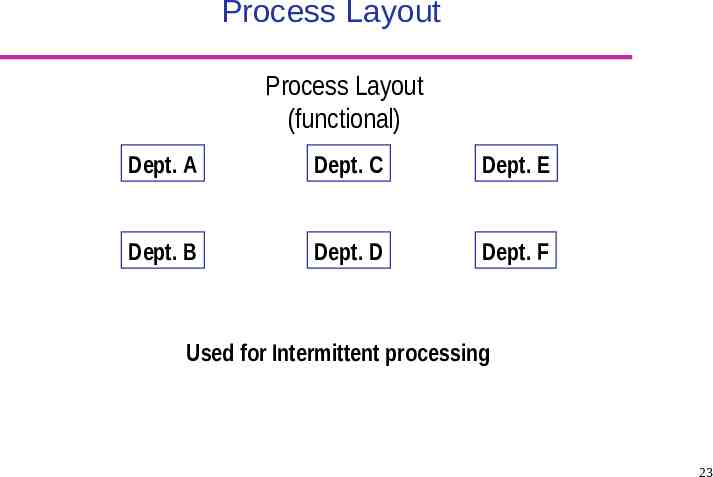
Process Layout Process Layout (functional) Dept. A Dept. C Dept. E Dept. B Dept. D Dept. F Used for Intermittent processing 23
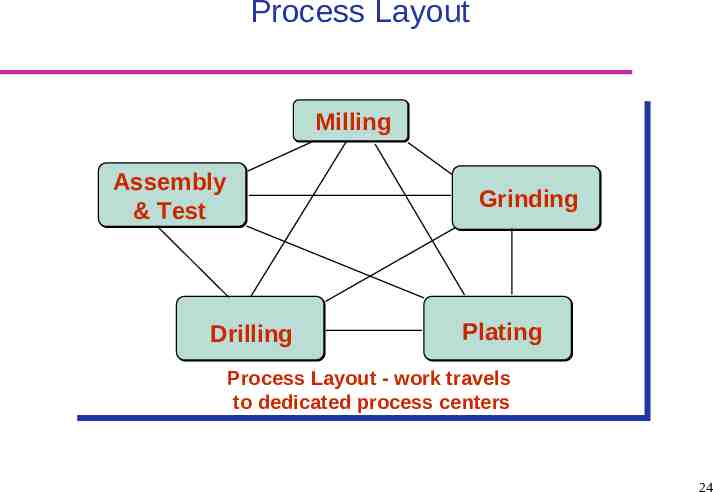
Process Layout Milling Assembly & Test Grinding Drilling Plating Process Layout - work travels to dedicated process centers 24
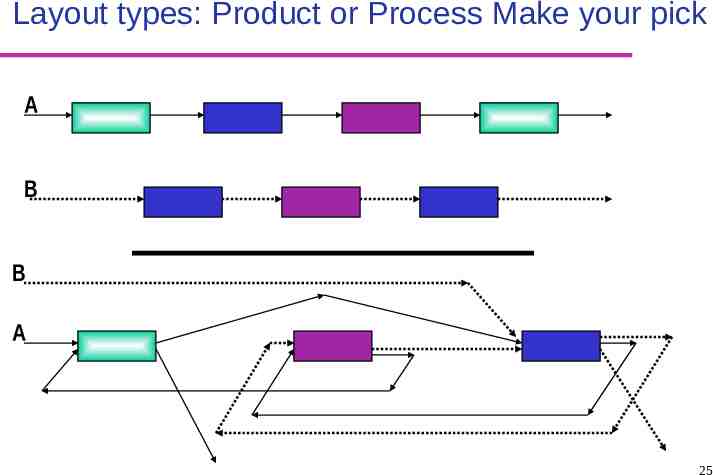
Layout types: Product or Process Make your pick A B B A 25
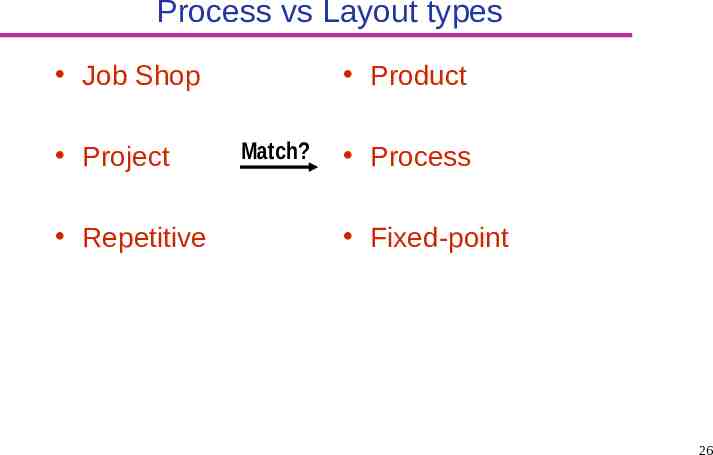
Process vs Layout types Job Shop Project Repetitive Product Match? Process Fixed-point 26
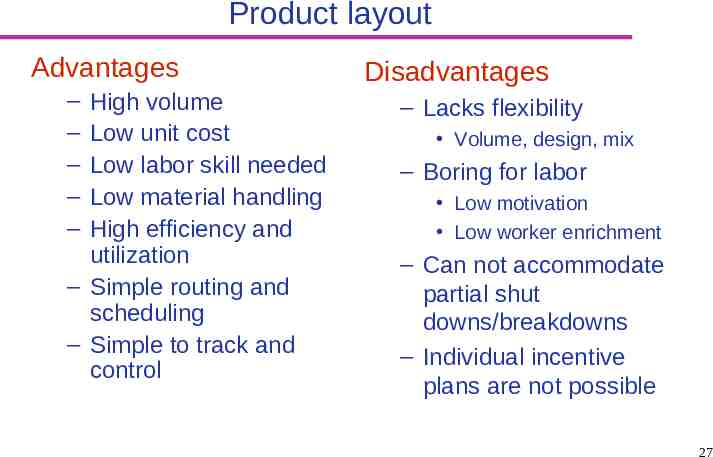
Product layout Advantages – – – – – High volume Low unit cost Low labor skill needed Low material handling High efficiency and utilization – Simple routing and scheduling – Simple to track and control Disadvantages – Lacks flexibility Volume, design, mix – Boring for labor Low motivation Low worker enrichment – Can not accommodate partial shut downs/breakdowns – Individual incentive plans are not possible 27
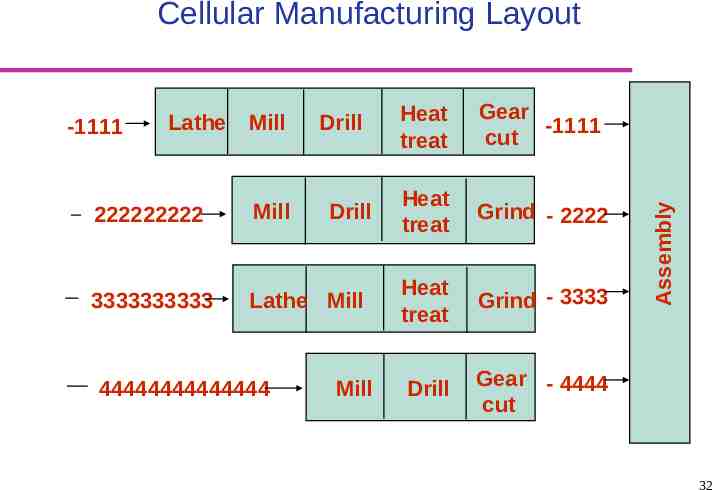
Cellular Layouts Cellular Manufacturing – Layout in which machines are grouped into a cell that can process items that have similar processing requirements. A product layout is visible inside each cell. Group Technology – The grouping into part families of items with similar design or manufacturing characteristics. Each cell is assigned a family for production. This limits the production variability inside cells, hence allowing for a product layout. 28
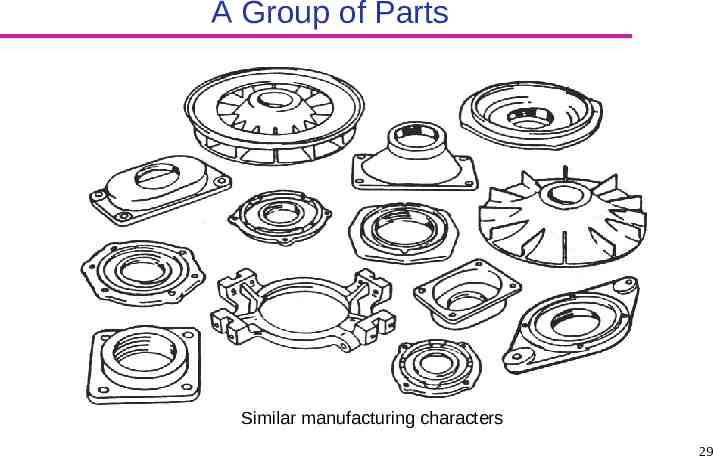
A Group of Parts Similar manufacturing characters 29
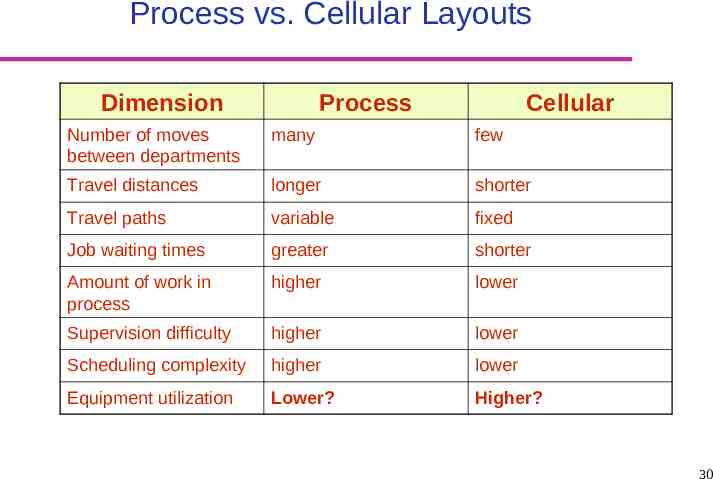
Process vs. Cellular Layouts Dimension Process Cellular Number of moves between departments many few Travel distances longer shorter Travel paths variable fixed Job waiting times greater shorter Amount of work in process higher lower Supervision difficulty higher lower Scheduling complexity higher lower Equipment utilization Lower? Higher? 30
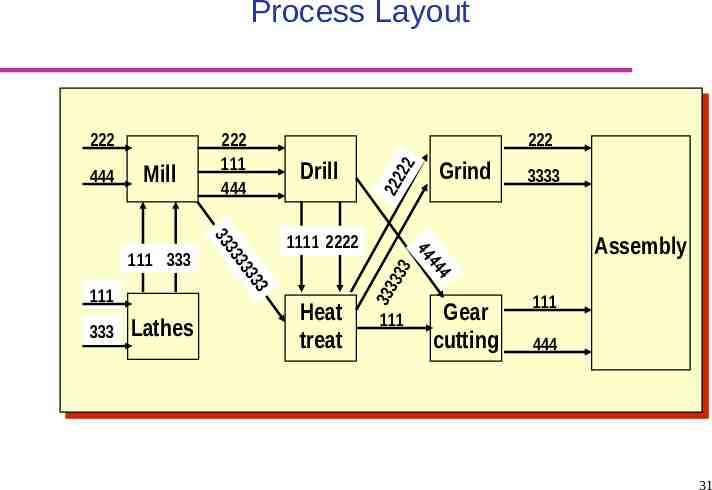
Process Layout Mill 333 Lathes Drill 1111 2222 Heat treat 111 Grind 3333 Assembly 4 44 44 111 3 33 33 33 33 111 333 222 222 22 444 222 111 444 333 333 222 Gear cutting 111 444 31
-1111 Lathe Mill Drill 222222222 Mill 3333333333 Lathe Mill 44444444444444 Drill Mill Heat treat Gear -1111 cut Heat treat Grind - 2222 Heat treat Grind - 3333 Drill Gear - 4444 cut Assembly Cellular Manufacturing Layout 32
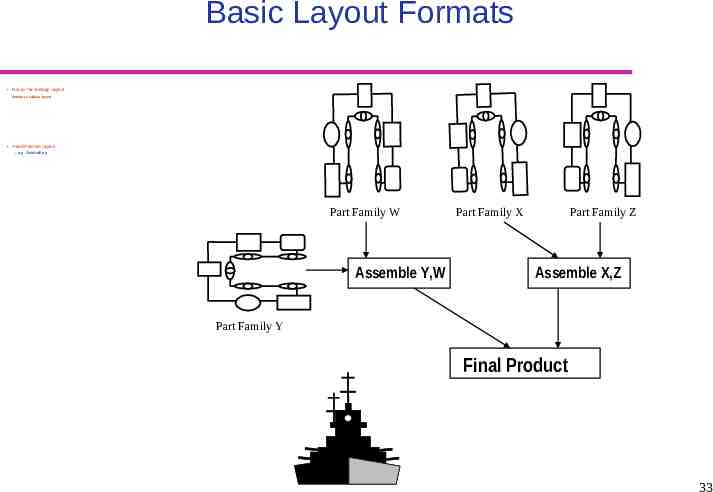
Basic Layout Formats Group Technology Layout Similar to cellular layout Fixed Position Layout – e.g. Shipbuilding Part Family W Assemble Y,W Part Family X Part Family Z Assemble X,Z Part Family Y Final Product 33
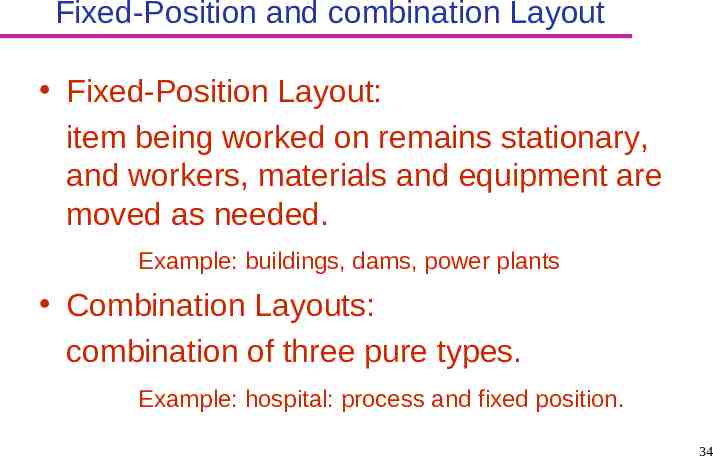
Fixed-Position and combination Layout Fixed-Position Layout: item being worked on remains stationary, and workers, materials and equipment are moved as needed. Example: buildings, dams, power plants Combination Layouts: combination of three pure types. Example: hospital: process and fixed position. 34
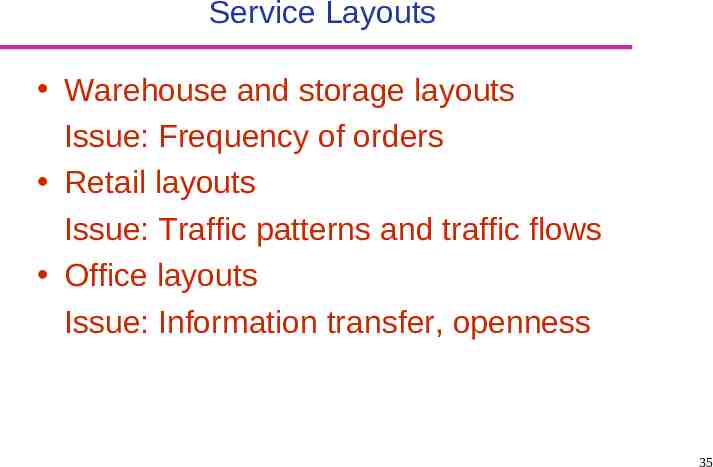
Service Layouts Warehouse and storage layouts Issue: Frequency of orders Retail layouts Issue: Traffic patterns and traffic flows Office layouts Issue: Information transfer, openness 35
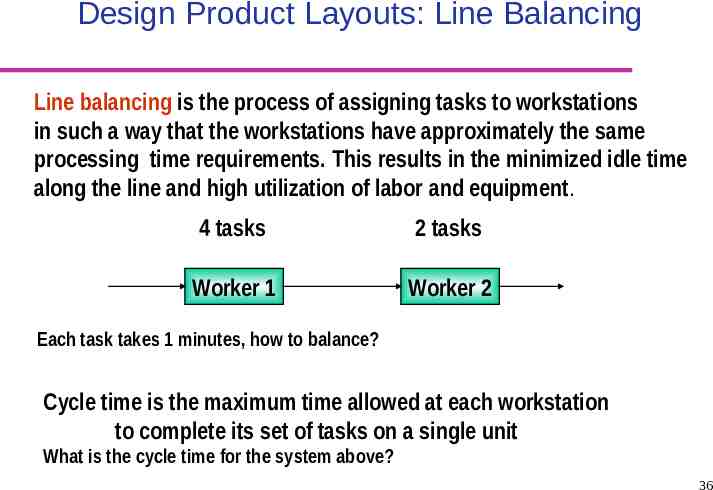
Design Product Layouts: Line Balancing Line balancing is the process of assigning tasks to workstations in such a way that the workstations have approximately the same processing time requirements. This results in the minimized idle time along the line and high utilization of labor and equipment. 4 tasks 2 tasks Worker 1 Worker 2 Each task takes 1 minutes, how to balance? Cycle time is the maximum time allowed at each workstation to complete its set of tasks on a single unit What is the cycle time for the system above? 36
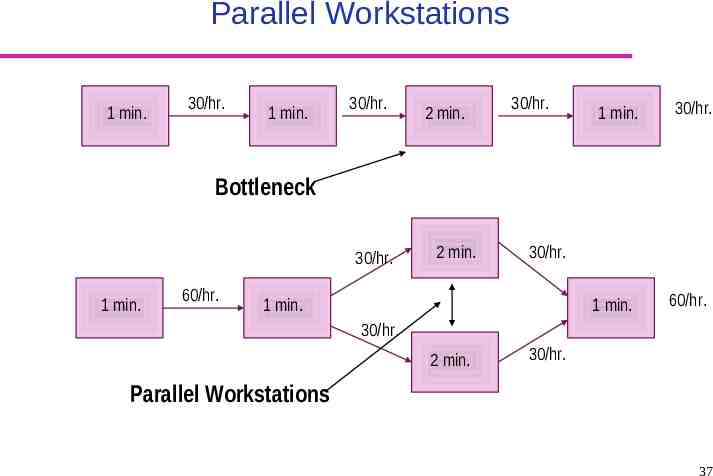
Parallel Workstations 1 min. 30/hr. 1 min. 30/hr. 2 min. 30/hr. 1 min. 30/hr. Bottleneck 30/hr. 1 min. 60/hr. 2 min. 30/hr. 1 min. 1 min. 60/hr. 30/hr. 2 min. 30/hr. Parallel Workstations 37
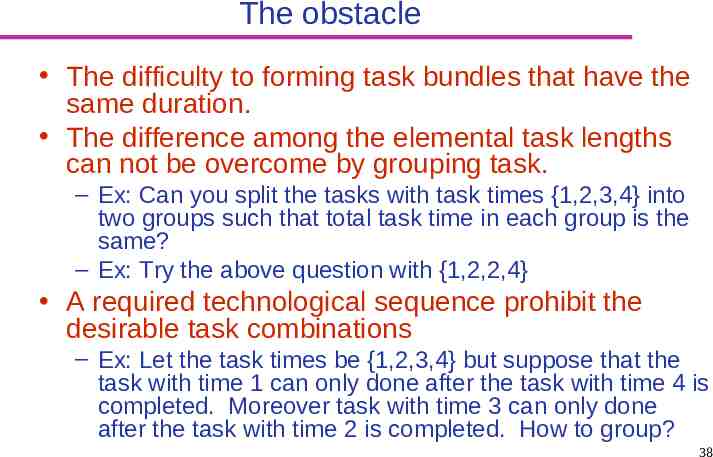
The obstacle The difficulty to forming task bundles that have the same duration. The difference among the elemental task lengths can not be overcome by grouping task. – Ex: Can you split the tasks with task times {1,2,3,4} into two groups such that total task time in each group is the same? – Ex: Try the above question with {1,2,2,4} A required technological sequence prohibit the desirable task combinations – Ex: Let the task times be {1,2,3,4} but suppose that the task with time 1 can only done after the task with time 4 is completed. Moreover task with time 3 can only done after the task with time 2 is completed. How to group? 38
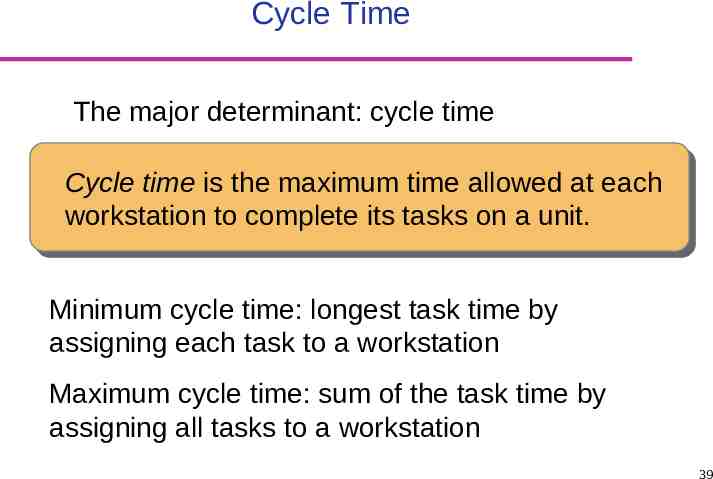
Cycle Time The major determinant: cycle time Cycle time is the maximum time allowed at each workstation to complete its tasks on a unit. Minimum cycle time: longest task time by assigning each task to a workstation Maximum cycle time: sum of the task time by assigning all tasks to a workstation 39
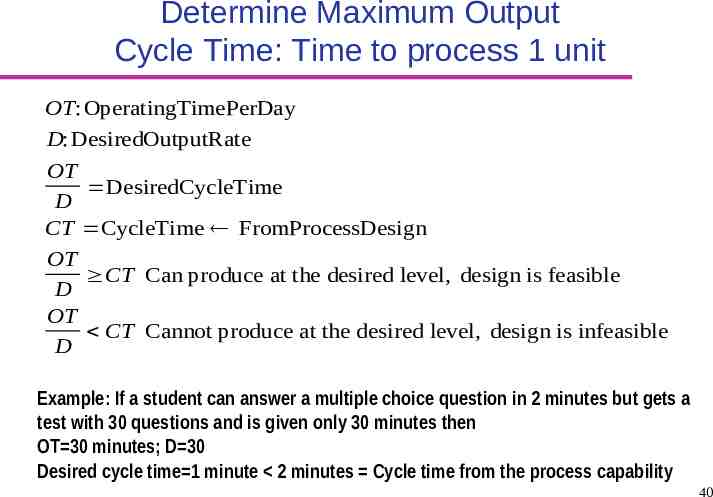
Determine Maximum Output Cycle Time: Time to process 1 unit OT: OperatingTimePerDay D: DesiredOutputRate OT DesiredCycleTime D CT CycleTime FromProcessDesign OT CT Can produce at the desired level, design is feasible D OT CT Cannot produce at the desired level, design is infeasible D Example: If a student can answer a multiple choice question in 2 minutes but gets a test with 30 questions and is given only 30 minutes then OT 30 minutes; D 30 Desired cycle time 1 minute 2 minutes Cycle time from the process capability 40
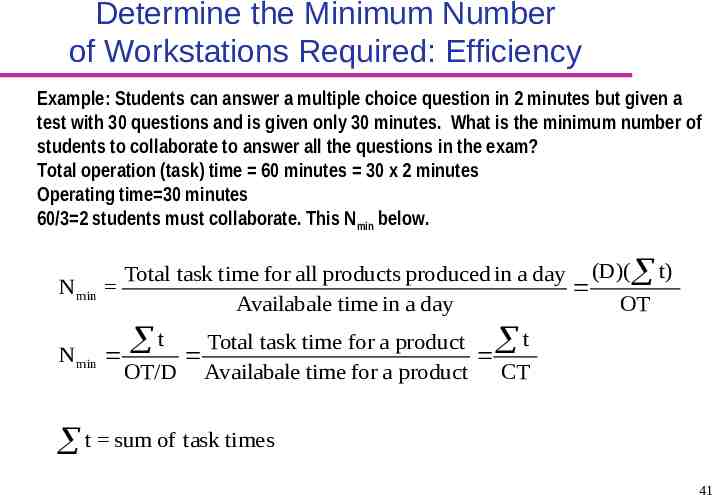
Determine the Minimum Number of Workstations Required: Efficiency Example: Students can answer a multiple choice question in 2 minutes but given a test with 30 questions and is given only 30 minutes. What is the minimum number of students to collaborate to answer all the questions in the exam? Total operation (task) time 60 minutes 30 x 2 minutes Operating time 30 minutes 60/3 2 students must collaborate. This Nmin below. N min Total task time for all products produced in a day (D)( t) Availabale time in a day OT N min t Total task time for a product t OT/D Availabale time for a product CT t sum of task times 41
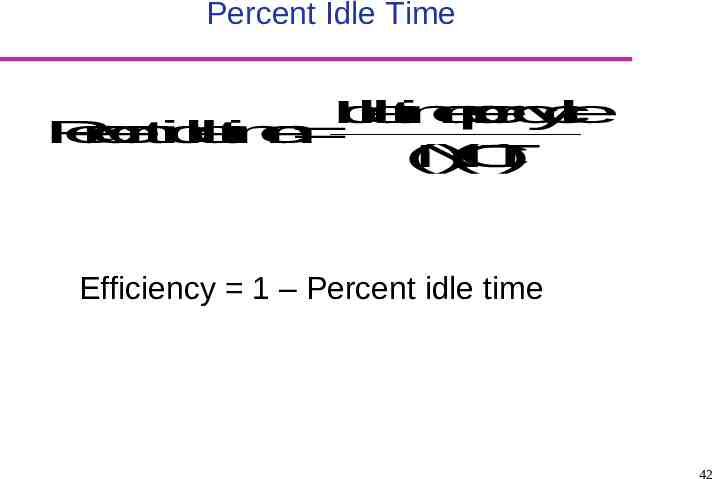
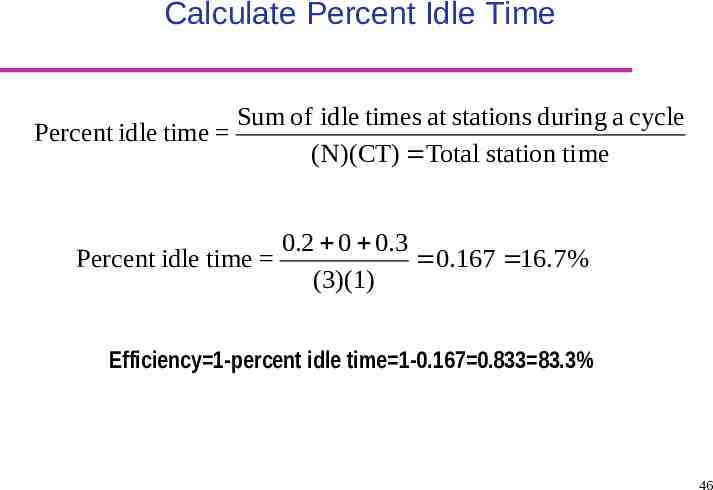
Percent Idle Time I d le t im e p e rc y c le P e r c e n tid le t im e ( N ) ( C T ) Efficiency 1 – Percent idle time 42
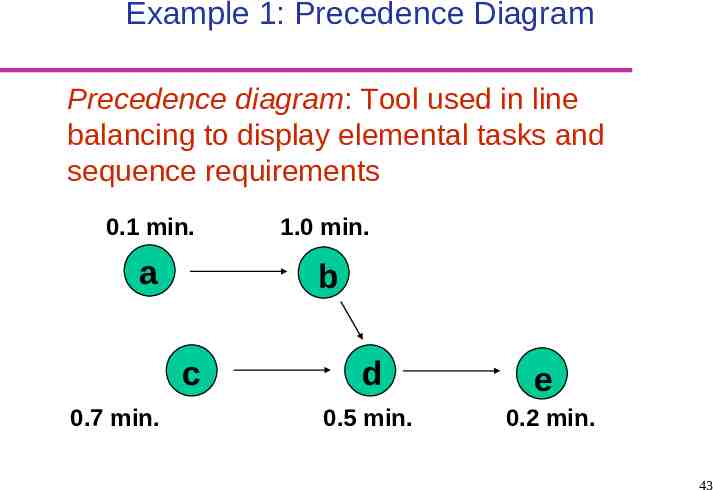
Example 1: Precedence Diagram Precedence diagram: Tool used in line balancing to display elemental tasks and sequence requirements 0.1 min. 1.0 min. a b c 0.7 min. d 0.5 min. e 0.2 min. 43
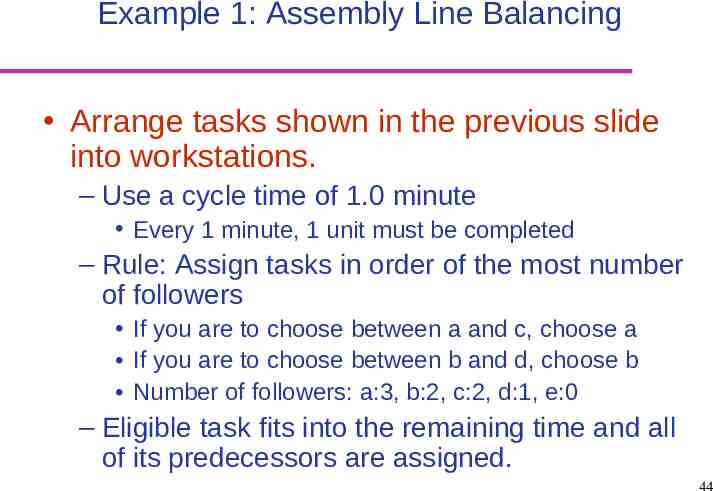
Example 1: Assembly Line Balancing Arrange tasks shown in the previous slide into workstations. – Use a cycle time of 1.0 minute Every 1 minute, 1 unit must be completed – Rule: Assign tasks in order of the most number of followers If you are to choose between a and c, choose a If you are to choose between b and d, choose b Number of followers: a:3, b:2, c:2, d:1, e:0 – Eligible task fits into the remaining time and all of its predecessors are assigned. 44
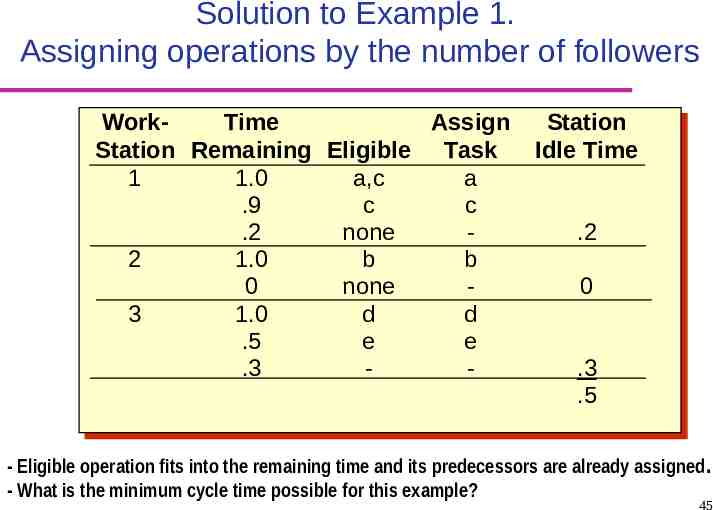
Solution to Example 1. Assigning operations by the number of followers WorkTime Assign WorkTime Assign Station Station Station Station Remaining Remaining Eligible Eligible Task Task Idle IdleTime Time 11 1.0 a,c aa 1.0 a,c .9 cc cc .9 .2 none -.2 .2 none .2 22 1.0 bb bb 1.0 00 none -00 none 33 1.0 dd dd 1.0 .5 ee ee .5 .3 --.3 .3 .3 .5 .5 - Eligible operation fits into the remaining time and its predecessors are already assigned . - What is the minimum cycle time possible for this example? 45
Calculate Percent Idle Time Sum of idle times at stations during a cycle Percent idle time (N)(CT) Total station ti me 0.2 0 0.3 Percent idle time 0.167 16.7% (3)(1) Efficiency 1-percent idle time 1-0.167 0.833 83.3% 46
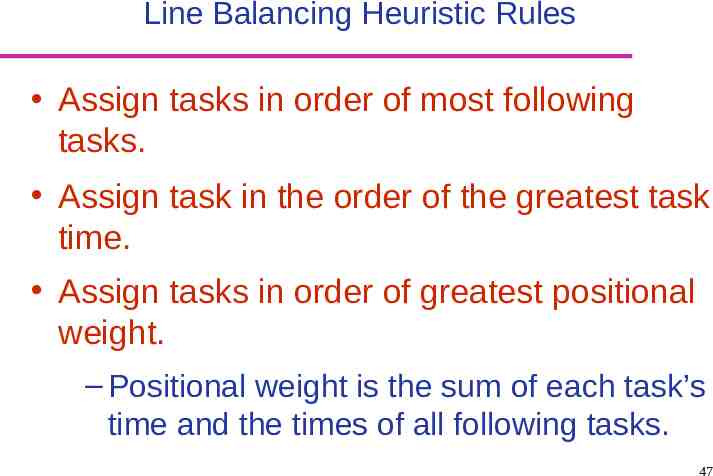
Line Balancing Heuristic Rules Assign tasks in order of most following tasks. Assign task in the order of the greatest task time. Assign tasks in order of greatest positional weight. – Positional weight is the sum of each task’s time and the times of all following tasks. 47
Solution to Example 1. Assigning operations using their task times. WorkTime Assign WorkTime Assign Station Station Station Station Remaining Remaining Eligible Eligible Task Task Idle IdleTime Time 11 1.0 a,c cc 1.0 a,c .9 aa aa .9 .2 none -.2 .2 none .2 22 1.0 bb bb 1.0 00 none -00 none 33 1.0 dd dd 1.0 .5 ee ee .5 .3 --.3 .3 .3 .5 .5 Eligible operation fits into the remaining time and its predecessors are already assigned . 48
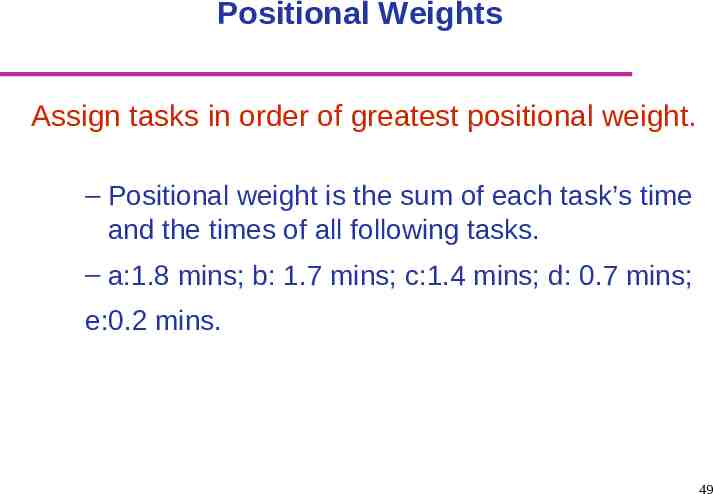
Positional Weights Assign tasks in order of greatest positional weight. – Positional weight is the sum of each task’s time and the times of all following tasks. – a:1.8 mins; b: 1.7 mins; c:1.4 mins; d: 0.7 mins; e:0.2 mins. 49
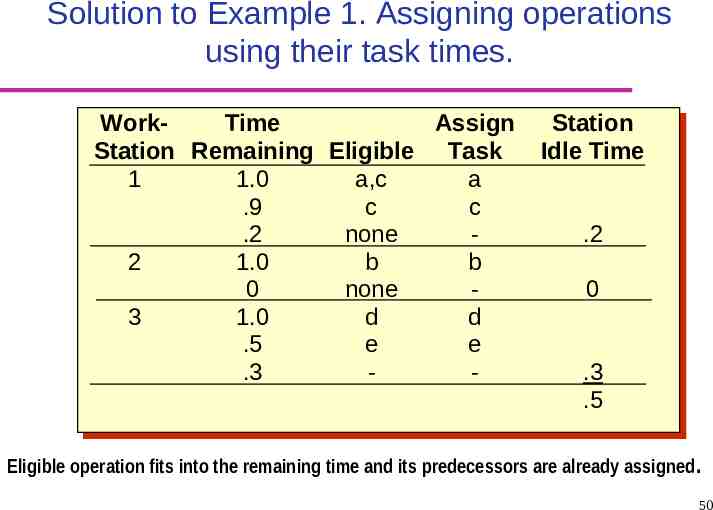
Solution to Example 1. Assigning operations using their task times. WorkTime Assign WorkTime Assign Station Station Station Station Remaining Remaining Eligible Eligible Task Task Idle IdleTime Time 11 1.0 a,c aa 1.0 a,c .9 cc cc .9 .2 none -.2 .2 none .2 22 1.0 bb bb 1.0 00 none -00 none 33 1.0 dd dd 1.0 .5 ee ee .5 .3 --.3 .3 .3 .5 .5 Eligible operation fits into the remaining time and its predecessors are already assigned . 50
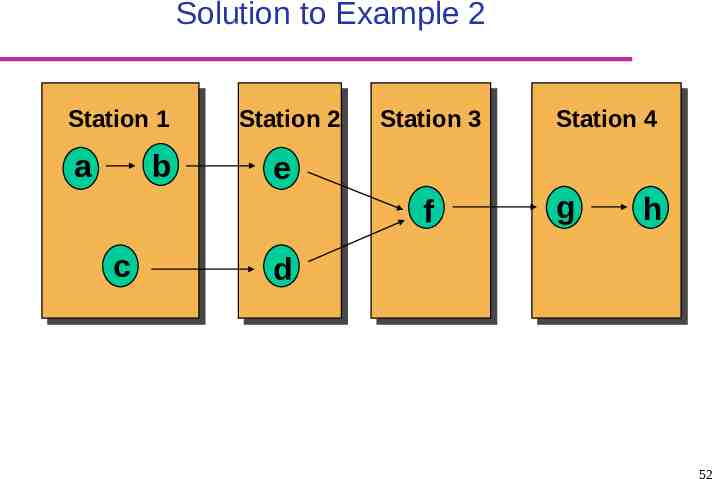
Example 2 0.2 0.2 0.3 a b e 0.8 0.6 c d f g h 1.0 0.4 0.3 51
Solution to Example 2 Station 1 a b Station 2 Station 3 e f c Station 4 g h d 52
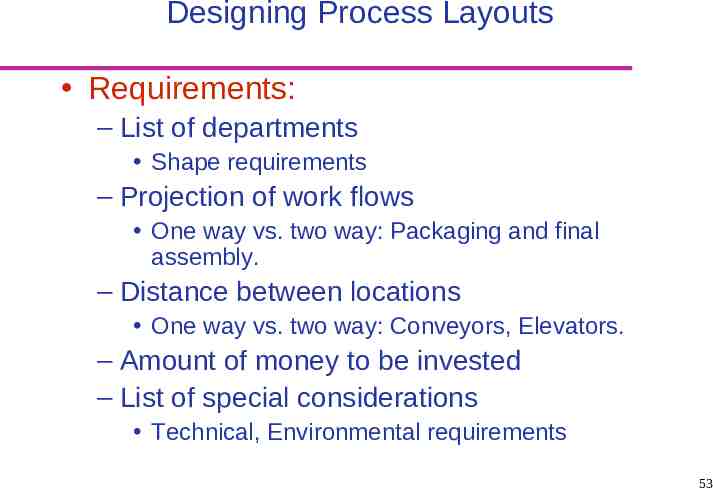
Designing Process Layouts Requirements: – List of departments Shape requirements – Projection of work flows One way vs. two way: Packaging and final assembly. – Distance between locations One way vs. two way: Conveyors, Elevators. – Amount of money to be invested – List of special considerations Technical, Environmental requirements 53
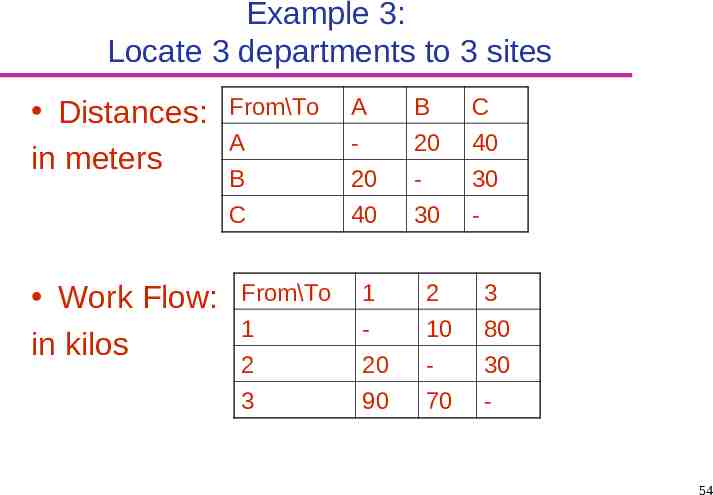
Example 3: Locate 3 departments to 3 sites Distances: in meters Work Flow: in kilos From\To A B C A - 20 40 B 20 - 30 C 40 30 - From\To 1 2 3 1 - 10 80 2 20 - 30 3 90 70 - 54
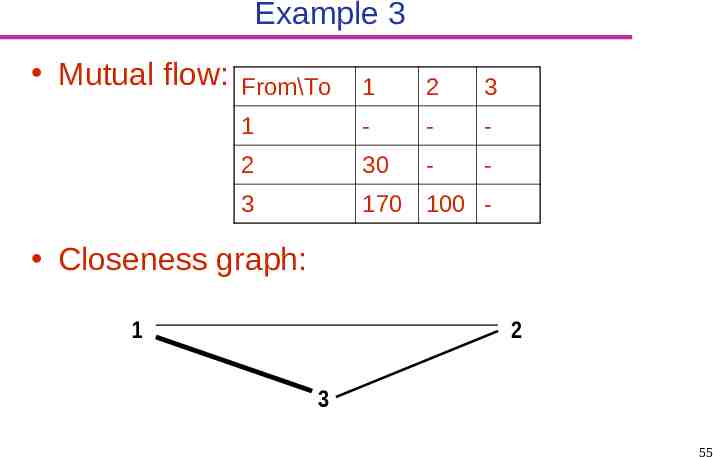
Example 3 Mutual flow: From\To 1 2 3 1 - - - 2 30 - - 3 170 100 - Closeness graph: 1 2 3 55
Designing Process Layouts Create Layout Alternatives Find the one which minimizes transportation costs and distance traveled 56
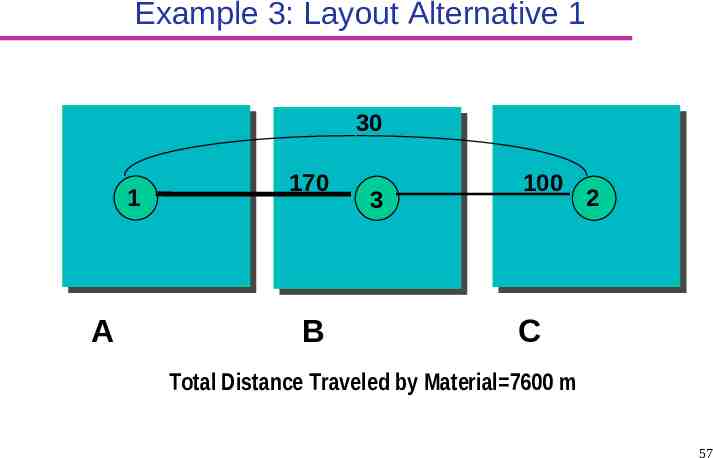
Example 3: Layout Alternative 1 30 1 A 170 B 3 100 2 C Total Distance Traveled by Material 7600 m 57
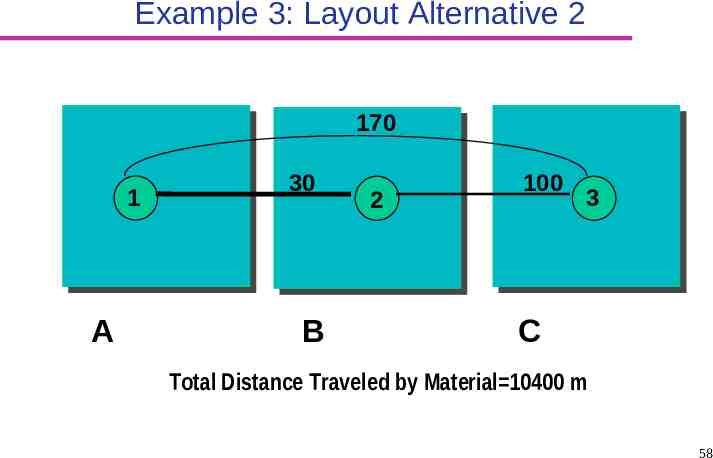
Example 3: Layout Alternative 2 170 1 A 30 B 2 100 3 C Total Distance Traveled by Material 10400 m 58
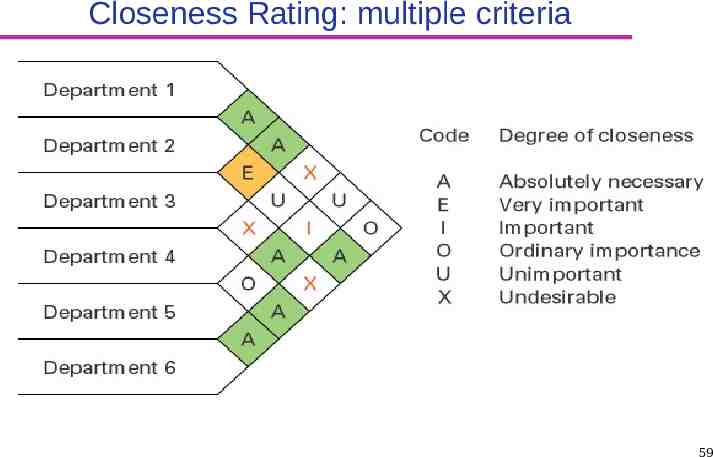
Closeness Rating: multiple criteria 59
Muther Grid Allow multiple objectives and subjective input from analysis or manager to indicate the relative importance of each combination of department pairs. Subjective inputs are imprecise and unreliable 60
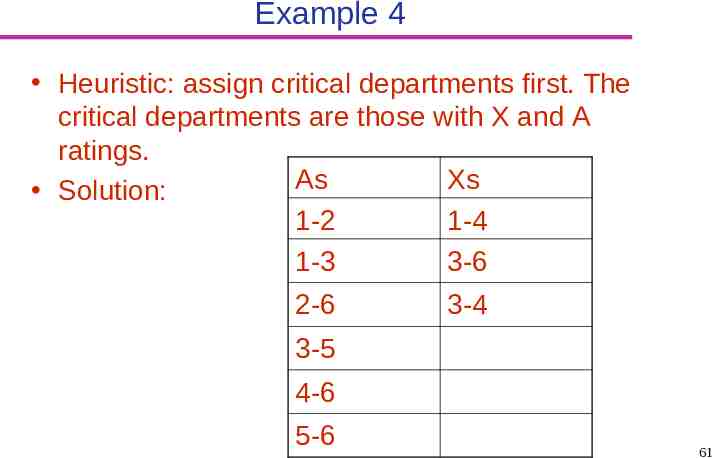
Example 4 Heuristic: assign critical departments first. The critical departments are those with X and A ratings. As Xs Solution: 1-2 1-4 1-3 3-6 2-6 3-4 3-5 4-6 5-6 61
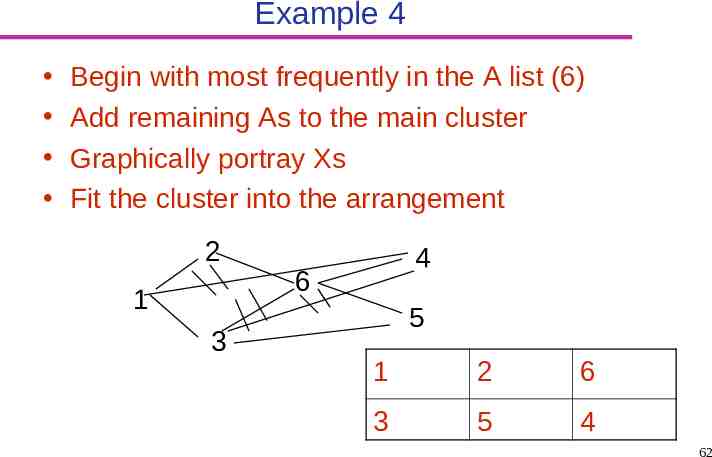
Example 4 Begin with most frequently in the A list (6) Add remaining As to the main cluster Graphically portray Xs Fit the cluster into the arrangement 2 1 3 4 6 5 1 2 6 3 5 4 62
Summary Process Selection Objective, Implication, types Product Layout Line balancing: procedures and measures Process layout Information requirements, measures From to chart and Muther grid 63
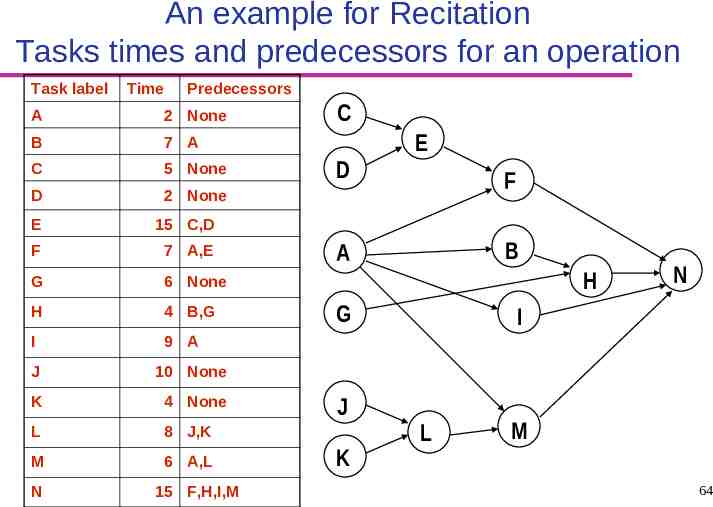
An example for Recitation Tasks times and predecessors for an operation Task label Time Predecessors A 2 None B 7 A C 5 None D 2 None E 15 C,D F 7 A,E G 6 None H 4 B,G I 9 A J 10 None K 4 None L 8 J,K M 6 A,L N 15 F,H,I,M C D E F A B G I J K H L N M 64
Recitation example Find a workstation assignment by taking cycle time 17 minutes by assigning in the order of the greatest task time. Can you find an assignment that uses only six stations and meets 17 minute cycle time requirement. See the solution in the next recitation. 65
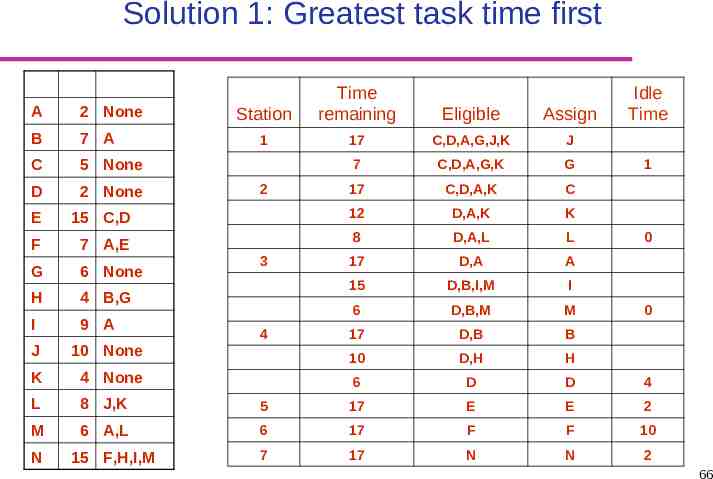
Solution 1: Greatest task time first A 2 None B 7 A C 5 None D 2 None Station Time remaining Eligible Assign 1 17 C,D,A,G,J,K J 7 C,D,A,G,K G 17 C,D,A,K C 2 E 15 C,D 12 D,A,K K F 7 A,E 8 D,A,L L G 6 None 17 D,A A H 4 B,G 15 D,B,I,M I I 9 A 6 D,B,M M 17 D,B B 3 4 Idle Time 1 0 0 J 10 None 10 D,H H K 4 None 6 D D 4 L 8 J,K 5 17 E E 2 M 6 A,L 6 17 F F 10 7 17 N N 2 N 15 F,H,I,M 66
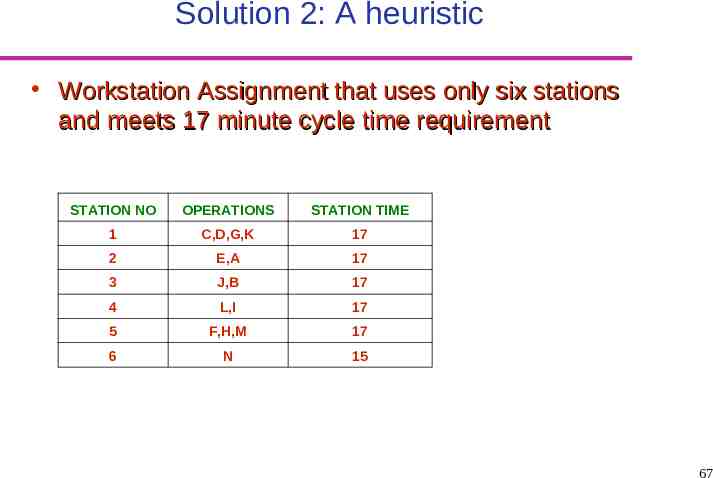
Solution 2: A heuristic Workstation Assignment that uses only six stations and meets 17 minute cycle time requirement STATION NO OPERATIONS STATION TIME 1 C,D,G,K 17 2 E,A 17 3 J,B 17 4 L,I 17 5 F,H,M 17 6 N 15 67
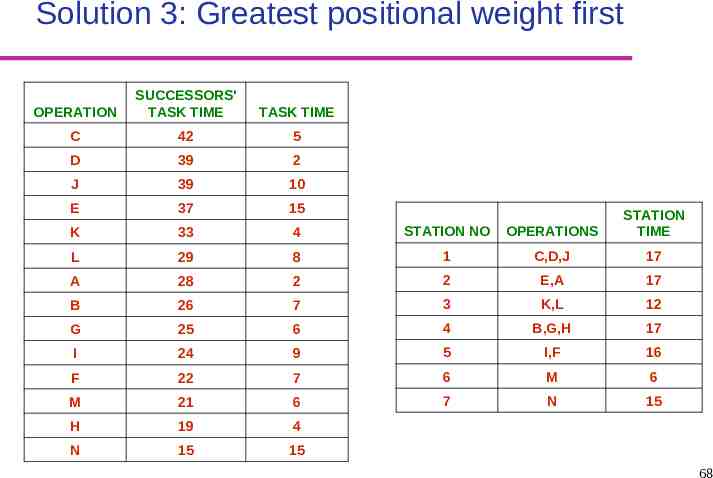
Solution 3: Greatest positional weight first OPERATION SUCCESSORS' TASK TIME TASK TIME C 42 5 D 39 2 J 39 10 E 37 15 K 33 4 STATION NO OPERATIONS STATION TIME L 29 8 1 C,D,J 17 A 28 2 2 E,A 17 B 26 7 3 K,L 12 G 25 6 4 B,G,H 17 I 24 9 5 I,F 16 F 22 7 6 M 6 M 21 6 7 N 15 H 19 4 N 15 15 68
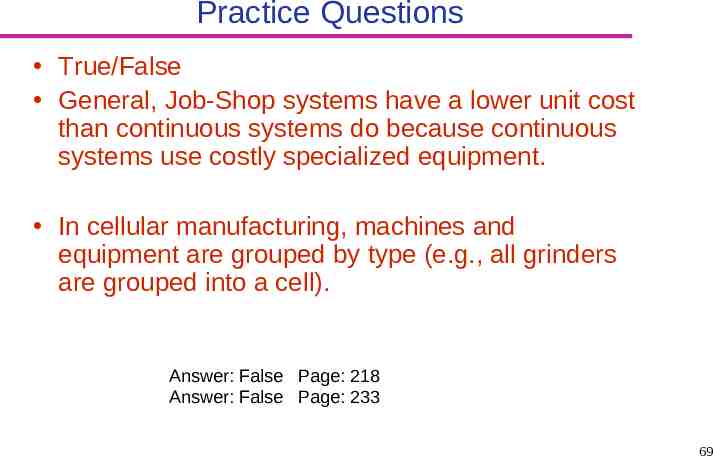
Practice Questions True/False General, Job-Shop systems have a lower unit cost than continuous systems do because continuous systems use costly specialized equipment. In cellular manufacturing, machines and equipment are grouped by type (e.g., all grinders are grouped into a cell). Answer: False Page: 218 Answer: False Page: 233 69
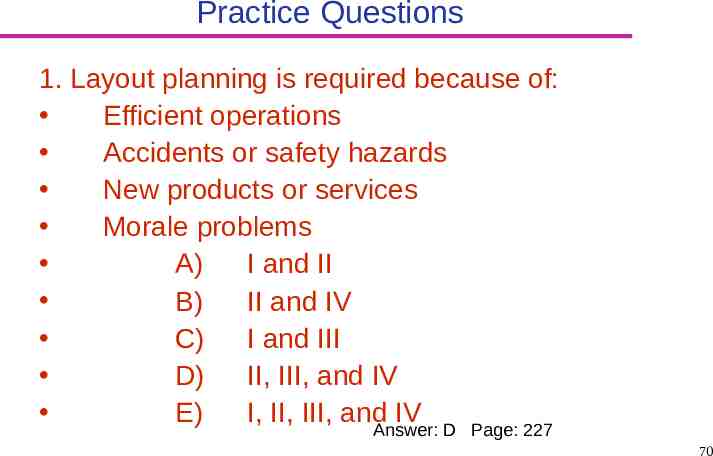
Practice Questions 1. Layout planning is required because of: Efficient operations Accidents or safety hazards New products or services Morale problems A) I and II B) II and IV C) I and III D) II, III, and IV E) I, II, III, andAnswer: IV D Page: 227 70
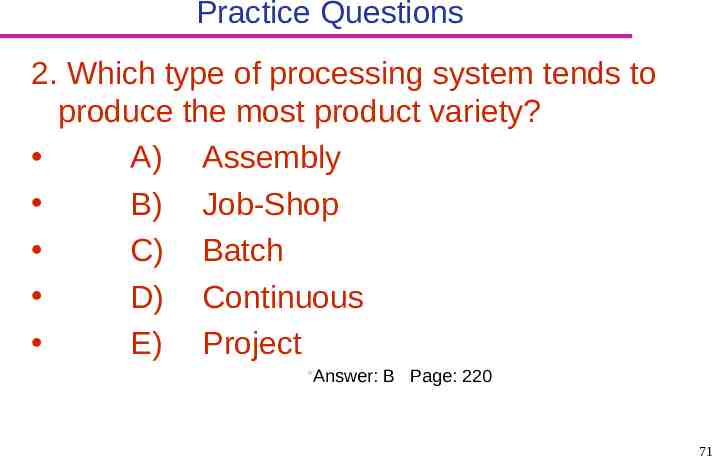
Practice Questions 2. Which type of processing system tends to produce the most product variety? A) Assembly B) Job-Shop C) Batch D) Continuous E) Project Answer: B Page: 220 71
Practice Questions 3. A production line is to be designed for a job with three tasks. The task times are 0.3 minutes, 1.4 minutes, and 0.7 minutes. The minimum cycle time in minutes, is: A) 0.3 B) 0.7 C) 1.4 D) 2.4 Answer: C Page: 238 E) 0.8 72
Chapter 6 Supplement Linear Programming: Very useful technique – Learn before graduation You may read my lecture notes for OPRE6201 available on the web. 73