CHAPTER 3 FERTILITY MEASURES . Dr. A. PHILIP AROKIADOSS Assistant


27 Slides846.00 KB
CHAPTER 3 FERTILITY MEASURES . Dr. A. PHILIP AROKIADOSS Assistant Professor Department of Statistics St. Joseph’s College (Autonomous) Tiruchirappalli-620 002.
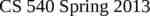
DEFINITION OF TERMS Fertility Production of a live birth (natality) Infertility Inability to produce a live birth Parity Number of children born alive to a woman Gravidity Number of pregnancies a woman has had whether or not they produce a live birth Fecundity Physiological capacity to conceive (reproductive potential) Infecundity (sterility) Inability of a woman to conceive a pregnancy - Primary sterility Never able to conceive a pregnancy - Secondary sterility Inability to conceive after one or more children have been born Fecundability Probability that a woman will conceive during a menstrual cycle
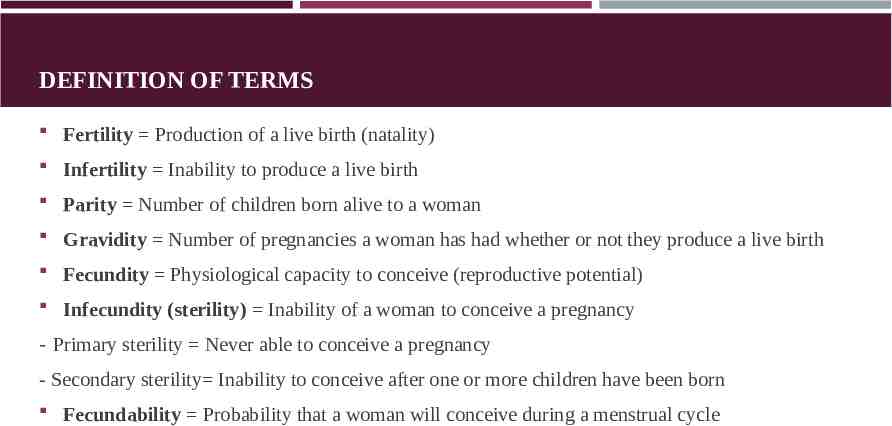
FERTILITY MEASUREMENT: SOURCES OF DATA Censuses Vital registration systems Nationally representative sample surveys World Fertility Surveys (WFS), Demographic and Health Surveys (DHS),
CRUDE INDICATORS OF FERTILITY
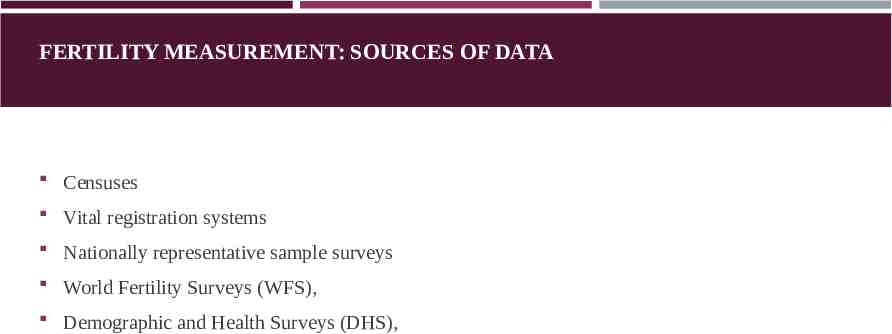
CHILD- WOMAN RATIO Number of children under age 5 per 1000 women of childbearing age in a given year. This measure can be calculated from national censuses or survey data, thereby providing fertility data where birth statistics may not otherwise be available. CWR
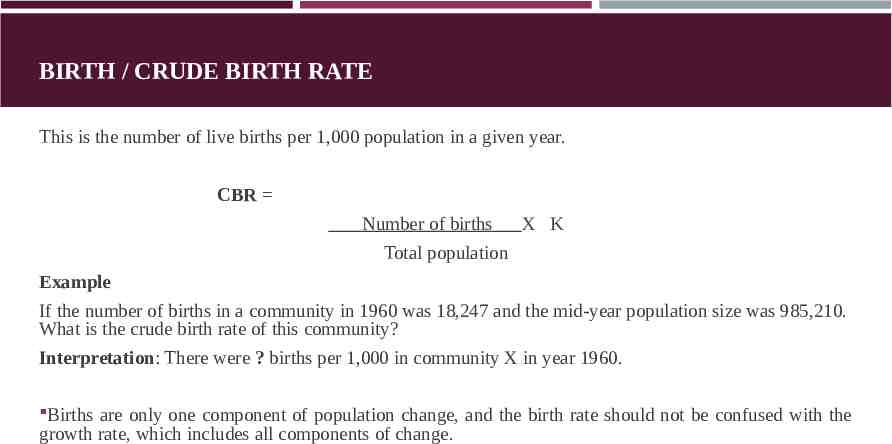
BIRTH / CRUDE BIRTH RATE This is the number of live births per 1,000 population in a given year. CBR Number of births X K Total population Example If the number of births in a community in 1960 was 18,247 and the mid-year population size was 985,210. What is the crude birth rate of this community? Interpretation: There were ? births per 1,000 in community X in year 1960. Births are only one component of population change, and the birth rate should not be confused with the growth rate, which includes all components of change.
DATA REQUIREMENT AND LIMITATIONS OF CBR Need a complete and accurate vital registration system. Only a crude estimate of fertility. All the population included in the denominator is not exposed to the risk of pregnancy. Not good for comparing fertility across populations, as variations in age distribution of the populations being compared will affect the birth rate.
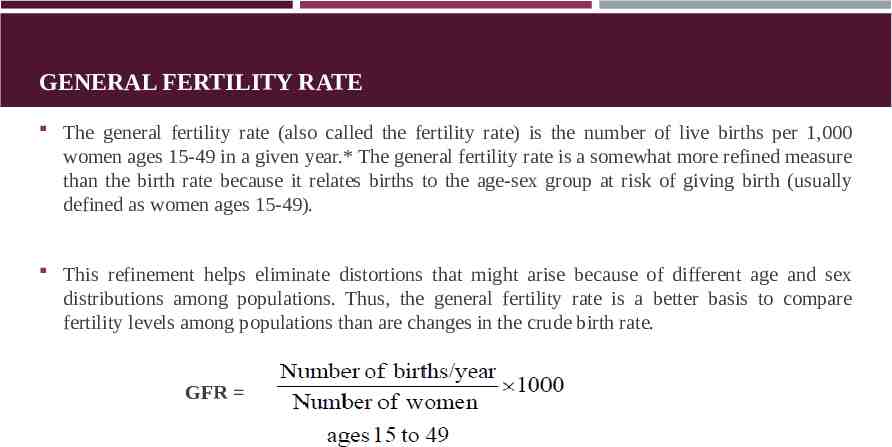
GENERAL FERTILITY RATE The general fertility rate (also called the fertility rate) is the number of live births per 1,000 women ages 15-49 in a given year.* The general fertility rate is a somewhat more refined measure than the birth rate because it relates births to the age-sex group at risk of giving birth (usually defined as women ages 15-49). This refinement helps eliminate distortions that might arise because of different age and sex distributions among populations. Thus, the general fertility rate is a better basis to compare fertility levels among populations than are changes in the crude birth rate. GFR
DATA SOURCES Vital registration system for births May also be estimated from national censuses or survey data using the child-women ratio when birth statistics are not available Relates births to the age-sex group at risk of giving births (usually defined as women ages 15-49 years) More refined measure than crude birth rate to compare fertility across populations Approximately equals to 4 times the crude birth rate
AGE ADJUSTED INDICATORS OF FERTILITY
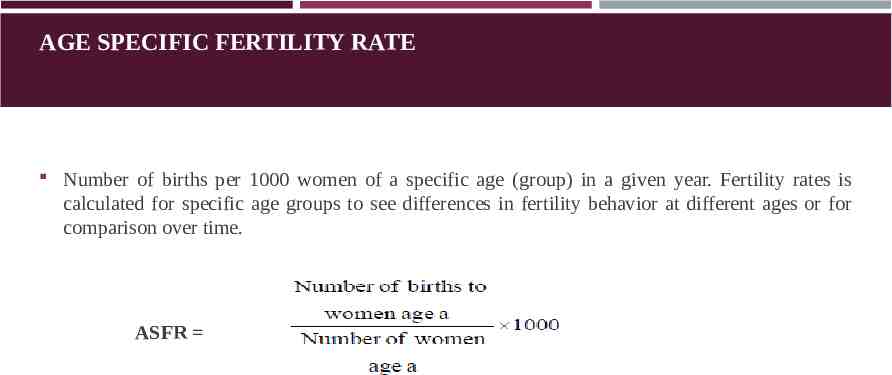
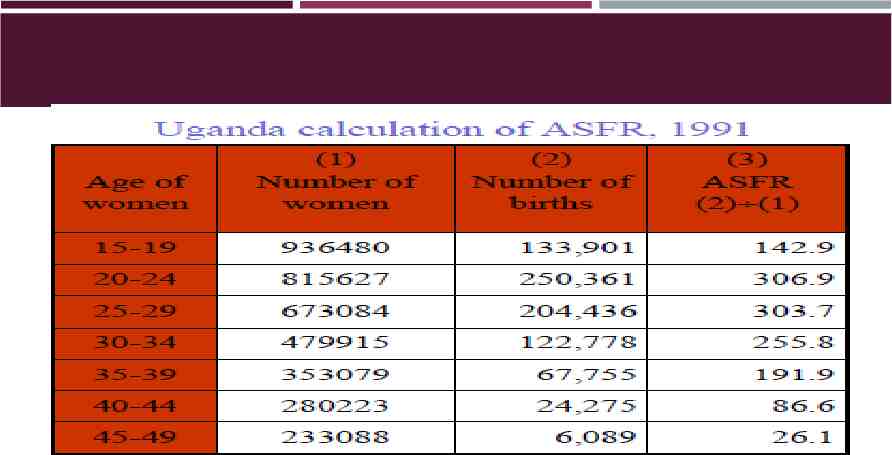
AGE SPECIFIC FERTILITY RATE Number of births per 1000 women of a specific age (group) in a given year. Fertility rates is calculated for specific age groups to see differences in fertility behavior at different ages or for comparison over time. ASFR
AGE SPECIFIC FERTILITY RATES: WHY DO WE NEED THEM? For comparisons in fertility behavior at different ages For comparison of fertility at different ages over time For comparison of fertility across countries/populations
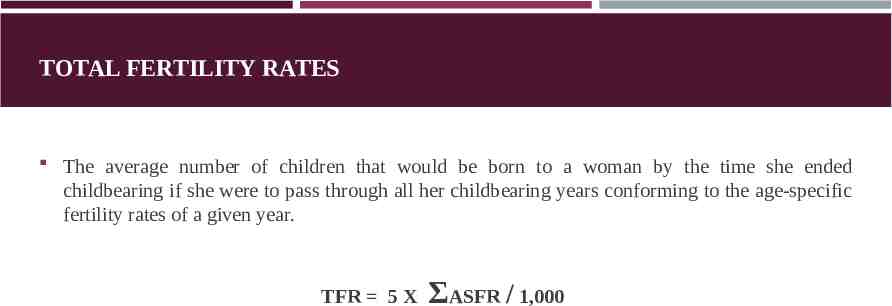
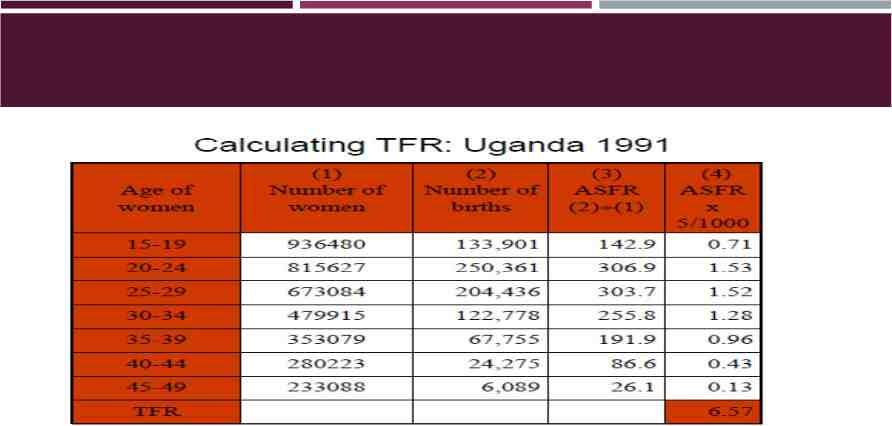
TOTAL FERTILITY RATES The average number of children that would be born to a woman by the time she ended childbearing if she were to pass through all her childbearing years conforming to the age-specific fertility rates of a given year. TFR 5 X ΣASFR / 1,000
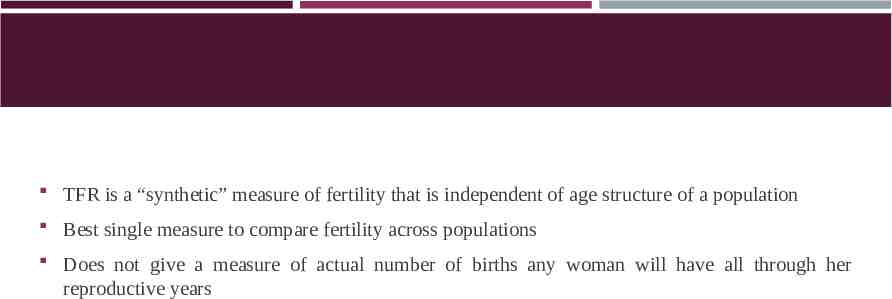
TFR is a “synthetic” measure of fertility that is independent of age structure of a population Best single measure to compare fertility across populations Does not give a measure of actual number of births any woman will have all through her reproductive years
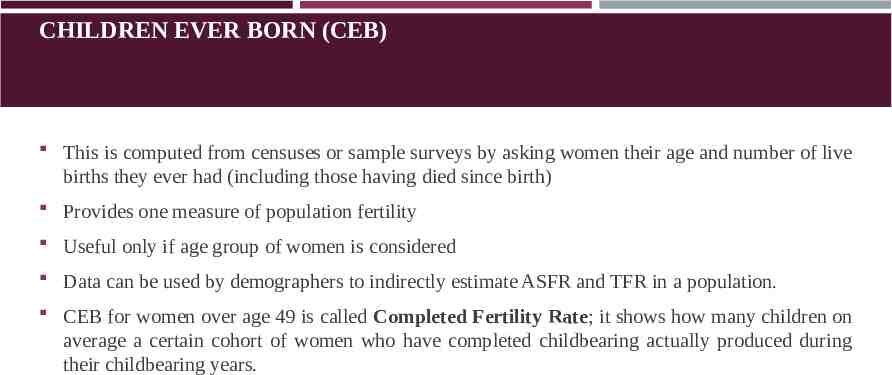
CHILDREN EVER BORN (CEB) This is computed from censuses or sample surveys by asking women their age and number of live births they ever had (including those having died since birth) Provides one measure of population fertility Useful only if age group of women is considered Data can be used by demographers to indirectly estimate ASFR and TFR in a population. CEB for women over age 49 is called Completed Fertility Rate; it shows how many children on average a certain cohort of women who have completed childbearing actually produced during their childbearing years.
INDICATORS OF REPRODUCTION
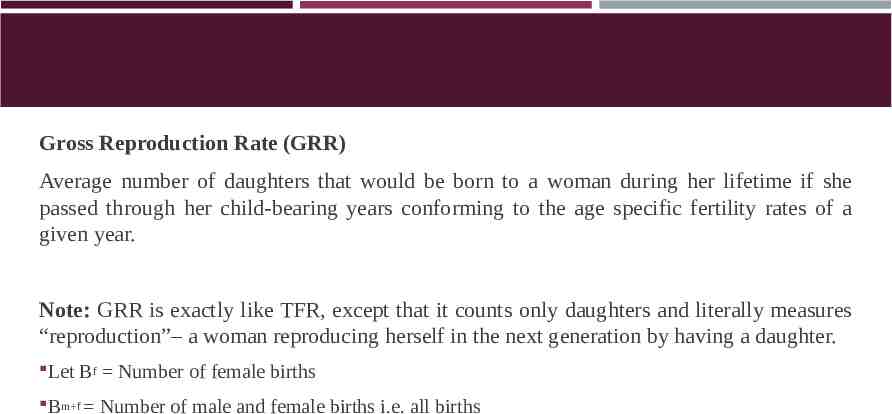
Gross Reproduction Rate (GRR) Average number of daughters that would be born to a woman during her lifetime if she passed through her child-bearing years conforming to the age specific fertility rates of a given year. Note: GRR is exactly like TFR, except that it counts only daughters and literally measures “reproduction”– a woman reproducing herself in the next generation by having a daughter. Let Bf Number of female births Bm f Number of male and female births i.e. all births
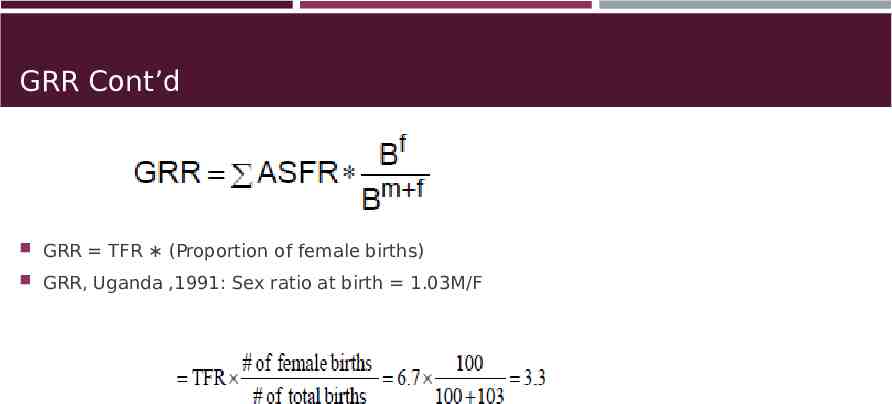
GRR Cont’d GRR TFR (Proportion of female births) GRR, Uganda ,1991: Sex ratio at birth 1.03M/F
GRR Cont’d GRR, like TFR, assumes that the hypothetical cohort of women pass from birth through their reproductive life without experiencing mortality. This assumption is satisfactory when one wants to compare levels of fertility and/or gross reproduction across populations and over time. But, for a more realistic assessment of the reproductive potential of a population, taking into account mortality, one needs to calculate the Net Reproduction Rate (NRR).
NET REPRODUCTION RATE (NRR) Definition Average number of daughters that would be born to a woman if she passed through her life-time from birth to the end of her reproductive years conforming to the age-specific fertility and mortality rates of a given year
NET REPRODUCTION RATE: RELATIONSHIP WITH GRR AND TFR NRR is always lower than GRR, because it takes into account the fact that some women will die before entering and completing their child-bearing years. Correspondingly NRR will be less than half the magnitude of the TFR.
REPLACEMENT FERTILITY Replacement Level Fertility is said to have been reached when NRR 1.0 – Surviving women in the hypothetical cohort have exactly enough daughters (on average) to replace themselves in the population At this time GRR 1 and TFR 2. (Roughly, this is when couple have an average of two children.) When NRR 1.00 it does not imply: – CBR CDR – Population growth rate 0
RELATIONSHIP BETWEEN REPRODUCTION MEASURES AND POPULATION GROWTH Population momentum is the propensity for a population to grow for many years after fertility declines to reach the replacement level of the “two-child family”. (TFR 2.2 and NRR 1.0). This population momentum during the fertility transition is a function of young age structure of the population due to high levels of fertility in the past.
THANK YOU FOR LISTENING!