Chapter 1: Introduction to Statistics 1
25 Slides662.00 KB
Chapter 1: Introduction to Statistics 1
Variables A variable is a characteristic or condition that can change or take on different values. Most research begins with a general question about the relationship between two variables for a specific group of individuals. 2
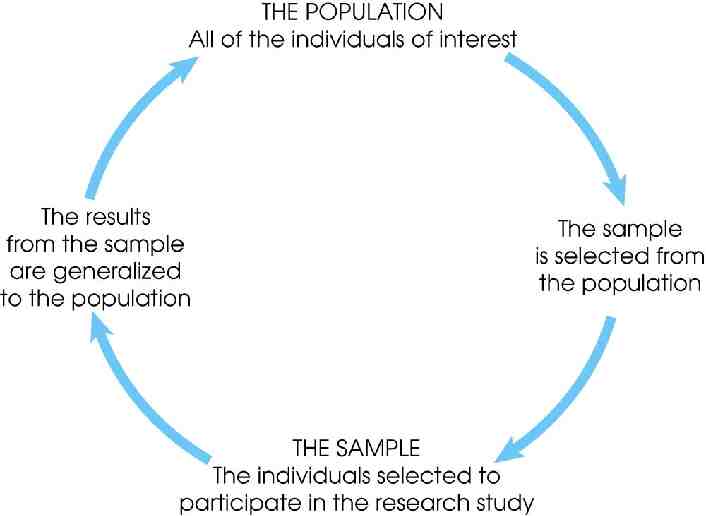
Population The entire group of individuals is called the population. For example, a researcher may be interested in the relation between class size (variable 1) and academic performance (variable 2) for the population of third-grade children. 3
Sample Usually populations are so large that a researcher cannot examine the entire group. Therefore, a sample is selected to represent the population in a research study. The goal is to use the results obtained from the sample to help answer questions about the population. 4
Types of Variables Variables can be classified as discrete or continuous. Discrete variables (such as class size) consist of indivisible categories, and continuous variables (such as time or weight) are infinitely divisible into whatever units a researcher may choose. For example, time can be measured to the nearest minute, second, half-second, etc. 6
Real Limits To define the units for a continuous variable, a researcher must use real limits which are boundaries located exactly halfway between adjacent categories. 7
Measuring Variables To establish relationships between variables, researchers must observe the variables and record their observations. This requires that the variables be measured. The process of measuring a variable requires a set of categories called a scale of measurement and a process that classifies each individual into one category. 8
4 Types of Measurement Scales 1. A nominal scale is an unordered set of categories identified only by name. Nominal measurements only permit you to determine whether two individuals are the same or different. 2. An ordinal scale is an ordered set of categories. Ordinal measurements tell you the direction of difference between two individuals. 9
4 Types of Measurement Scales 3. An interval scale is an ordered series of equalsized categories. Interval measurements identify the direction and magnitude of a difference. The zero point is located arbitrarily on an interval scale. 4. A ratio scale is an interval scale where a value of zero indicates none of the variable. Ratio measurements identify the direction and magnitude of differences and allow ratio comparisons of measurements. 10
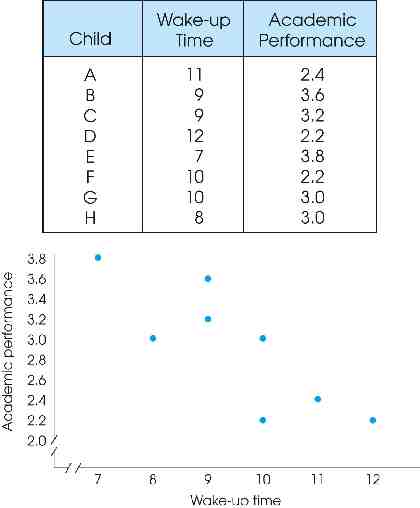
Correlational Studies The goal of a correlational study is to determine whether there is a relationship between two variables and to describe the relationship. A correlational study simply observes the two variables as they exist naturally. 11
Experiments The goal of an experiment is to demonstrate a cause-and-effect relationship between two variables; that is, to show that changing the value of one variable causes changes to occur in a second variable. 13
Experiments (cont.) In an experiment, one variable is manipulated to create treatment conditions. A second variable is observed and measured to obtain scores for a group of individuals in each of the treatment conditions. The measurements are then compared to see if there are differences between treatment conditions. All other variables are controlled to prevent them from influencing the results. In an experiment, the manipulated variable is called the independent variable and the observed variable is the dependent variable. 14
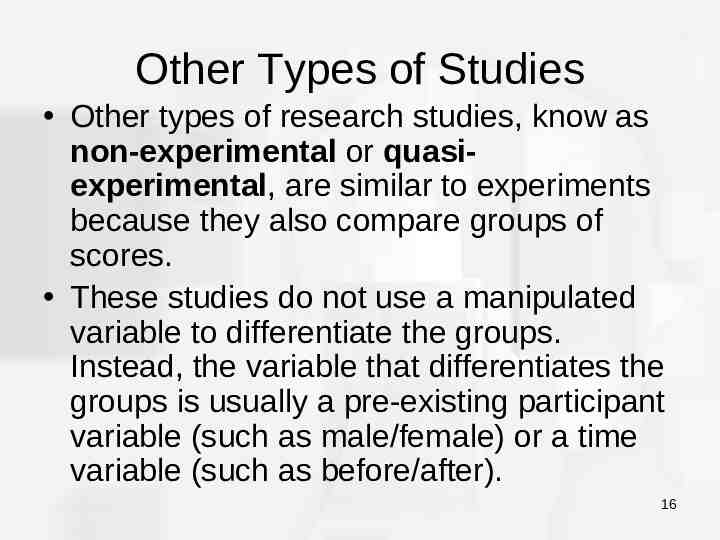
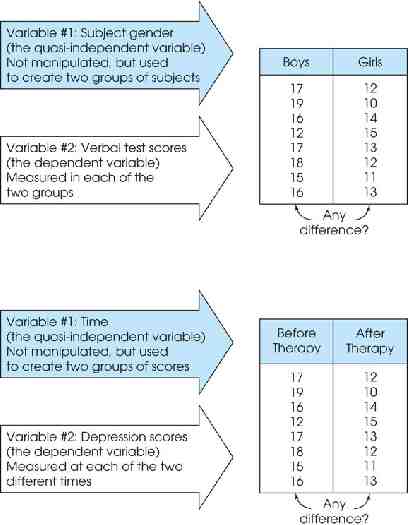
Other Types of Studies Other types of research studies, know as non-experimental or quasiexperimental, are similar to experiments because they also compare groups of scores. These studies do not use a manipulated variable to differentiate the groups. Instead, the variable that differentiates the groups is usually a pre-existing participant variable (such as male/female) or a time variable (such as before/after). 16
Other Types of Studies (cont.) Because these studies do not use the manipulation and control of true experiments, they cannot demonstrate cause and effect relationships. As a result, they are similar to correlational research because they simply demonstrate and describe relationships. 17
Data The measurements obtained in a research study are called the data. The goal of statistics is to help researchers organize and interpret the data. 19
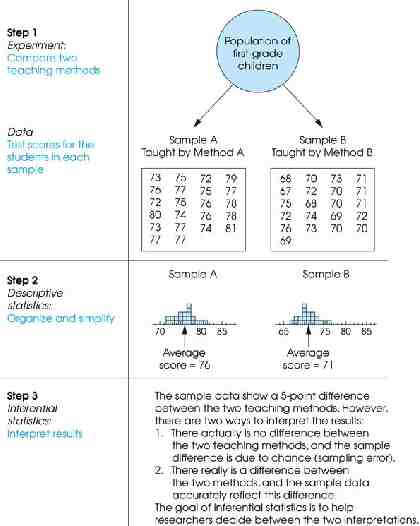
Descriptive Statistics Descriptive statistics are methods for organizing and summarizing data. For example, tables or graphs are used to organize data, and descriptive values such as the average score are used to summarize data. A descriptive value for a population is called a parameter and a descriptive value for a sample is called a statistic. 20
Inferential Statistics Inferential statistics are methods for using sample data to make general conclusions (inferences) about populations. Because a sample is typically only a part of the whole population, sample data provide only limited information about the population. As a result, sample statistics are generally imperfect representatives of the corresponding population parameters. 21
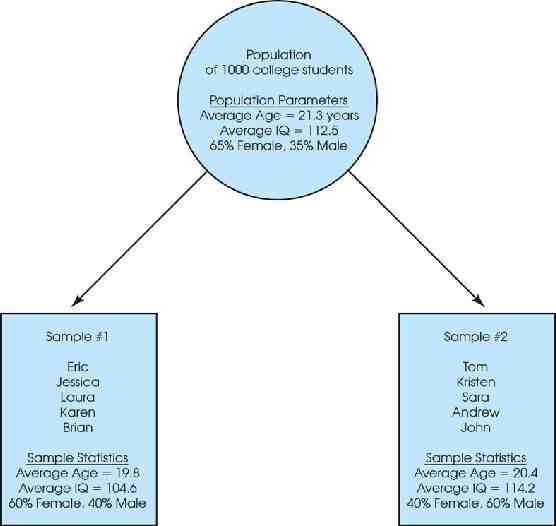
Sampling Error The discrepancy between a sample statistic and its population parameter is called sampling error. Defining and measuring sampling error is a large part of inferential statistics. 22
Notation The individual measurements or scores obtained for a research participant will be identified by the letter X (or X and Y if there are multiple scores for each individual). The number of scores in a data set will be identified by N for a population or n for a sample. Summing a set of values is a common operation in statistics and has its own notation. The Greek letter sigma, Σ, will be used to stand for "the sum of." For example, ΣX identifies the sum of the scores. 24
Order of Operations 1. All calculations within parentheses are done first. 2. Squaring or raising to other exponents is done second. 3. Multiplying, and dividing are done third, and should be completed in order from left to right. 4. Summation with the Σ notation is done next. 5. Any additional adding and subtracting is done last and should be completed in order from left to right. 25