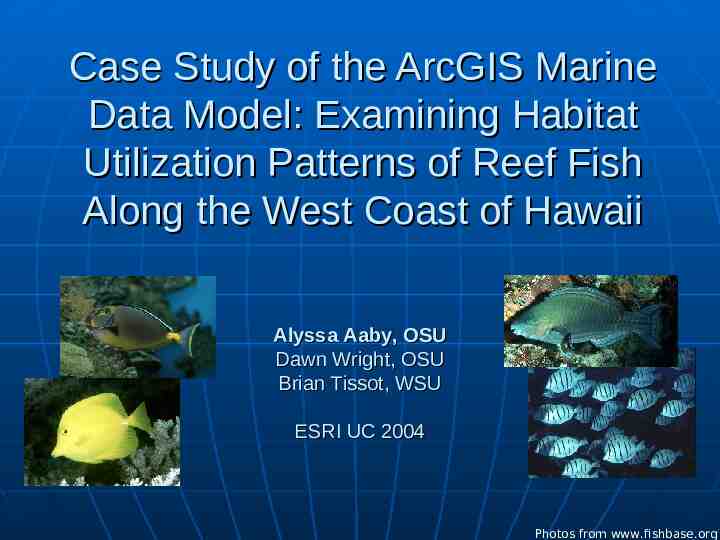
Case Study of the ArcGIS Marine Data Model: Examining Habitat

54 Slides3.93 MB
Case Study of the ArcGIS Marine Data Model: Examining Habitat Utilization Patterns of Reef Fish Along the West Coast of Hawaii Alyssa Aaby, OSU Dawn Wright, OSU Brian Tissot, WSU ESRI UC 2004 Photos from www.fishbase.org
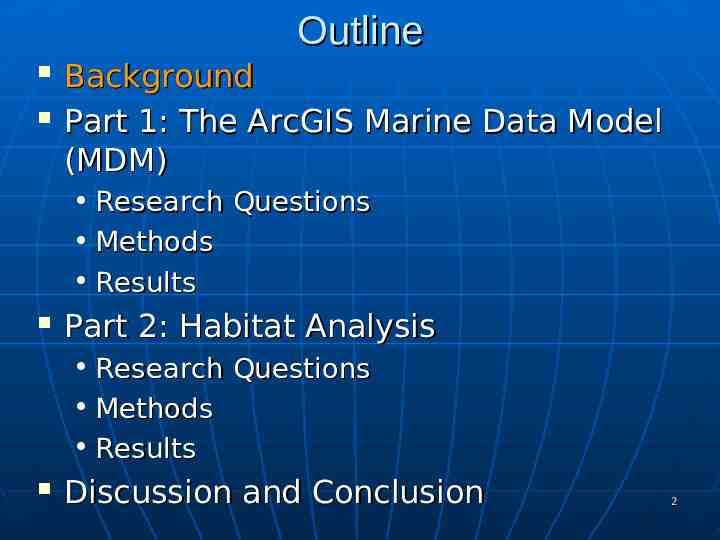
Outline Background Part 1: The ArcGIS Marine Data Model (MDM) Research Questions Methods Results Part 2: Habitat Analysis Research Questions Methods Results Discussion and Conclusion 2
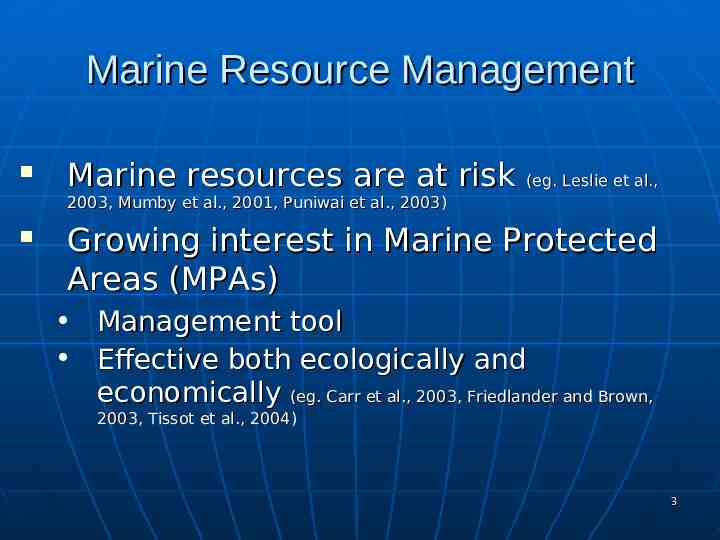
Marine Resource Management Marine resources are at risk (eg. Leslie et al., 2003, Mumby et al., 2001, Puniwai et al., 2003) Growing interest in Marine Protected Areas (MPAs) Management tool Effective both ecologically and economically (eg. Carr et al., 2003, Friedlander and Brown, 2003, Tissot et al., 2004) 3
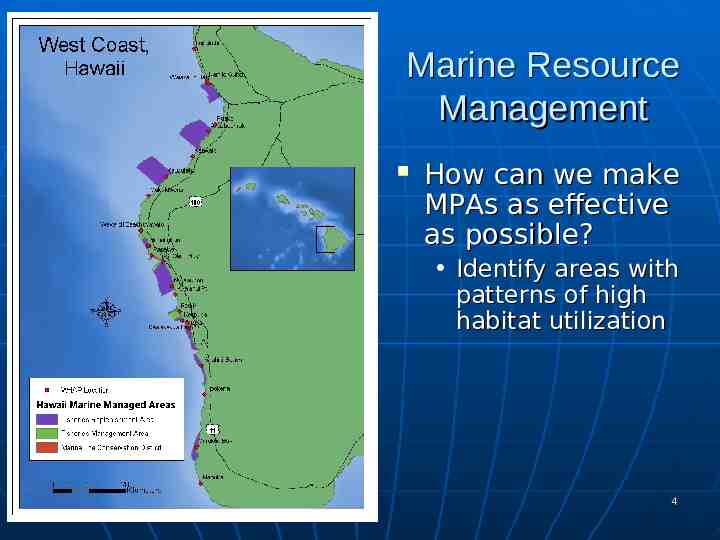
Marine Resource Management How can we make MPAs as effective as possible? Identify areas with patterns of high habitat utilization 4
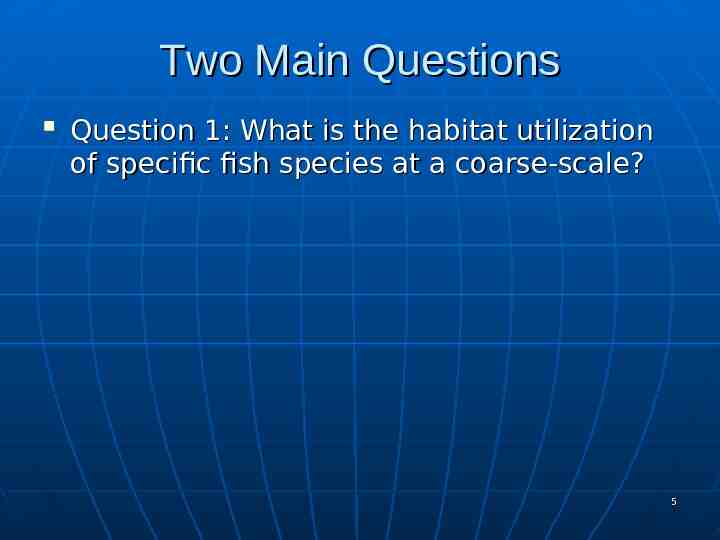
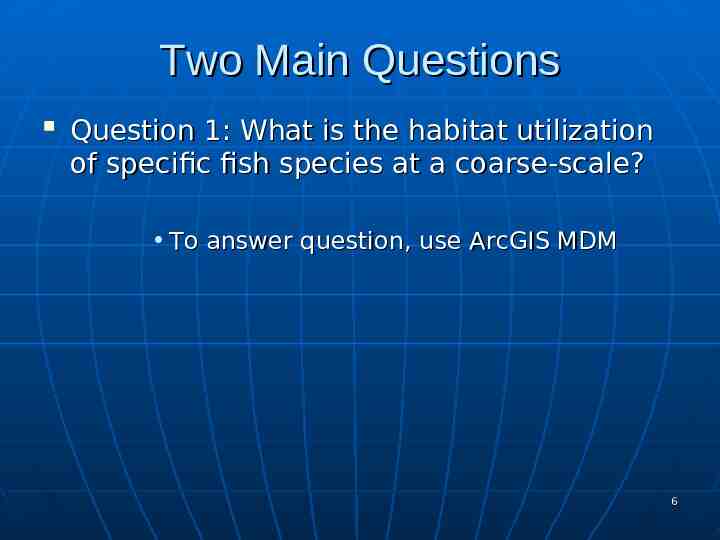
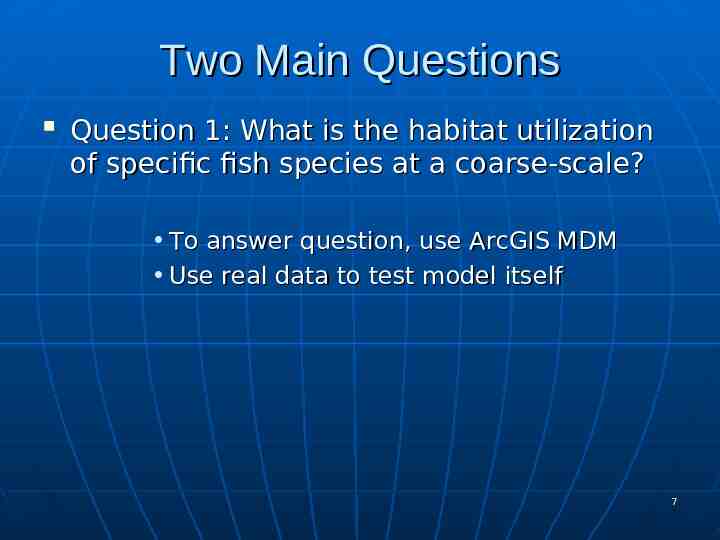
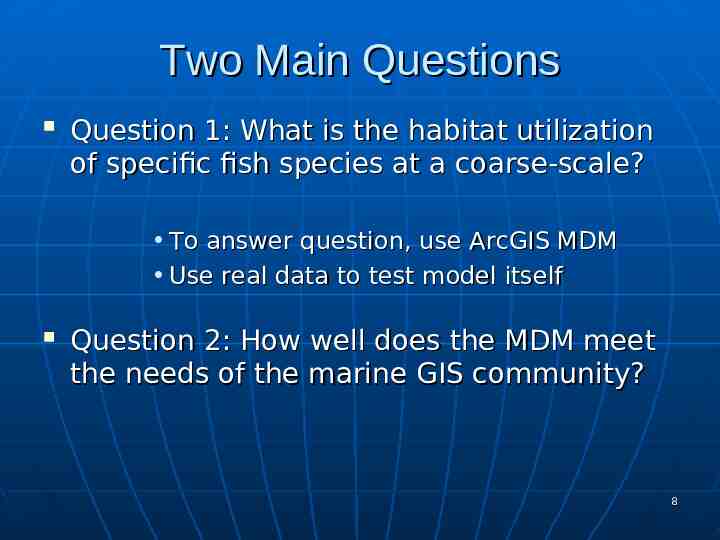
Two Main Questions Question 1: What is the habitat utilization of specific fish species at a coarse-scale? 5
Two Main Questions Question 1: What is the habitat utilization of specific fish species at a coarse-scale? To answer question, use ArcGIS MDM 6
Two Main Questions Question 1: What is the habitat utilization of specific fish species at a coarse-scale? To answer question, use ArcGIS MDM Use real data to test model itself 7
Two Main Questions Question 1: What is the habitat utilization of specific fish species at a coarse-scale? To answer question, use ArcGIS MDM Use real data to test model itself Question 2: How well does the MDM meet the needs of the marine GIS community? 8
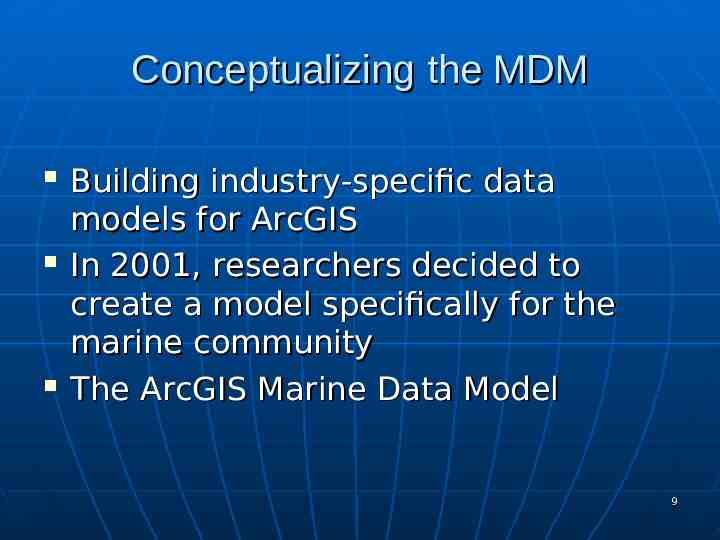
Conceptualizing the MDM Building industry-specific data models for ArcGIS In 2001, researchers decided to create a model specifically for the marine community The ArcGIS Marine Data Model 9
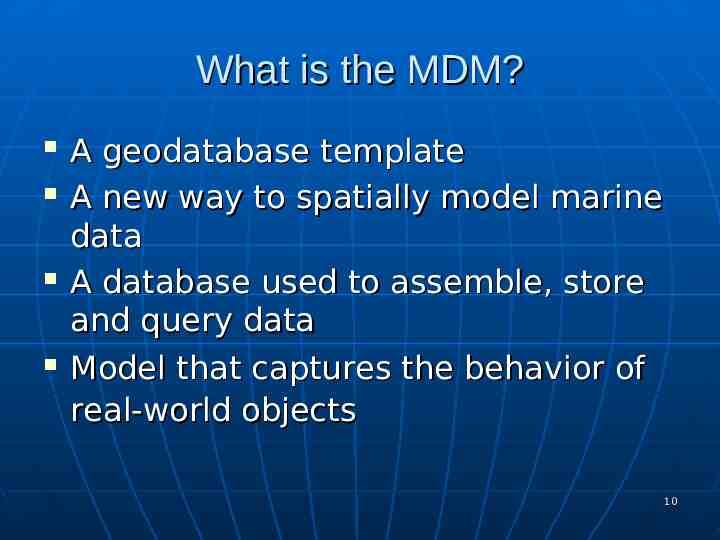
What is the MDM? A geodatabase template A new way to spatially model marine data A database used to assemble, store and query data Model that captures the behavior of real-world objects 10
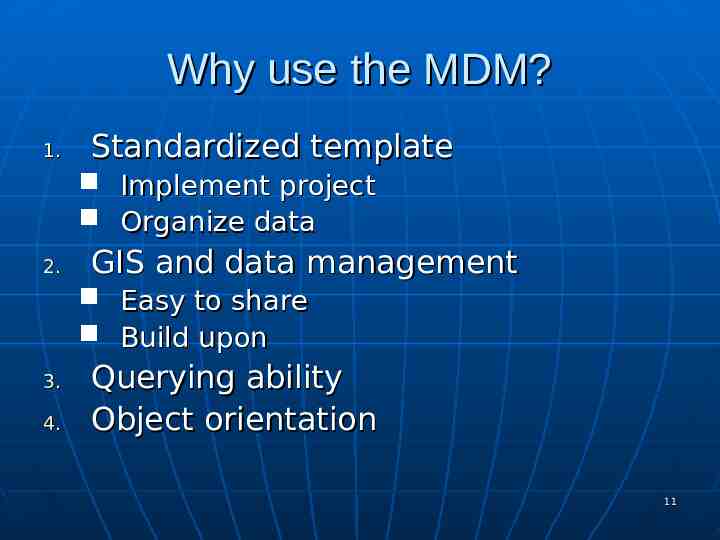
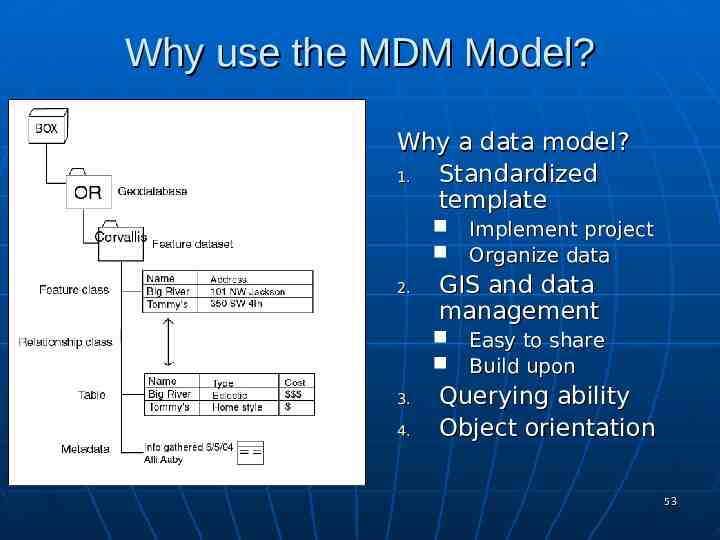
Why use the MDM? 1. Standardized template Implement project Organize data 2. GIS and data management Easy to share Build upon 3. 4. Querying ability Object orientation 11
Outline Background Part 1: The Marine Data Model (MDM) Research Questions Methods Results Part 2: Habitat Analysis Research Questions Methods Results Discussion and Conclusion 12
Testing the ArcGIS Marine Data Model: 3 Goals Case study tested 3 goals (Wright et al, 2002): Goal 1: Assembling, managing, and querying in ArcGIS Goal 2: Provide a template Goal 3: Improve the understanding of geodatabase models 13
Outline Background Part 1: The Marine Data Model (MDM) Research Questions Methods Results Part 2: Habitat Analysis Research Questions Methods Results Discussion and Conclusion 14
Methodology Goals 1 and 2: Data Gathered Formatting Importing Querying Goal 3 Tutorial created 15
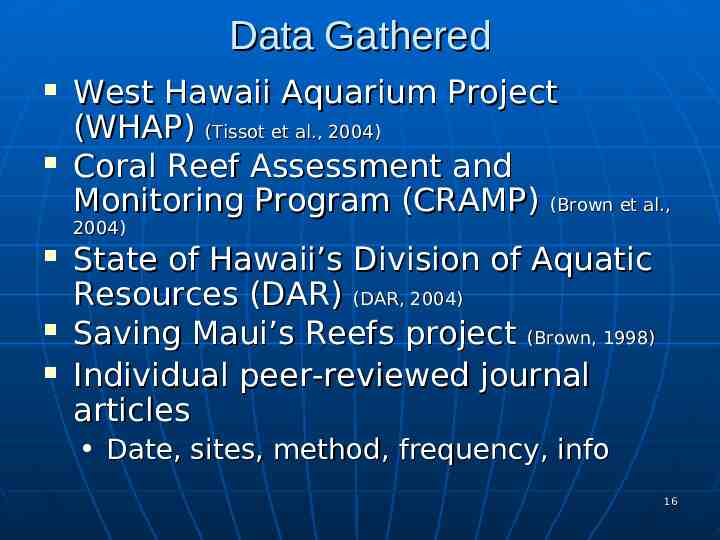
Data Gathered West Hawaii Aquarium Project (WHAP) (Tissot et al., 2004) Coral Reef Assessment and Monitoring Program (CRAMP) (Brown et al., 2004) State of Hawaii’s Division of Aquatic Resources (DAR) (DAR, 2004) Saving Maui’s Reefs project (Brown, 1998) Individual peer-reviewed journal articles Date, sites, method, frequency, info 16
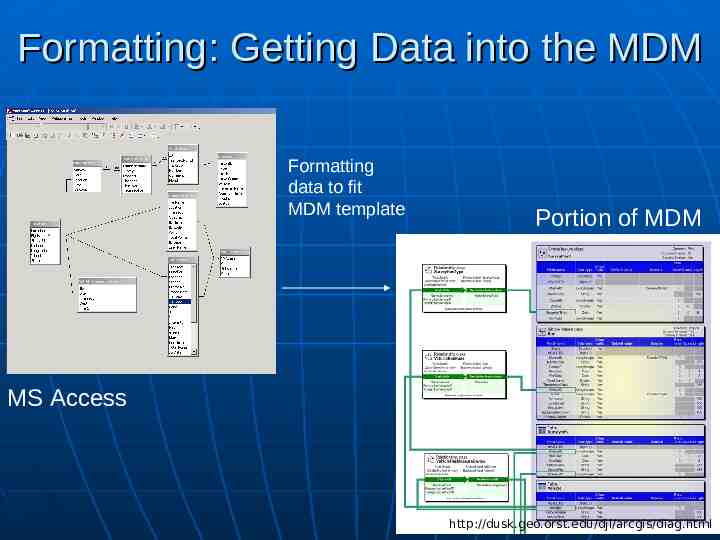
Formatting: Getting Data into the MDM Formatting data to fit MDM template Portion of MDM MS Access 17 http://dusk.geo.orst.edu/djl/arcgis/diag.html
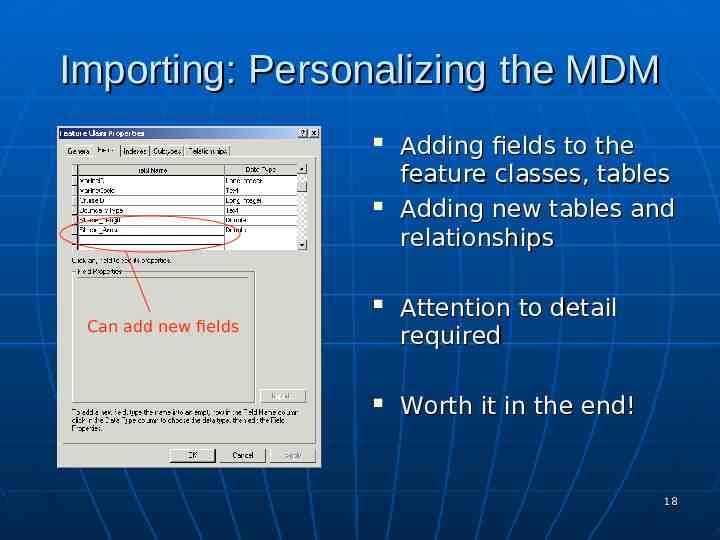
Importing: Personalizing the MDM Adding fields to the feature classes, tables Adding new tables and relationships Attention to detail required Worth it in the end! Can add new fields 18
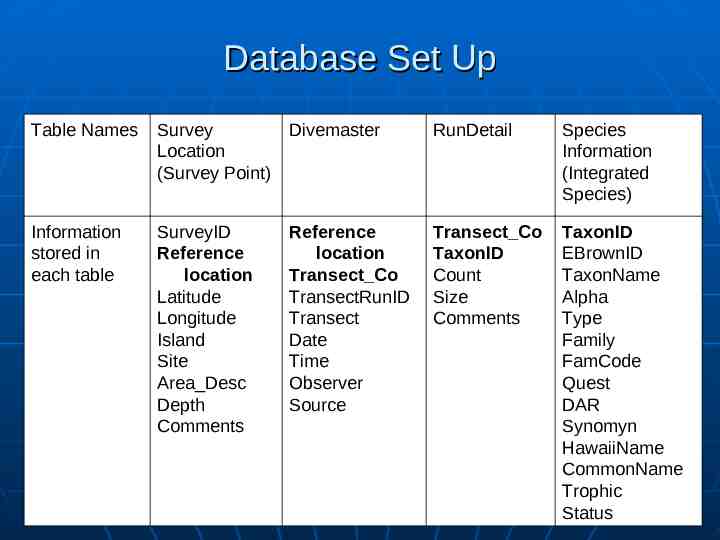
Database Set Up Table Names Survey Location (Survey Point) Divemaster RunDetail Species Information (Integrated Species) Information stored in each table SurveyID Reference location Latitude Longitude Island Site Area Desc Depth Comments Reference location Transect Co TransectRunID Transect Date Time Observer Source Transect Co TaxonID Count Size Comments TaxonID EBrownID TaxonName Alpha Type Family FamCode Quest DAR Synomyn HawaiiName CommonName Trophic 19 Status
20
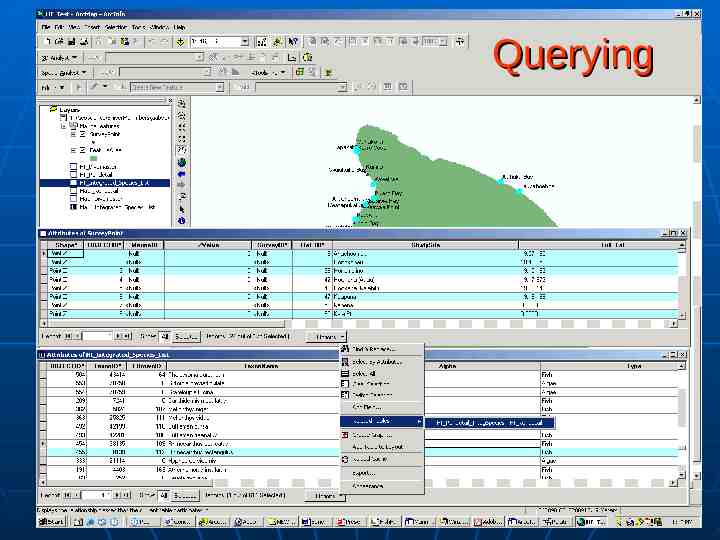
Querying 21
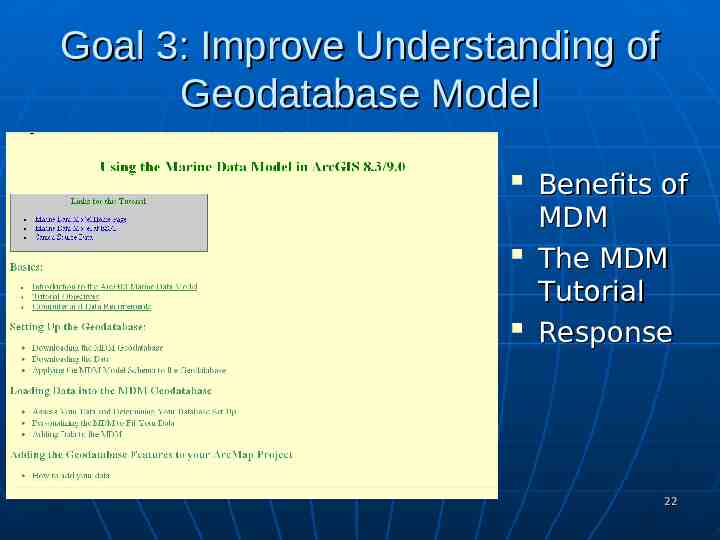
Goal 3: Improve Understanding of Geodatabase Model Benefits of MDM The MDM Tutorial Response 22
Outline Background Part 1: The Marine Data Model (MDM) Research Questions Methods Results Part 2: Habitat Analysis Research Questions Methods Results Discussion and Conclusion 23
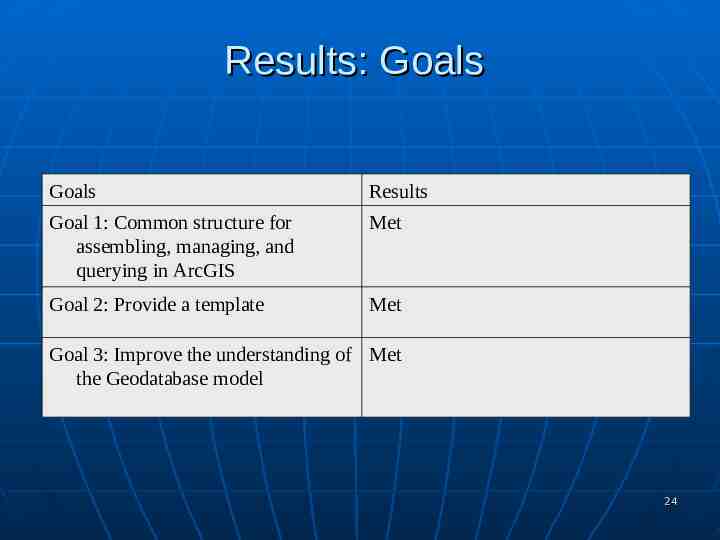
Results: Goals Goals Results Goal 1: Common structure for assembling, managing, and querying in ArcGIS Met Goal 2: Provide a template Met Goal 3: Improve the understanding of Met the Geodatabase model 24
Outline Background Part 1: The Marine Data Model (MDM) Research Questions Methods Results Part 2: Habitat Analysis Research Questions Methods Results Discussion and Conclusion 25
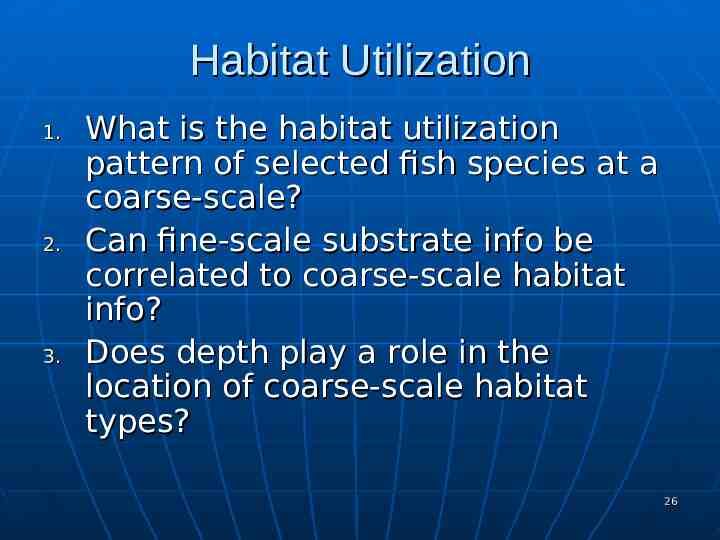
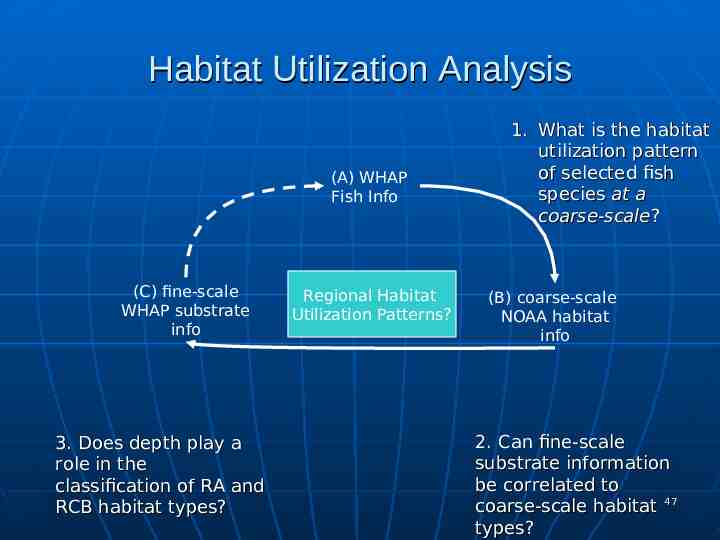
Habitat Utilization 1. 2. 3. What is the habitat utilization pattern of selected fish species at a coarse-scale? Can fine-scale substrate info be correlated to coarse-scale habitat info? Does depth play a role in the location of coarse-scale habitat types? 26
Outline Background Part 1: The Marine Data Model (MDM) Research Questions Methods Results Part 2: Habitat Analysis Research Questions Methods Results Discussion and Conclusion 27
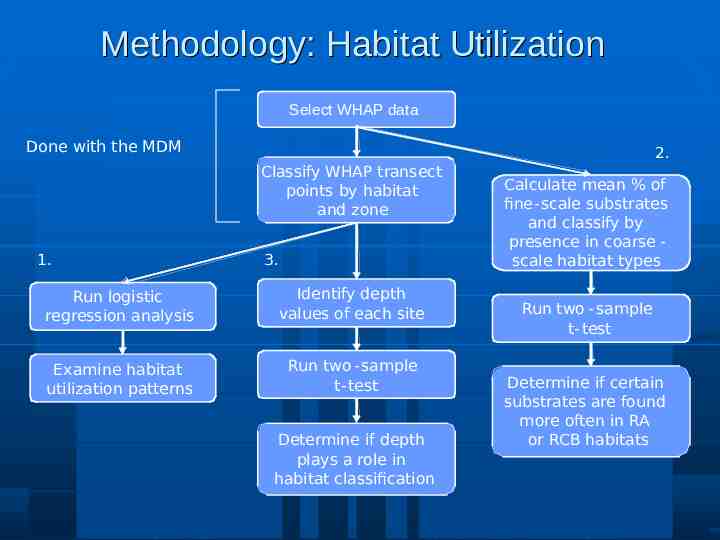
Methodology: Habitat Utilization Select WHAP data Done with the MDM 2. Classify WHAP transect points by habitat and zone 1. 3. Run logistic regression analysis Identify depth values of each site Examine habitat utilization patterns Run two - sample t- test Determine if depth plays a role in habitat classification Calculate mean % of fine- scale substrates and classify by presence in coarse scale habitat types Run two - sample t- test Determine if certain substrates are found more often in RA or RCB habitats 28
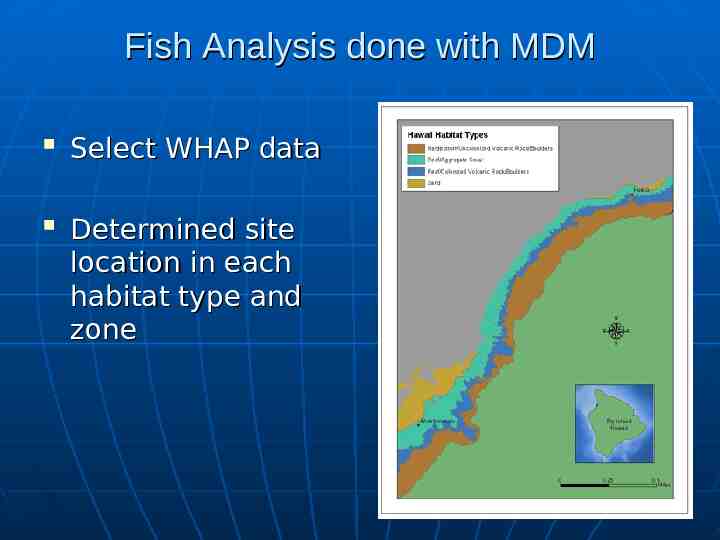
Fish Analysis done with MDM Select WHAP data Determined site location in each habitat type and zone 29
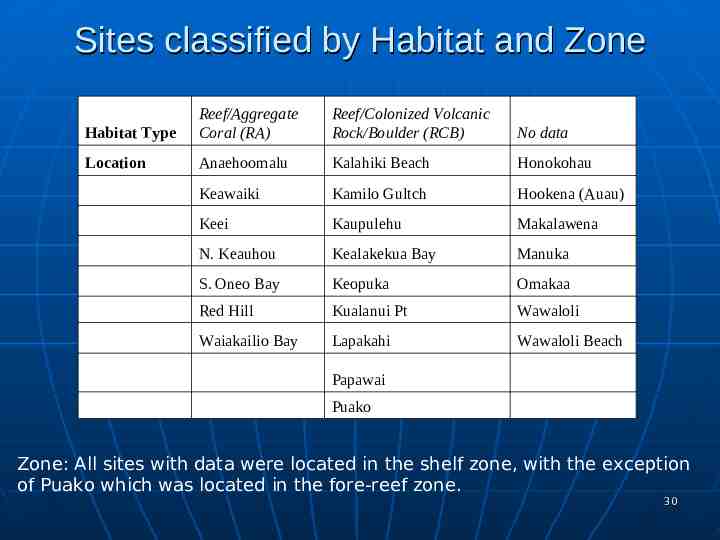
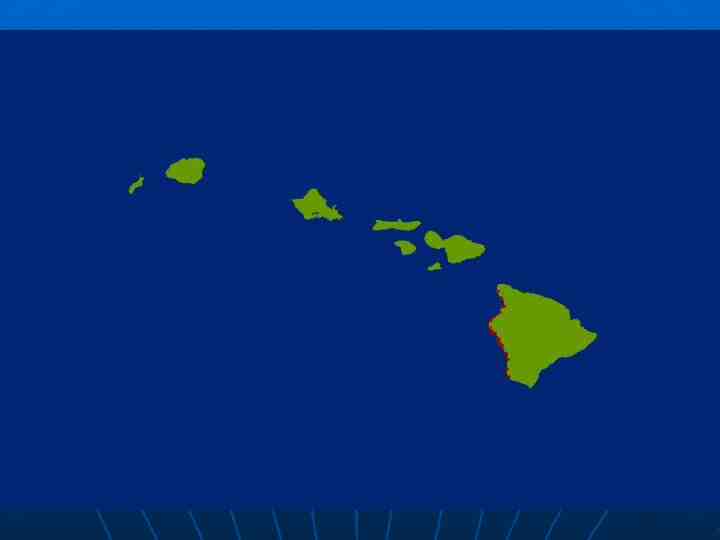
Sites classified by Habitat and Zone Habitat Type Reef/Aggregate Coral (RA) Reef/Colonized Volcanic Rock/Boulder (RCB) No data Location Anaehoomalu Kalahiki Beach Honokohau Keawaiki Kamilo Gultch Hookena (Auau) Keei Kaupulehu Makalawena N. Keauhou Kealakekua Bay Manuka S. Oneo Bay Keopuka Omakaa Red Hill Kualanui Pt Wawaloli Waiakailio Bay Lapakahi Wawaloli Beach Papawai Puako Zone: All sites with data were located in the shelf zone, with the exception of Puako which was located in the fore-reef zone. 30
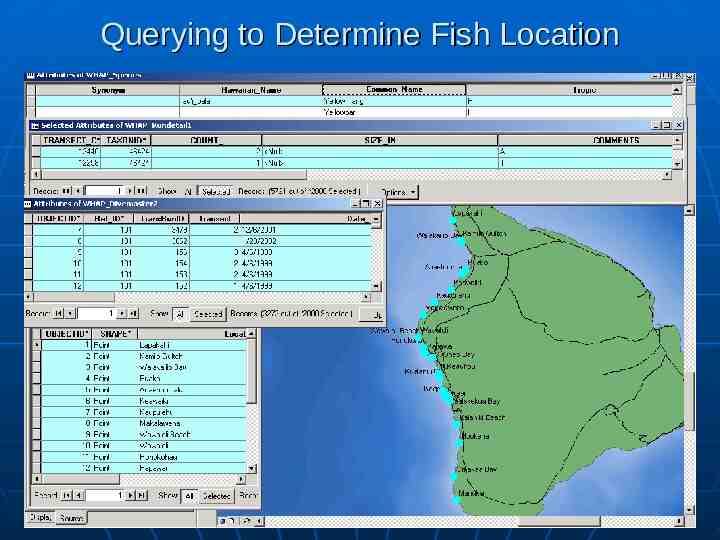
Querying to Determine Fish Location 31
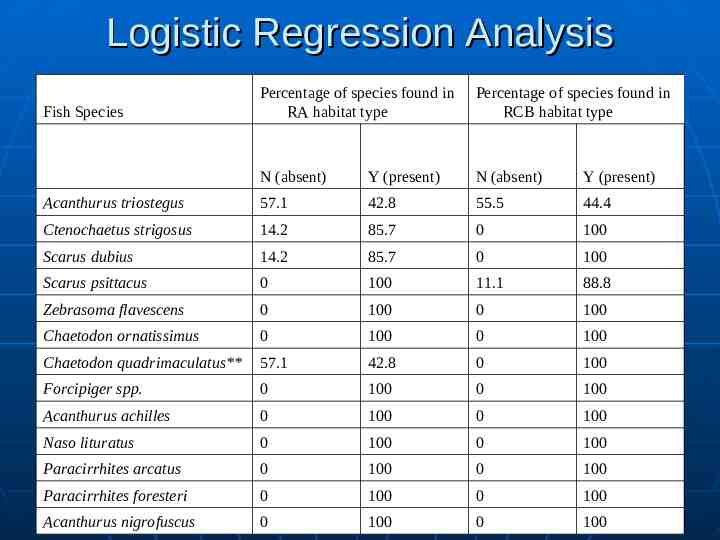
Logistic Regression Analysis Percentage of species found in RA habitat type Percentage of species found in RCB habitat type N (absent) Y (present) N (absent) Y (present) Acanthurus triostegus 57.1 42.8 55.5 44.4 Ctenochaetus strigosus 14.2 85.7 0 100 Scarus dubius 14.2 85.7 0 100 Scarus psittacus 0 100 11.1 88.8 Zebrasoma flavescens 0 100 0 100 Chaetodon ornatissimus 0 100 0 100 Chaetodon quadrimaculatus** 57.1 42.8 0 100 Forcipiger spp. 0 100 0 100 Acanthurus achilles 0 100 0 100 Naso lituratus 0 100 0 100 Paracirrhites arcatus 0 100 0 100 Paracirrhites foresteri 0 100 0 100 Acanthurus nigrofuscus 0 100 0 100 Fish Species 32
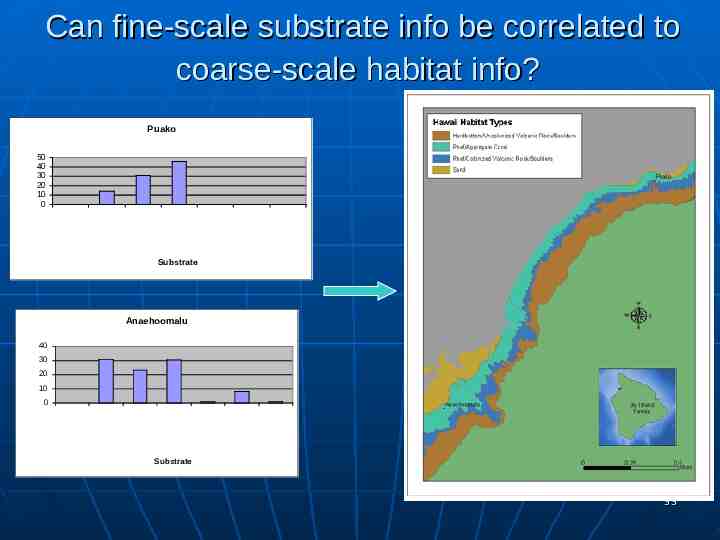
Can fine-scale substrate info be correlated to coarse-scale habitat info? Puako 50 40 30 20 10 0 Total % per location Boulder Porites Lobata Porites Dead CoralCompressa Rubble Sand Pocillopora meandrina Substrate Anaehoomalu 40 30 20 10 0 Total % per location Boulder Lobata Porites Porites Dead CoralCompressa Rubble Sand Pocillopora meandrina Substrate 33
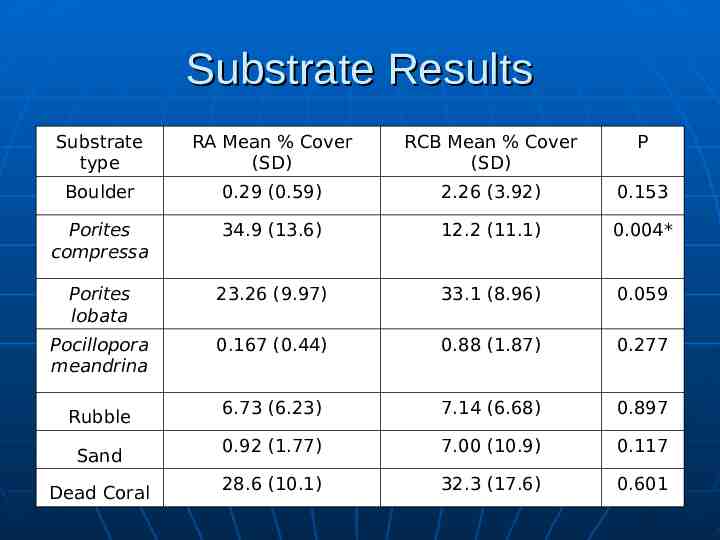
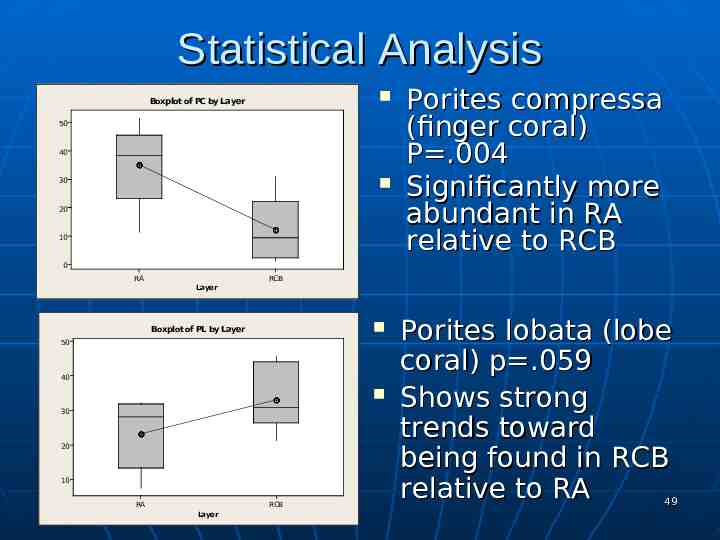
Substrate Results Substrate type RA Mean % Cover (SD) RCB Mean % Cover (SD) P Boulder 0.29 (0.59) 2.26 (3.92) 0.153 Porites compressa 34.9 (13.6) 12.2 (11.1) 0.004* Porites lobata 23.26 (9.97) 33.1 (8.96) 0.059 Pocillopora meandrina 0.167 (0.44) 0.88 (1.87) 0.277 6.73 (6.23) 7.14 (6.68) 0.897 0.92 (1.77) 7.00 (10.9) 0.117 28.6 (10.1) 32.3 (17.6) 0.601 Rubble Sand Dead Coral 34
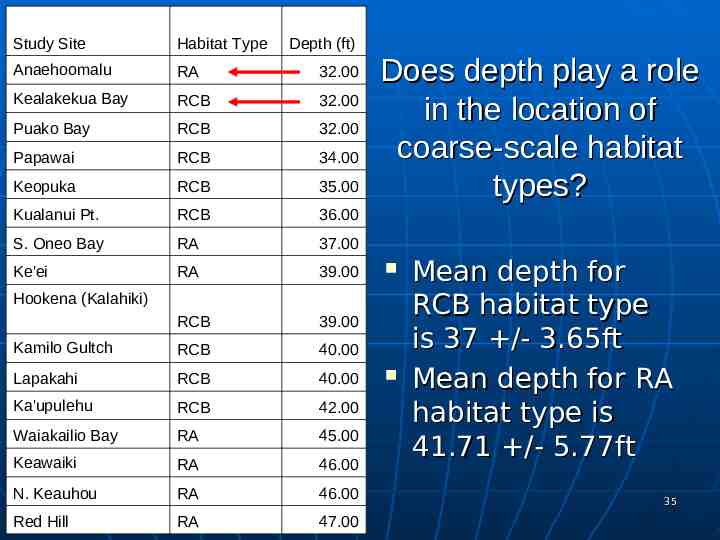
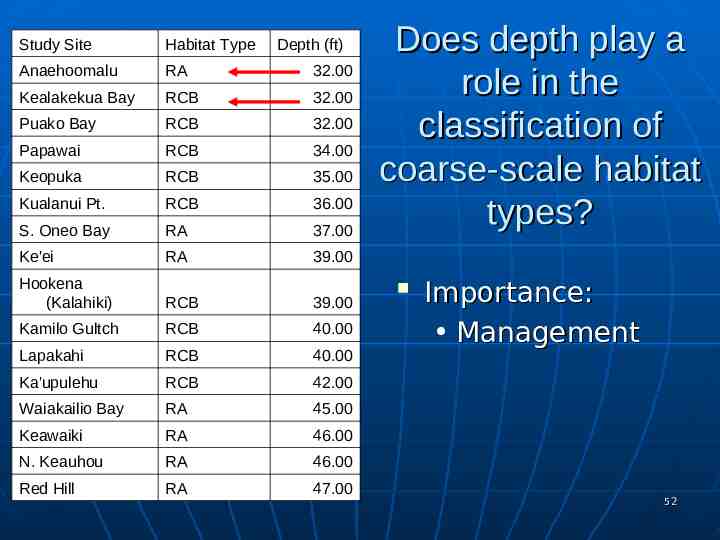
Study Site Habitat Type Depth (ft) Anaehoomalu RA 32.00 Kealakekua Bay RCB 32.00 Puako Bay RCB 32.00 Papawai RCB 34.00 Keopuka RCB 35.00 Kualanui Pt. RCB 36.00 S. Oneo Bay RA 37.00 Ke'ei RA 39.00 RCB 39.00 Kamilo Gultch RCB 40.00 Lapakahi RCB 40.00 Ka'upulehu RCB 42.00 Waiakailio Bay RA 45.00 Keawaiki RA 46.00 N. Keauhou RA 46.00 Red Hill RA 47.00 Does depth play a role in the location of coarse-scale habitat types? Hookena (Kalahiki) Mean depth for RCB habitat type is 37 /- 3.65ft Mean depth for RA habitat type is 41.71 /- 5.77ft 35
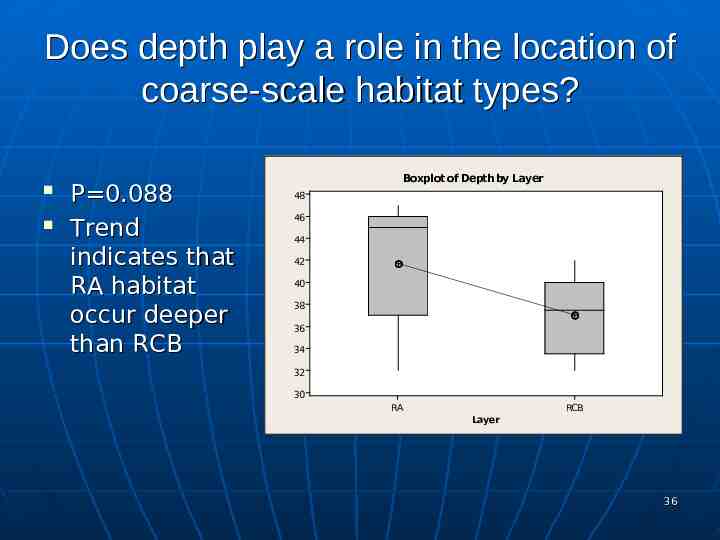
Does depth play a role in the location of coarse-scale habitat types? P 0.088 Trend indicates that RA habitat occur deeper than RCB Boxplot of Depth by Layer 48 46 44 42 h t p e 40 D 38 36 34 32 30 RA RCB Layer 36
Outline Background Part 1: The Marine Data Model (MDM) Research Questions Methods Results Part 2: Habitat Analysis Research Questions Methods Results Discussion and Conclusion 37
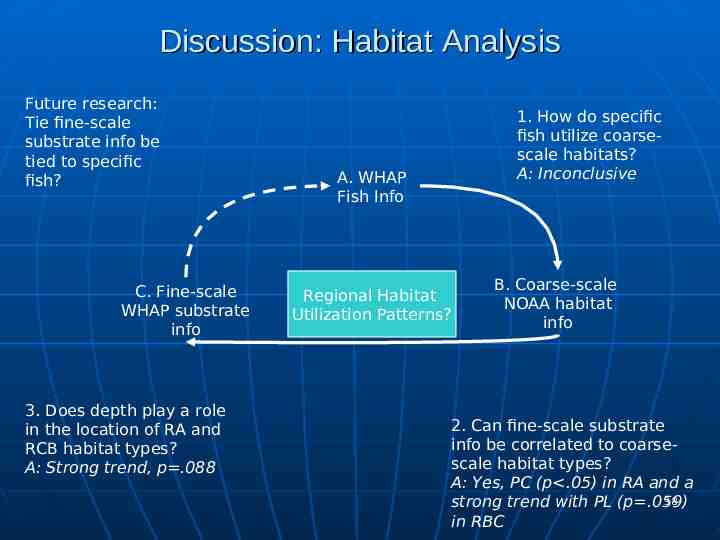
Discussion: Habitat Analysis Future research: Tie fine-scale substrate info be tied to specific fish? C. Fine-scale WHAP substrate info 3. Does depth play a role in the location of RA and RCB habitat types? A: Strong trend, p .088 1. How do specific fish utilize coarsescale habitats? A: Inconclusive A. WHAP Fish Info Regional Habitat Utilization Patterns? B. Coarse-scale NOAA habitat info 2. Can fine-scale substrate info be correlated to coarsescale habitat types? A: Yes, PC (p .05) in RA and a 38 strong trend with PL (p .059) in RBC
Conclusions: Management Use information from this study to evaluate current protected areas For example: RA habitat shows trends toward being located deeper P. compressa is found significantly more often in RA habitat P. compressa provides and important habitat for yellow tang (Tissot et al., 2003, Dollar, 1982) Thus, to protect the yellow tang, must have protected areas that extend into deeper waters Consistent with study that MPA encompassing range to depth values shown to be more efficient for yellow tang (Tissot et al, 2004) 39
Discussion Through habitat analysis: Goal 1: Met Goal 2: Met Goal 3: Met 40
Discussion: Ideal User? MDM is tailored to a specific user: Data Amount Variety Time Cost Experience of user Experienced GIS—use object-orientation Inexperienced—use template 41
Conclusions The MDM is a powerful tool Information to aid managers evaluate the West Coast MPAs Future research Data to HNHP 42
Thanks to: All the Rogues in Davy Jones The Hawaii Natural Heritage Program DAR, WHAP, CRAMP, and Saving Maui’s Reefs for letting me use their data 43
Questions? For more information on the marine data model go to: http://dusk.geo.orst.edu/djl/arcgis/ 44
45
46
Habitat Utilization Analysis (A) WHAP Fish Info (C) fine-scale WHAP substrate info 3. Does depth play a role in the classification of RA and RCB habitat types? Regional Habitat Utilization Patterns? 1. What is the habitat utilization pattern of selected fish species at a coarse-scale? (B) coarse-scale NOAA habitat info 2. Can fine-scale substrate information be correlated to coarse-scale habitat 47 types?
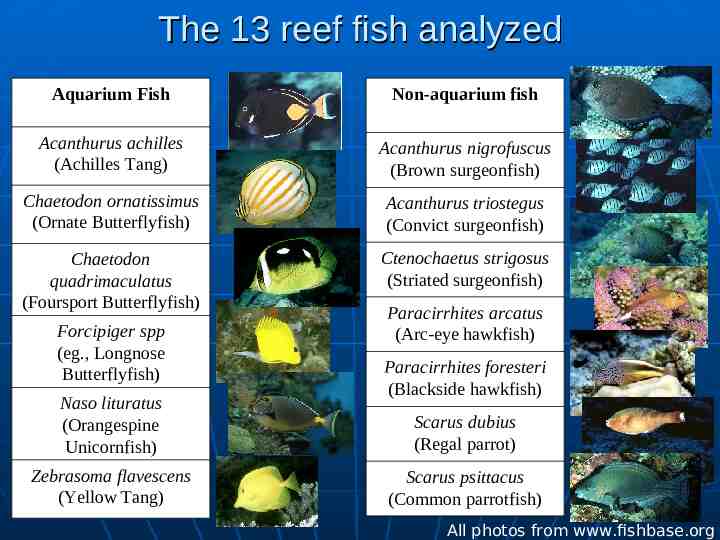
The 13 reef fish analyzed Aquarium Fish Non-aquarium fish Acanthurus achilles (Achilles Tang) Acanthurus nigrofuscus (Brown surgeonfish) Chaetodon ornatissimus (Ornate Butterflyfish) Acanthurus triostegus (Convict surgeonfish) Chaetodon quadrimaculatus (Foursport Butterflyfish) Ctenochaetus strigosus (Striated surgeonfish) Forcipiger spp (eg., Longnose Butterflyfish) Naso lituratus (Orangespine Unicornfish) Zebrasoma flavescens (Yellow Tang) Paracirrhites arcatus (Arc-eye hawkfish) Paracirrhites foresteri (Blackside hawkfish) Scarus dubius (Regal parrot) Scarus psittacus (Common parrotfish) 48 All photos from www.fishbase.org
Statistical Analysis Boxplot of PC by Layer 50 40 C 30 P 20 10 Porites compressa (finger coral) P .004 Significantly more abundant in RA relative to RCB 0 RA RCB Layer Boxplot of PL by Layer 50 40 30 L P 20 10 RA RCB Layer Porites lobata (lobe coral) p .059 Shows strong trends toward being found in RCB relative to RA 49
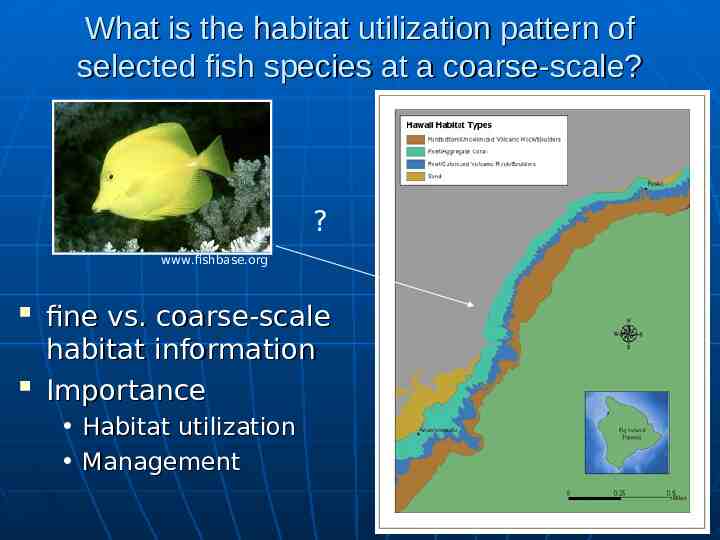
What is the habitat utilization pattern of selected fish species at a coarse-scale? ? www.fishbase.org fine vs. coarse-scale habitat information Importance Habitat utilization Management 50
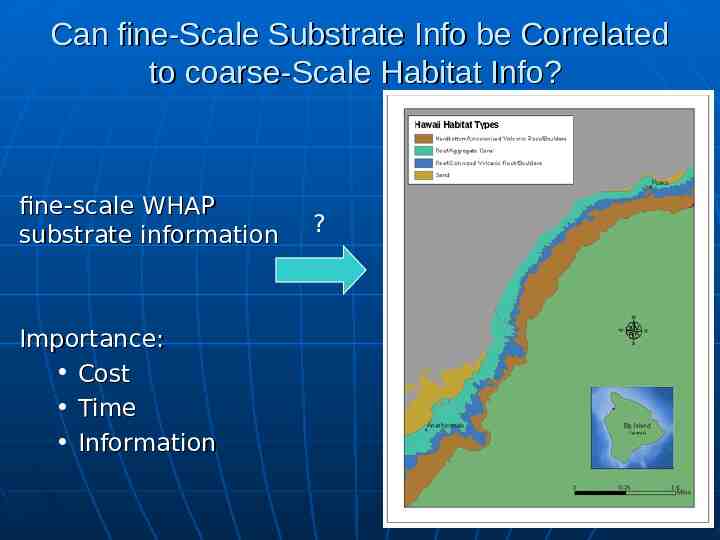
Can fine-Scale Substrate Info be Correlated to coarse-Scale Habitat Info? fine-scale WHAP substrate information ? Importance: Cost Time Information 51
Study Site Habitat Type Depth (ft) Anaehoomalu RA 32.00 Kealakekua Bay RCB 32.00 Puako Bay RCB 32.00 Papawai RCB 34.00 Keopuka RCB 35.00 Kualanui Pt. RCB 36.00 S. Oneo Bay RA 37.00 Ke'ei RA 39.00 Hookena (Kalahiki) RCB 39.00 Kamilo Gultch RCB 40.00 Lapakahi RCB 40.00 Ka'upulehu RCB 42.00 Waiakailio Bay RA 45.00 Keawaiki RA 46.00 N. Keauhou RA 46.00 Red Hill RA 47.00 Does depth play a role in the classification of coarse-scale habitat types? Importance: Management 52
Why use the MDM Model? Why a data model? 1. Standardized template 2. GIS and data management 3. 4. Implement project Organize data Easy to share Build upon Querying ability Object orientation 53
54