Blue Ocean Strategy Chapter 4: Focus On The Big Picture, Not The
28 Slides935.35 KB
Blue Ocean Strategy Chapter 4: Focus On The Big Picture, Not The Numbers Group 1 Tara Ferguson Jt Lehotsky Taylor Skidmore Sunny To
Next Question After knowing the paths to creating blue oceans “How do you align your strategic planning process to focus on the big picture and apply these ideas in drawing your company’s strategy canvas to arrive at a blue ocean strategy?” Most companies’ strategic planning process back to red ocean compete within existing market space
Why so serious? Typical strategic plan. Current industry conditions & competitive situations How to increase market share, capture new segments, cut loss goals & initiatives Attached budget, graphes, ect Data provided by people various parts of organization w/ conflicting agendas & poor communication Managers do what? Result: Oh so not good! – managers paralyzed, employees no idea Closer look no plan? Tactics w/ no direction
Focus on the Big Picture, Not the Numbers!!! Drawing a strategy canvas, build strategic planning process around it: Visualize a company’s current strategic position Chart future strategy Managers and employees focus on the big picture numbers and jargon and details How? Shows the strategic profile of an industry by depicting very clearly the factors that affect competition among industry players Shows the strategic profile of current and potential competitors, indentifying which factors they invest in strategically Shows the company’s strategic profile (value curve): how it invests in the factors of competition and how it might invest (w/ all 3 qualities: focus, divergence, and a compelling tagline)
Drawing strategy Canvas Assessing to what extent your company and its competitors offer the various competitive factors challenging w/in own responsibilty ok The whole industry hard Ex: catering manager of an airline & refreshment vs. customers & the complete offering Ex: CIO & the company’s IT infrastructure for its data- mining capacity vs. customers & speed, ease of use Drawing strategy canvas is awfully hard
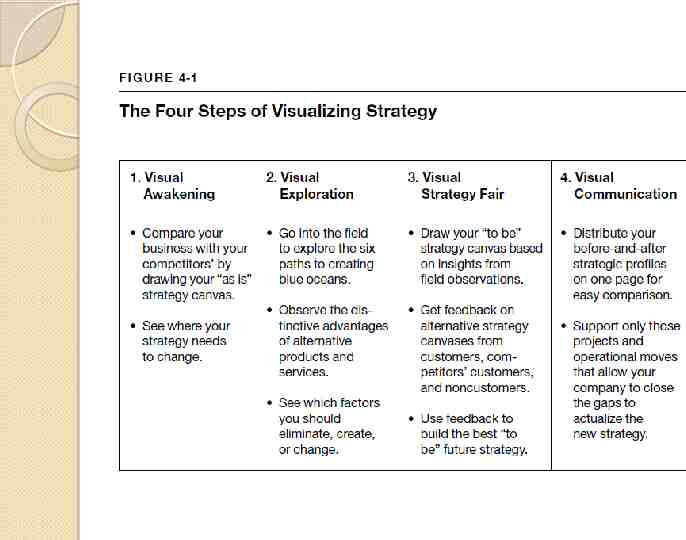
So what to do? Last ten years, a structured process for drawing and discussing a strategy canvas blue ocean 150-year-old financial services group- European Financial Services adopted this process to develop a strategy that breaks away from the competition 30% revenue boost in its initial year Process builds on the 6 paths of creating blue oceans & has a lot of visual stimulation to unlock people’s creativity 4 major steps
Step 1: Visual Awakening Common mistakes Discussing changes in strategy before resolving differences of opinion about the current state of play Reluctance to the need of change Then how do you get around to making changes?
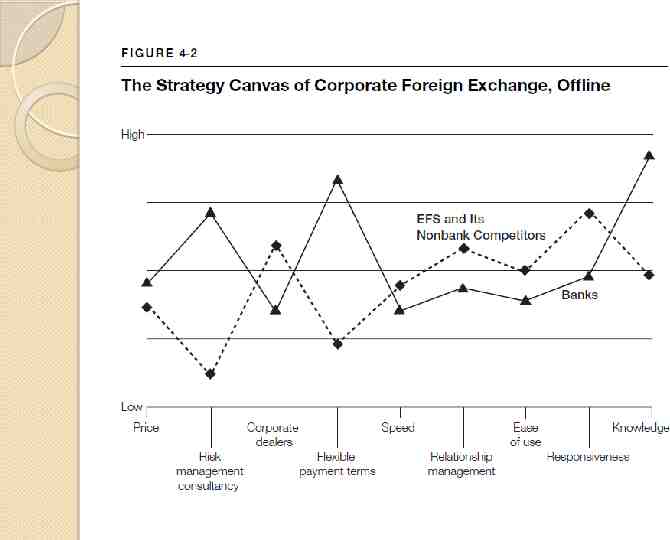
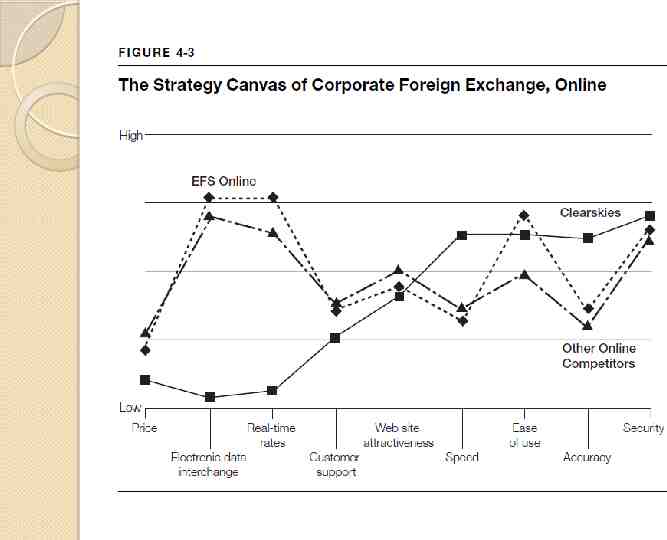
European Financial Services Poorly communicated strategy Deeply divided among regional subsidiaries and corporate executives Asked to chart their company’s strategy – but found that they must first reach a common understanding of their current position 20 senior managers Team 1 – Produce a value curve for EFS’s current strategic profile in traditional corporate foreign exchange business relative to competitors Team 2 – Produce the same but for EFS’s emerging online foreign exchange business
What constituted a competitive factor and what are those factors? Both teams dealt with heated debated because of different opinions Europeans – EFS had to offer consulting services on risk management Americans – Stressed the value of speed and ease of use Other – Customers would be drawn in by the promise of instant confirmation of their transactions Presented their work – Revealed defects Lack of focus Investing in diverse and numerous factors in both businesses Both were very similar to competitors Neither team could create a tagline to match their value curve Contradictions
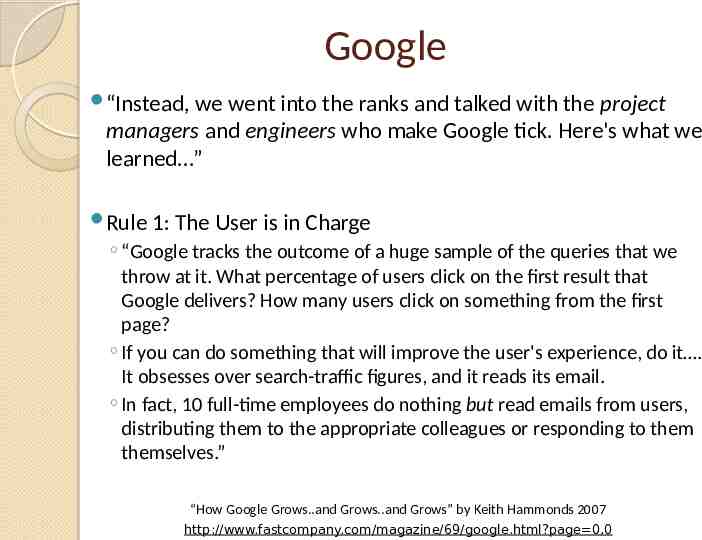
Google “Instead, we went into the ranks and talked with the project managers and engineers who make Google tick. Here's what we learned.” Rule 1: The User is in Charge “Google tracks the outcome of a huge sample of the queries that we throw at it. What percentage of users click on the first result that Google delivers? How many users click on something from the first page? If you can do something that will improve the user's experience, do it . It obsesses over search-traffic figures, and it reads its email. In fact, 10 full-time employees do nothing but read emails from users, distributing them to the appropriate colleagues or responding to them themselves.” “How Google Grows.and Grows.and Grows” by Keith Hammonds 2007 http://www.fastcompany.com/magazine/69/google.html?page 0,0
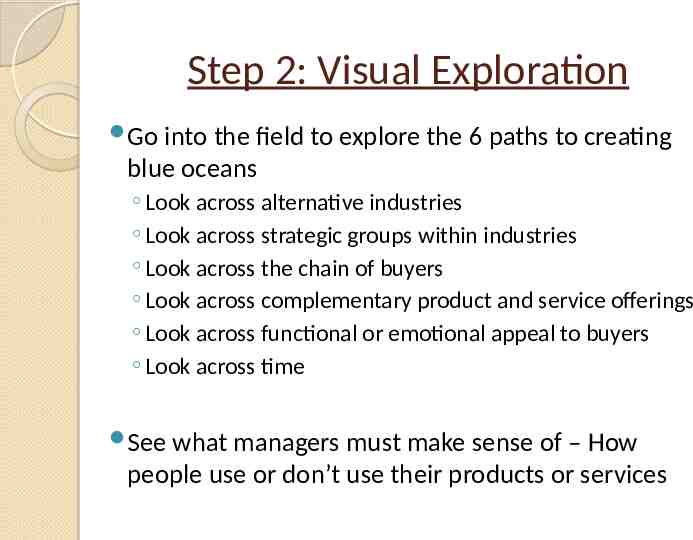
Step 2: Visual Exploration Go into the field to explore the 6 paths to creating blue oceans Look across alternative industries Look across strategic groups within industries Look across the chain of buyers Look across complementary product and service offerings Look across functional or emotional appeal to buyers Look across time See what managers must make sense of – How people use or don’t use their products or services
Never outsource your eyes! Talk to and watch Customers, Noncustomers, Users Look at how they might find alternative ways of fulfilling the need that your product/service satisfies Ex: Driving vs. flying Google vs. local library or newspaper Google vs. Yellow pages
EFS mangers in the field for 4 weeks Observe 10 people in corporate foreign exchange Lost customers New customers Customers of EFS’s competitors and alternatives Companies who did not yet use corporate foreign exchange services End users of corporate and foreign exchange services – the accounting and treasury departments Ancillary products and services also used – pricing simulations
Results Sent back to the drawing boards Each team had to create 6 value curves using the 6 path framework Each had to depict a strategy that would make EFS stand out in its market and a tagline Hopes to push the managers to break the boundaries of conventional thinking
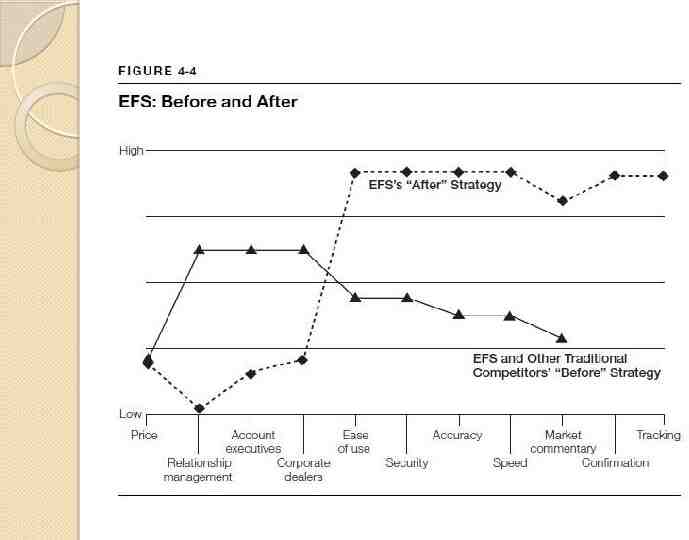
Step 3: Visual Strategy Fair Draw your “to be” strategy canvas based on insights from field observations. The EFS teams presented their strategy canvases at the visual strategy fair to senior executives and external constituencies. Get feedback on alternative strategy canvases from customers, competitors’ customers, and noncustomers.
Step 3: Continued EFS realized that one-third of what they had thought were key competitive factors were marginal to customers. Used feedback to build the best “to be” future strategy. EFS was able to draw a value curve that was truer to the existing strategic profile.
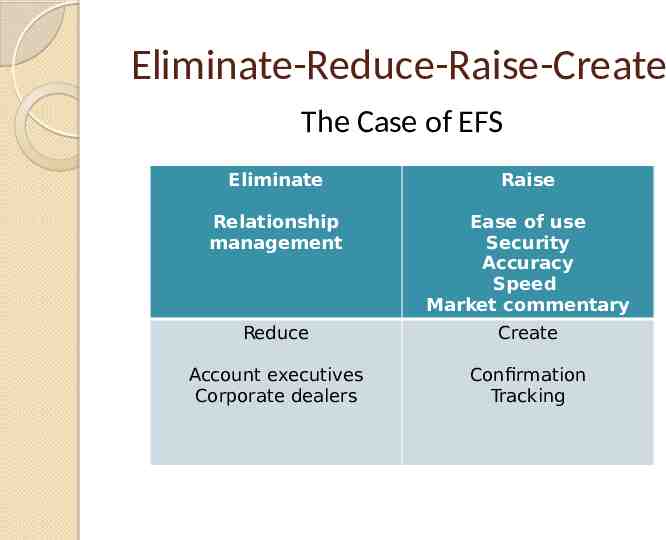
Eliminate-Reduce-Raise-Create The Case of EFS Eliminate Raise Relationship management Ease of use Security Accuracy Speed Market commentary Reduce Create Account executives Corporate dealers Confirmation Tracking
Step 4: Visual Communication Distribute your before and after strategic profiles to all employees for easy comparison. Support only those projects and operational moves that allow your company to close the gaps to actualize the new strategy.
Visualizing Strategy at the Corporate Level
Using the Strategy Canvas Blue Ocean companies have to communicate and not just worry about the numbers
Samsung Electronics Value Innovation Program (VIP) At the conference projects are shared through presentations and exhibitions and awards are given to the best. World’s leading 40” LCD TV in 2002 SGH T-100 worlds bestselling mobile phone
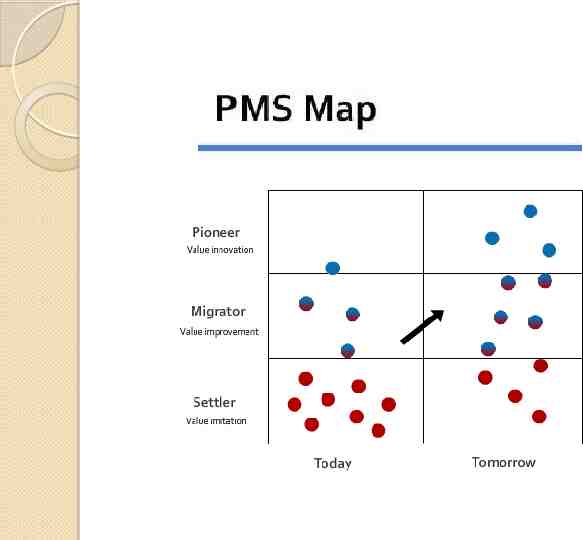
Pioneer- the businesses that offer unprecedented value. (RSS Feed) Settlers- businesses whose value curves conform to the basic shape of the industry’s. (Google Images) Migrators- lie somewhere in between Pioneers and Settlers. (Google Maps)
Strategic planning should be more about collective wisdom building than top-down or bottom-up planning. It should be more conversational than solely documentation driven.