Andover, Hebron and Marlborough 2014 Alcohol and Drug Use
25 Slides413.59 KB
Andover, Hebron and Marlborough 2014 Alcohol and Drug Use Student Survey Report Report and Presentation Prepared by ERASE, Inc. East of the River Action for Substance Abuse Elimination Presented by Bonnie Smith, M.P.H., Executive Director Report prepared by Sarah Sanborn, M.A., Research Analyst
Survey Methodology Survey was administered in May 2014 to students at RHAM Middle School (grades 7-8) and RHAM High School (grades 9-12) Parents could return a signed consent form if they did not want their child to participate in the student survey Surveys were completely anonymous Students completed the surveys online at SurveyMonkey.com; data was analyzed using SPSS Software.
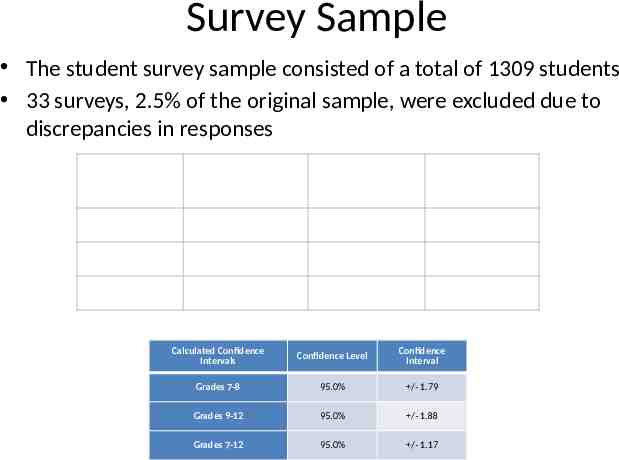
Survey Sample The student survey sample consisted of a total of 1309 students 33 surveys, 2.5% of the original sample, were excluded due to discrepancies in responses Sample Count Population Count Response Rate (%) Grades 7-8 506 students 609 students 83.1% Grades 9-12 798 students 1127 students 70.8% Grades 7-12 1309 students 1612 students 81.2% Calculated Confidence Intervals Confidence Level Confidence Interval Grades 7-8 95.0% /- 1.79 Grades 9-12 95.0% /- 1.88 Grades 7-12 95.0% /- 1.17
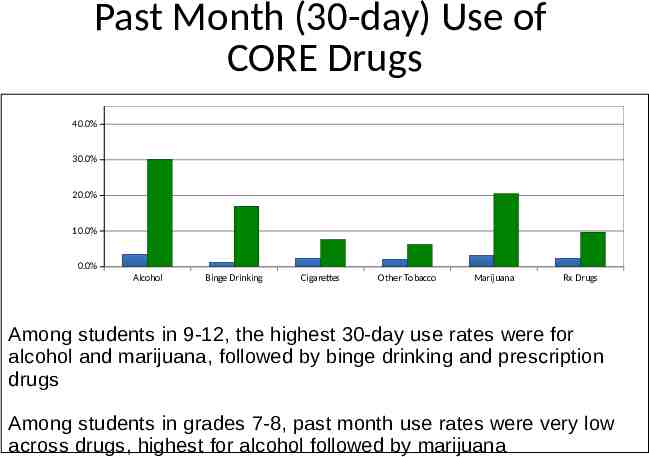
Past Month (30-day) Use of CORE Drugs 40.0% 30.0% 20.0% 10.0% 0.0% Alcohol Binge Drinking Cigarettes Other Tobacco Marijuana Rx Drugs Among students in 9-12, the highest 30-day use rates were for alcohol and marijuana, followed by binge drinking and prescription drugs Among students in grades 7-8, past month use rates were very low across drugs, highest for alcohol followed by marijuana
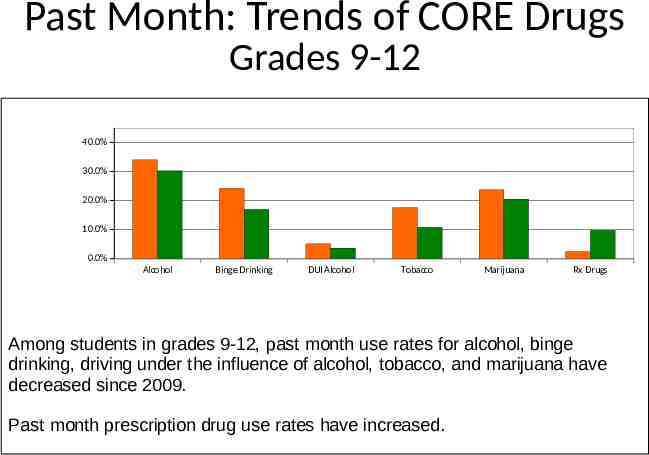
Past Month: Trends of CORE Drugs Grades 9-12 40.0% 30.0% 20.0% 10.0% 0.0% Alcohol Binge Drinking DUI Alcohol Tobacco Marijuana Rx Drugs Among students in grades 9-12, past month use rates for alcohol, binge drinking, driving under the influence of alcohol, tobacco, and marijuana have decreased since 2009. Past month prescription drug use rates have increased.
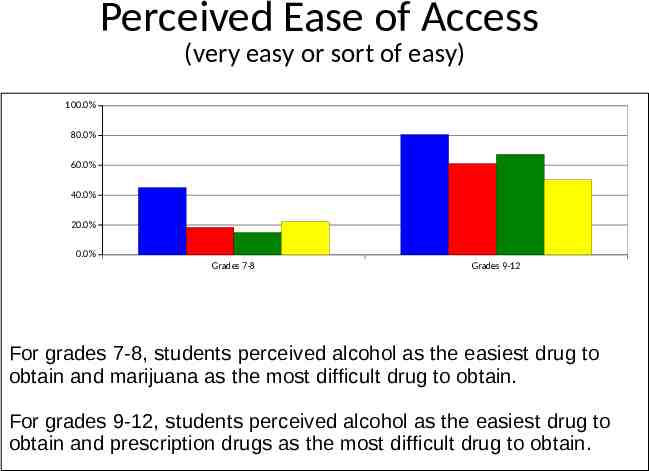
Perceived Ease of Access (very easy or sort of easy) 100.0% 80.0% 60.0% 40.0% 20.0% 0.0% Grades 7-8 Grades 9-12 For grades 7-8, students perceived alcohol as the easiest drug to obtain and marijuana as the most difficult drug to obtain. For grades 9-12, students perceived alcohol as the easiest drug to obtain and prescription drugs as the most difficult drug to obtain.
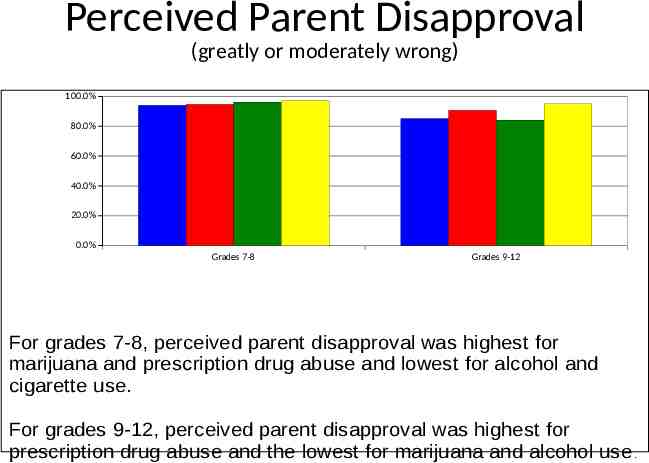
Perceived Parent Disapproval (greatly or moderately wrong) 100.0% 80.0% 60.0% 40.0% 20.0% 0.0% Grades 7-8 Grades 9-12 For grades 7-8, perceived parent disapproval was highest for marijuana and prescription drug abuse and lowest for alcohol and cigarette use. For grades 9-12, perceived parent disapproval was highest for prescription drug abuse and the lowest for marijuana and alcohol use .
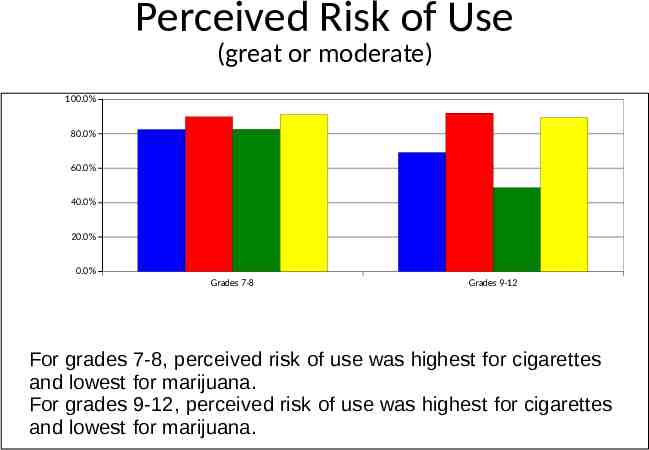
Perceived Risk of Use (great or moderate) 100.0% 80.0% 60.0% 40.0% 20.0% 0.0% Grades 7-8 Grades 9-12 For grades 7-8, perceived risk of use was highest for cigarettes and lowest for marijuana. For grades 9-12, perceived risk of use was highest for cigarettes and lowest for marijuana.
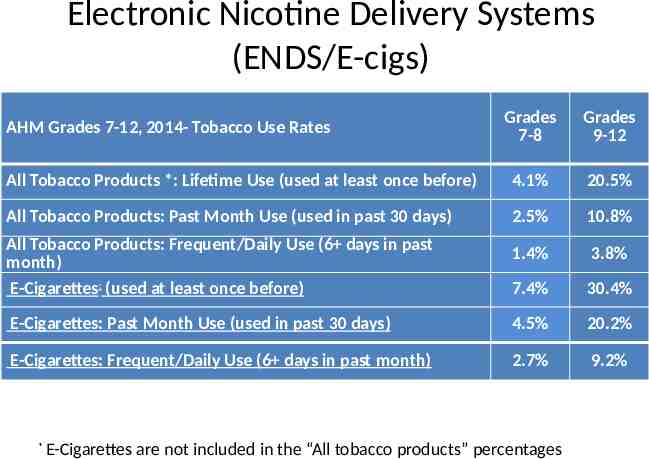
Electronic Nicotine Delivery Systems (ENDS/E-cigs) Grades 7-8 Grades 9-12 All Tobacco Products *: Lifetime Use (used at least once before) 4.1% 20.5% All Tobacco Products: Past Month Use (used in past 30 days) 2.5% 10.8% 1.4% 3.8% 7.4% 30.4% E-Cigarettes: Past Month Use (used in past 30 days) 4.5% 20.2% E-Cigarettes: Frequent/Daily Use (6 days in past month) 2.7% 9.2% AHM Grades 7-12, 2014- Tobacco Use Rates All Tobacco Products: Frequent/Daily Use (6 days in past month) E-Cigarettes: (used at least once before) * E-Cigarettes are not included in the “All tobacco products” percentages
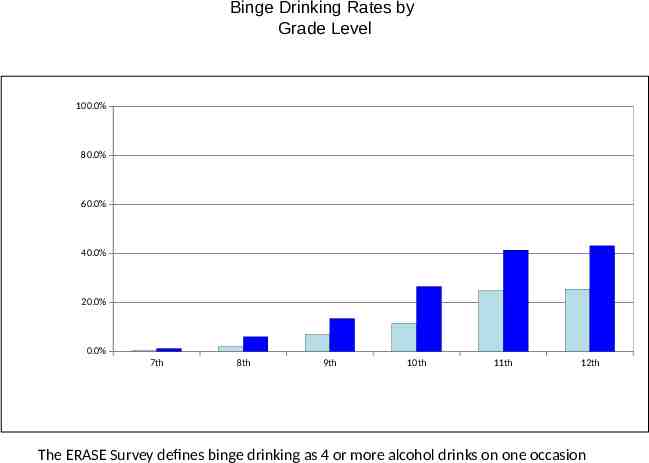
Binge Drinking Rates by Grade Level 100.0% 80.0% 60.0% 40.0% 20.0% 0.0% 7th 8th 9th 10th 11th 12th The ERASE Survey defines binge drinking as 4 or more alcohol drinks on one occasion
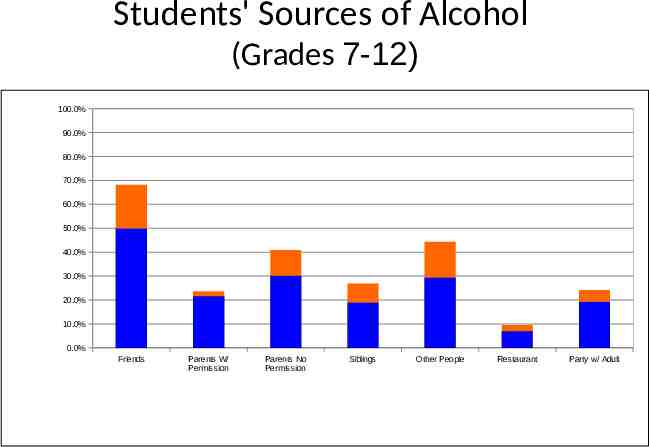
Students' Sources of Alcohol (Grades 7-12) 100.0% 90.0% 80.0% 70.0% 60.0% 50.0% 40.0% 30.0% 20.0% 10.0% 0.0% Friends Parents W/ Permission Parents No Permission Siblings Other People Restaurant Party w/ Adult
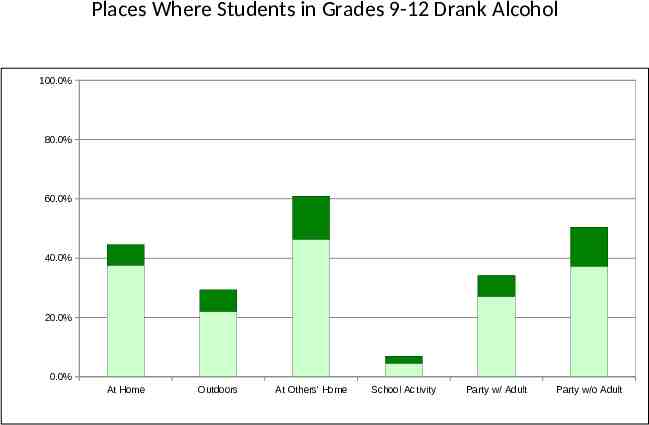
Places Where Students in Grades 9-12 Drank Alcohol 100.0% 80.0% 60.0% 40.0% 20.0% 0.0% At Home Outdoors At Others' Home School Activity Party w/ Adult Party w/o Adult
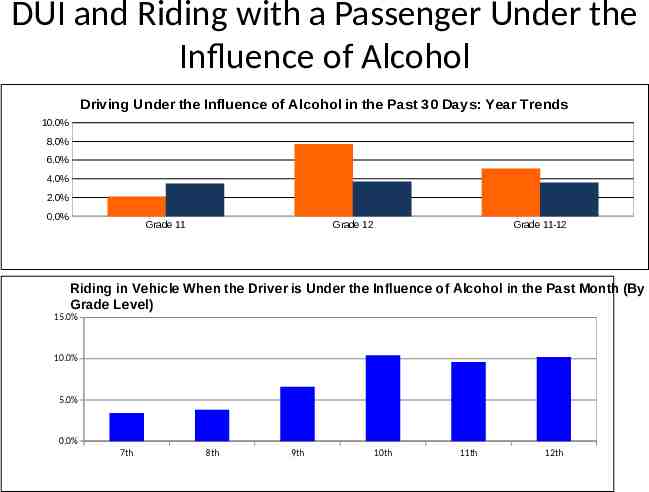
DUI and Riding with a Passenger Under the Influence of Alcohol Driving Under the Influence of Alcohol in the Past 30 Days: Year Trends 10.0% 8.0% 6.0% 4.0% 2.0% 0.0% Grade 11 Grade 12 Grade 11-12 Riding in Vehicle When the Driver is Under the Influence of Alcohol in the Past Month (By Grade Level) 15.0% 10.0% 5.0% 0.0% 7th 8th 9th 10th 11th 12th
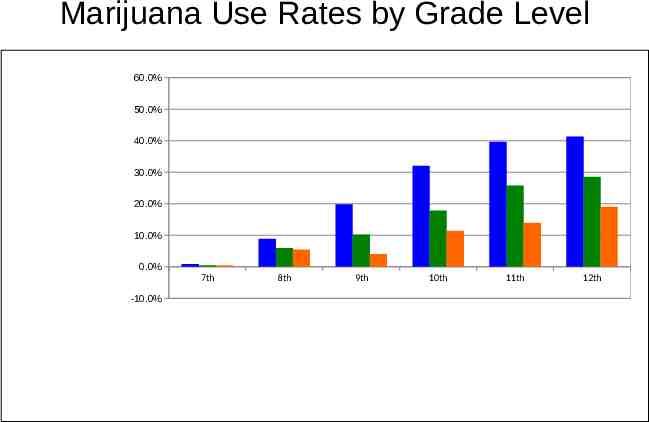
Marijuana Use Rates by Grade Level 60.0% 50.0% 40.0% 30.0% 20.0% 10.0% 0.0% 7th -10.0% 8th 9th 10th 11th 12th
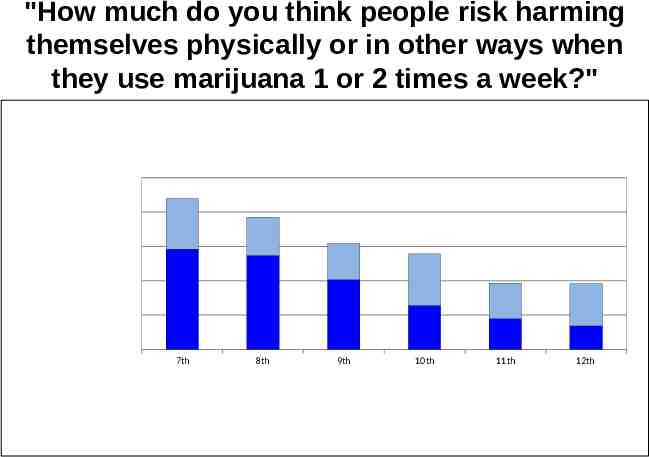
"How much do you think people risk harming themselves physically or in other ways when they use marijuana 1 or 2 times a week?" 7th 8th 9th 10th 11th 12th
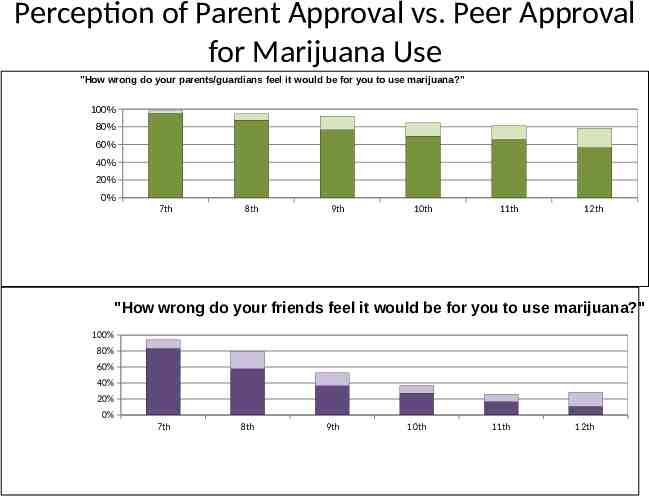
Perception of Parent Approval vs. Peer Approval for Marijuana Use "How wrong do your parents/guardians feel it would be for you to use marijuana?" 100% 80% 60% 40% 20% 0% 7th 8th 9th 10th 11th 12th "How wrong do your friends feel it would be for you to use marijuana?" 100% 80% 60% 40% 20% 0% 7th 8th 9th 10th 11th 12th
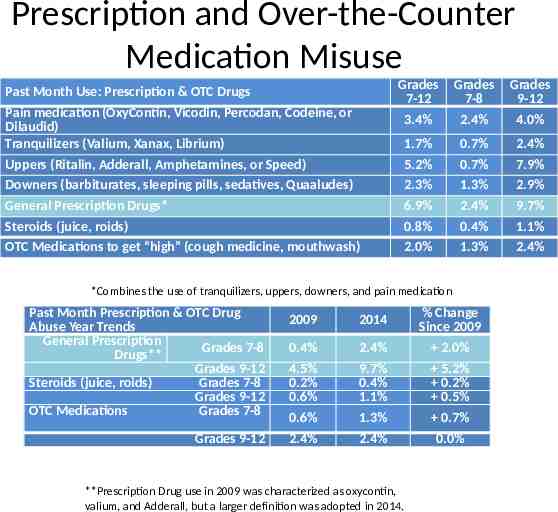
Prescription and Over-the-Counter Medication Misuse Past Month Use: Prescription & OTC Drugs Pain medication (OxyContin, Vicodin, Percodan, Codeine, or Dilaudid) Tranquilizers (Valium, Xanax, Librium) Uppers (Ritalin, Adderall, Amphetamines, or Speed) Downers (barbiturates, sleeping pills, sedatives, Quaaludes) General Prescription Drugs* Steroids (juice, roids) OTC Medications to get “high” (cough medicine, mouthwash) Grades 7-12 Grades 7-8 Grades 9-12 3.4% 2.4% 4.0% 1.7% 5.2% 2.3% 6.9% 0.8% 2.0% 0.7% 0.7% 1.3% 2.4% 0.4% 1.3% 2.4% 7.9% 2.9% 9.7% 1.1% 2.4% *Combines the use of tranquilizers, uppers, downers, and pain medication Past Month Prescription & OTC Drug Abuse Year Trends General Prescription Grades 7-8 Drugs** Grades 9-12 Steroids (juice, roids) Grades 7-8 Grades 9-12 OTC Medications Grades 7-8 Grades 9-12 2009 2014 % Change Since 2009 0.4% 2.4% 2.0% 4.5% 0.2% 0.6% 9.7% 0.4% 1.1% 5.2% 0.2% 0.5% 0.6% 1.3% 0.7% 2.4% 2.4% 0.0% **Prescription Drug use in 2009 was characterized as oxycontin, valium, and Adderall, but a larger definition was adopted in 2014.
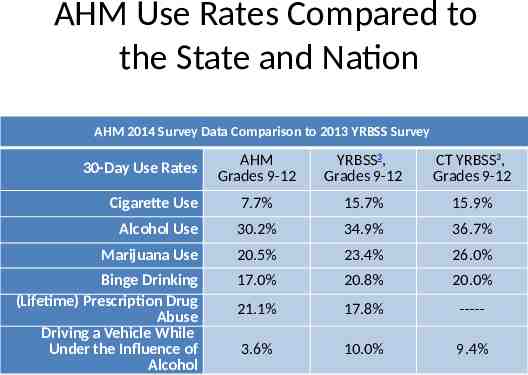
AHM Use Rates Compared to the State and Nation AHM 2014 Survey Data Comparison to 2013 YRBSS Survey AHM Grades 9-12 YRBSS3, Grades 9-12 CT YRBSS3, Grades 9-12 Cigarette Use 7.7% 15.7% 15.9% Alcohol Use 30.2% 34.9% 36.7% Marijuana Use 20.5% 23.4% 26.0% Binge Drinking (Lifetime) Prescription Drug Abuse Driving a Vehicle While Under the Influence of Alcohol 17.0% 20.8% 20.0% 21.1% 17.8% ----- 3.6% 10.0% 9.4% 30-Day Use Rates
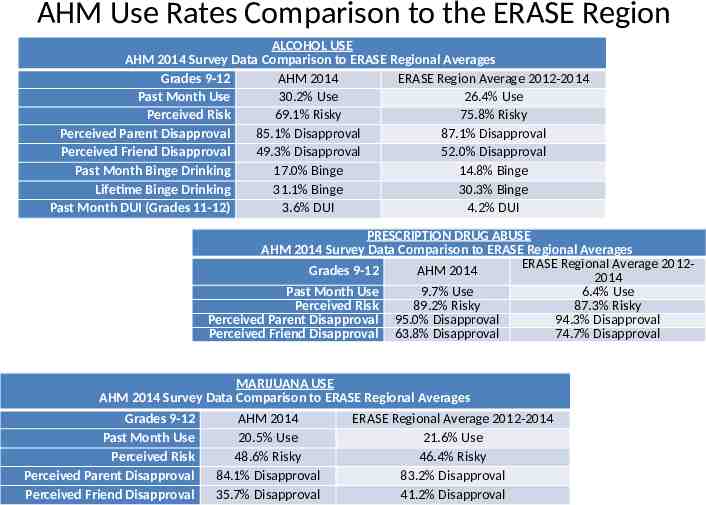
AHM Use Rates Comparison to the ERASE Region ALCOHOL USE AHM 2014 Survey Data Comparison to ERASE Regional Averages Grades 9-12 AHM 2014 ERASE Region Average 2012-2014 Past Month Use 30.2% Use 26.4% Use Perceived Risk 69.1% Risky 75.8% Risky Perceived Parent Disapproval 85.1% Disapproval 87.1% Disapproval Perceived Friend Disapproval 49.3% Disapproval 52.0% Disapproval Past Month Binge Drinking 17.0% Binge 14.8% Binge Lifetime Binge Drinking 31.1% Binge 30.3% Binge Past Month DUI (Grades 11-12) 3.6% DUI 4.2% DUI PRESCRIPTION DRUG ABUSE AHM 2014 Survey Data Comparison to ERASE Regional Averages ERASE Regional Average 2012Grades 9-12 AHM 2014 2014 Past Month Use 9.7% Use 6.4% Use Perceived Risk 89.2% Risky 87.3% Risky Perceived Parent Disapproval 95.0% Disapproval 94.3% Disapproval Perceived Friend Disapproval 63.8% Disapproval 74.7% Disapproval MARIJUANA USE AHM 2014 Survey Data Comparison to ERASE Regional Averages Grades 9-12 AHM 2014 ERASE Regional Average 2012-2014 Past Month Use 20.5% Use 21.6% Use Perceived Risk 48.6% Risky 46.4% Risky Perceived Parent Disapproval 84.1% Disapproval 83.2% Disapproval Perceived Friend Disapproval 35.7% Disapproval 41.2% Disapproval
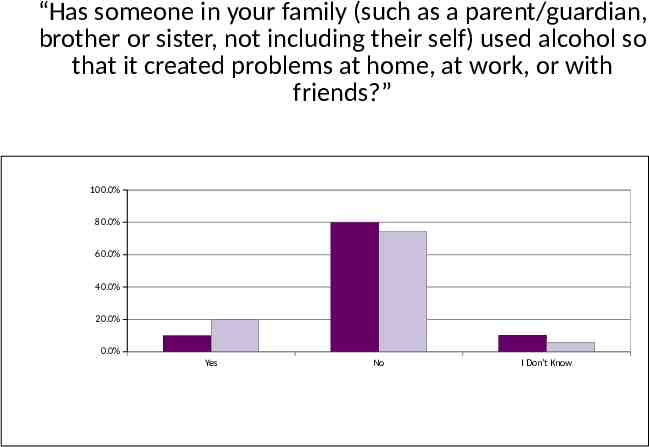
“Has someone in your family (such as a parent/guardian, brother or sister, not including their self) used alcohol so that it created problems at home, at work, or with friends?” 100.0% 80.0% 60.0% 40.0% 20.0% 0.0% Yes No I Don't Know
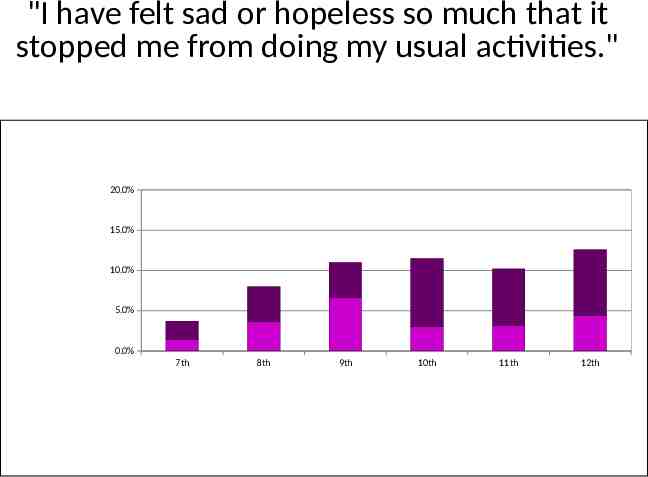
"I have felt sad or hopeless so much that it stopped me from doing my usual activities." 20.0% 15.0% 10.0% 5.0% 0.0% 7th 8th 9th 10th 11th 12th
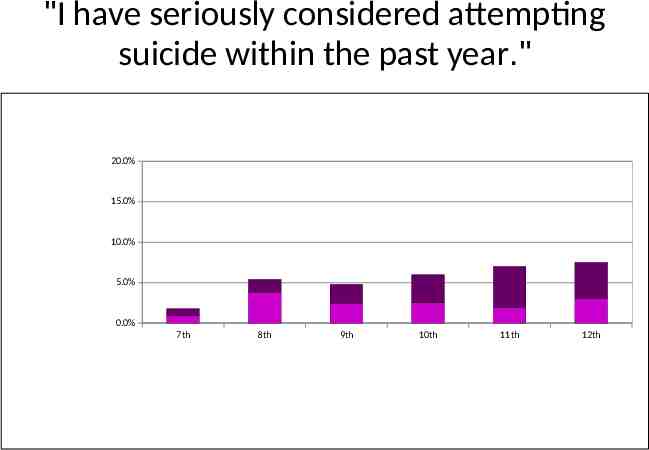
"I have seriously considered attempting suicide within the past year." 20.0% 15.0% 10.0% 5.0% 0.0% 7th 8th 9th 10th 11th 12th
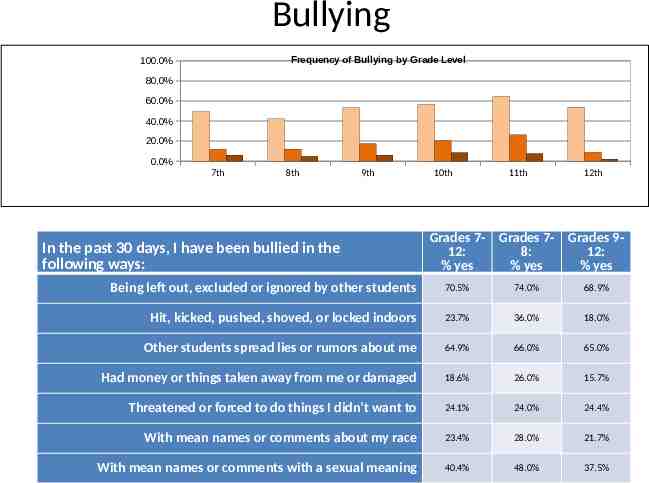
Bullying Frequency of Bullying by Grade Level 100.0% 80.0% 60.0% 40.0% 20.0% 0.0% 7th 8th 9th 10th 11th 12th Grades 712: % yes Grades 78: % yes Grades 912: % yes Being left out, excluded or ignored by other students 70.5% 74.0% 68.9% Hit, kicked, pushed, shoved, or locked indoors 23.7% 36.0% 18.0% Other students spread lies or rumors about me 64.9% 66.0% 65.0% Had money or things taken away from me or damaged 18.6% 26.0% 15.7% Threatened or forced to do things I didn’t want to 24.1% 24.0% 24.4% With mean names or comments about my race 23.4% 28.0% 21.7% With mean names or comments with a sexual meaning 40.4% 48.0% 37.5% In the past 30 days, I have been bullied in the following ways:
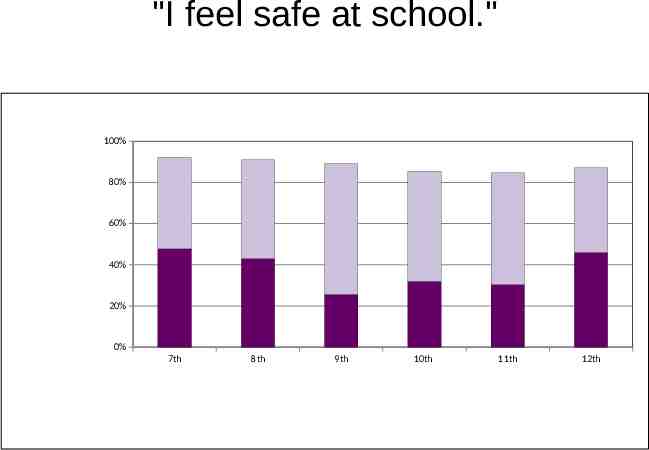
"I feel safe at school." 100% 80% 60% 40% 20% 0% 7th 8th 9th 10th 11th 12th
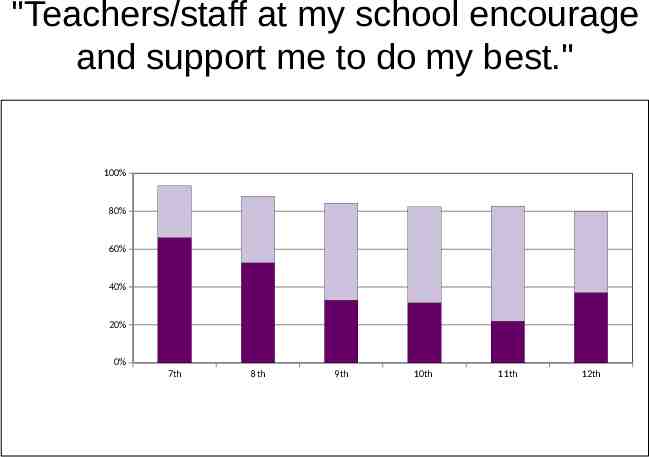
"Teachers/staff at my school encourage and support me to do my best." 100% 80% 60% 40% 20% 0% 7th 8th 9th 10th 11th 12th