1 STRATEGIC CAPACITY PLANNING Chapter 5 MIS 373: Basic


52 Slides4.38 MB
1 STRATEGIC CAPACITY PLANNING Chapter 5 MIS 373: Basic Operations Management
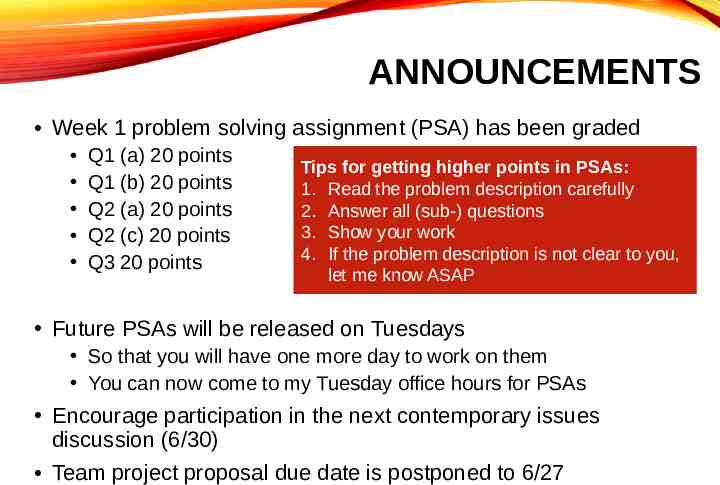
ANNOUNCEMENTS Week 1 problem solving assignment (PSA) has been graded Q1 (a) 20 points Q1 (b) 20 points Q2 (a) 20 points Q2 (c) 20 points Q3 20 points Tips for getting higher points in PSAs: 1. Read the problem description carefully 2. Answer all (sub-) questions 3. Show your work 4. If the problem description is not clear to you, let me know ASAP Future PSAs will be released on Tuesdays So that you will have one more day to work on them You can now come to my Tuesday office hours for PSAs Encourage participation in the next contemporary issues discussion (6/30) Team project proposal due date is postponed to 6/27
CONTEMPORARY ISSUES It appears to me that many of you were not particularly excited when peers were sharing contemporary issues. For the next contemporary issues session: You can go solo or form a team of two for a contemporary issue In your discussion, give more visual materials, e.g., Slides Video Picture Poster Role play any things that can make the issue more vivid and memorable
LEARNING OBJECTIVES After this lecture, students will be able to 1. 2. 3. 4. 5. Name the three key questions in capacity planning Explain the importance of capacity planning Describe ways of defining and measuring capacity Name several determinants of effective capacity Perform cost-volume analysis MIS 373: Basic Operations Management 4
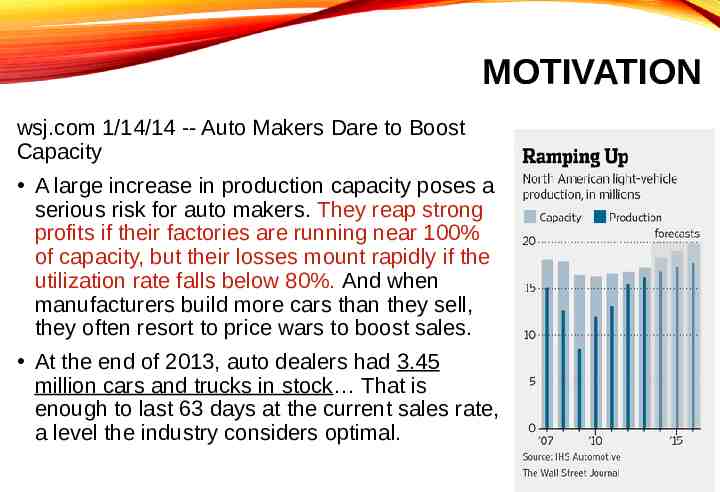
MOTIVATION wsj.com 1/14/14 -- Auto Makers Dare to Boost Capacity A large increase in production capacity poses a serious risk for auto makers. They reap strong profits if their factories are running near 100% of capacity, but their losses mount rapidly if the utilization rate falls below 80%. And when manufacturers build more cars than they sell, they often resort to price wars to boost sales. At the end of 2013, auto dealers had 3.45 million cars and trucks in stock That is enough to last 63 days at the current sales rate, a level the industry considers optimal.
CAPACITY PLANNING Capacity The upper limit or ceiling on the load that an operating unit can handle Capacity needs include Equipment Space Employee skills Strategic Capacity Planning To achieve a match between the long-term supply capabilities of an organization and the predicted level of long-term demand Over-capacity operating costs that are too high Under-capacity strained resources and possible loss of customers MIS 373: Basic Operations Management 6
CAPACITY PLANNING QUESTIONS Key Questions: What kind of capacity is needed? How much is needed to match demand? When is it needed? Related Questions: How much will it cost? What are the potential benefits and risks? Are there sustainability issues? Should capacity be changed all at once, or through several smaller changes Can the supply chain handle the necessary changes? MIS 373: Basic Operations Management 7
CAPACITY DECISIONS ARE STRATEGIC Capacity decisions: impact the ability of the organization to meet future demands When Microsoft introduced its new Xbox in late 2005, there were insufficient supplies, resulting in lost sales and unhappy customers. affect operating costs Costs of over- and under-capacity affect competitiveness capacity can affect delivery speed affect the ease of management (often) involve long-term commitment of resources MIS 373: Basic Operations Management 8
CAPACITY Design capacity Maximum output rate or service capacity an operation, process, or facility is designed for Effective capacity Design capacity minus allowances such as personal time, maintenance, and scrap Actual output Rate of output actually achieved--cannot exceed effective capacity. MIS 373: Basic Operations Management 9
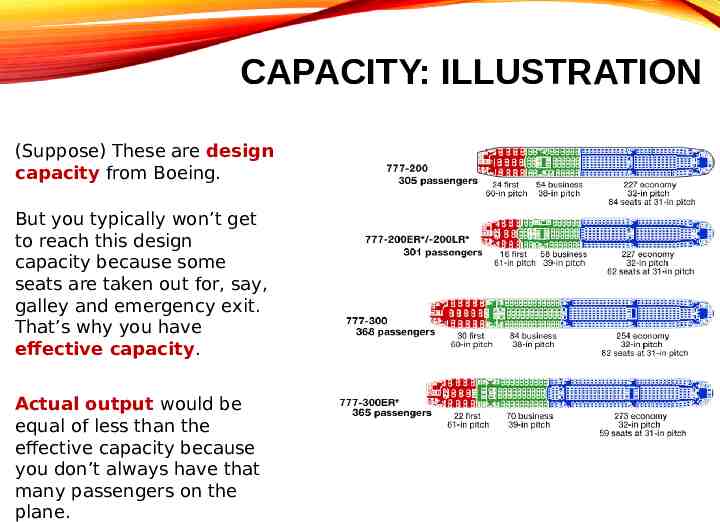
CAPACITY: ILLUSTRATION (Suppose) These are design capacity from Boeing. But you typically won’t get to reach this design capacity because some seats are taken out for, say, galley and emergency exit. That’s why you have effective capacity. Actual output would be equal of less than the effective capacity because you don’t always have that many passengers on the plane.
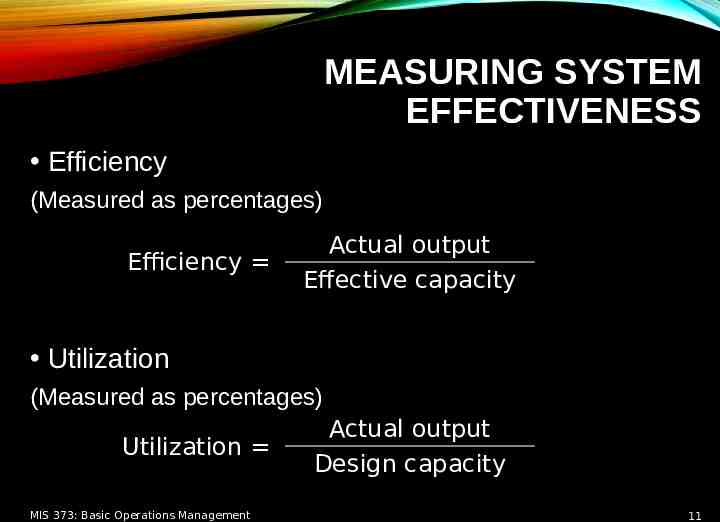
MEASURING SYSTEM EFFECTIVENESS Efficiency (Measured as percentages) Efficiency Actual output Effective capacity Utilization (Measured as percentages) Utilization MIS 373: Basic Operations Management Actual output Design capacity 11
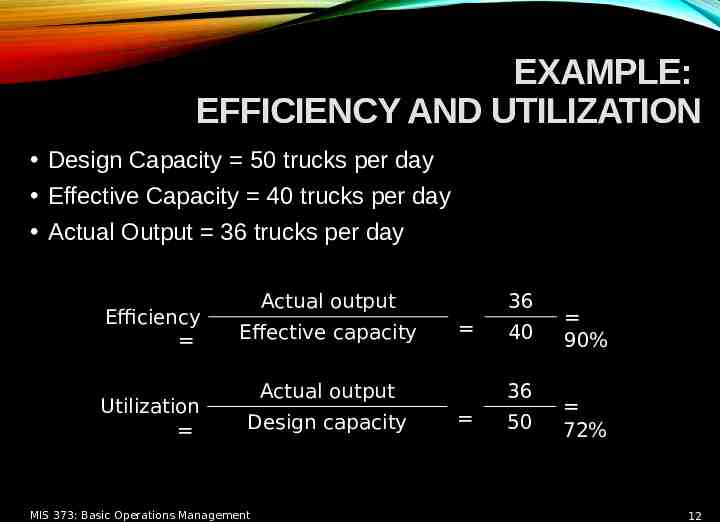
EXAMPLE: EFFICIENCY AND UTILIZATION Design Capacity 50 trucks per day Effective Capacity 40 trucks per day Actual Output 36 trucks per day Efficiency Utilization Actual output Effective capacity 36 Actual output Design capacity MIS 373: Basic Operations Management 40 36 50 90% 72% 12
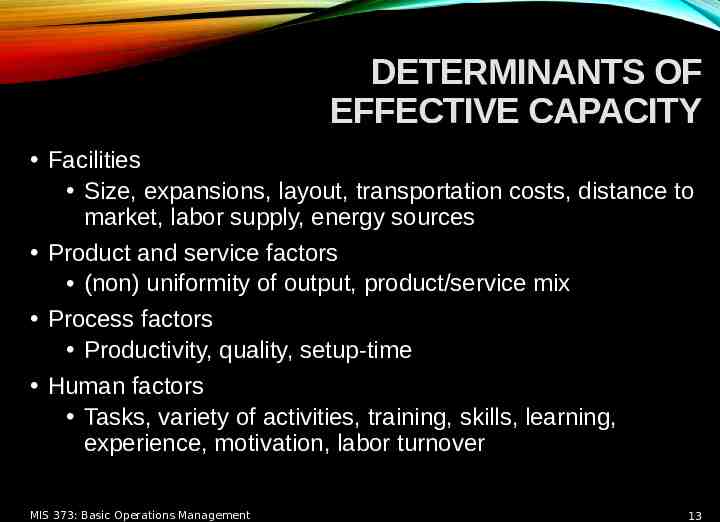
DETERMINANTS OF EFFECTIVE CAPACITY Facilities Size, expansions, layout, transportation costs, distance to market, labor supply, energy sources Product and service factors (non) uniformity of output, product/service mix Process factors Productivity, quality, setup-time Human factors Tasks, variety of activities, training, skills, learning, experience, motivation, labor turnover MIS 373: Basic Operations Management 13
DETERMINANTS OF EFFECTIVE CAPACITY Policy factors Overtime, second/third shifts Operational factors Scheduling, inventory, purchasing, materials, quality assurance/control, breakdowns, maintenance Supply chain factors Suppliers, warehousing, transportation, distributors External factors Product standards, minimum quality, safety, environment, regulations, unions MIS 373: Basic Operations Management 14
CAPACITY CUSHION / SAFETY CAPACITY Capacity Cushion / Safety Capacity Extra capacity used to offset demand uncertainty Capacity cushion Capacity – expected demand Capacity cushion strategy Organizations that have greater demand uncertainty typically use greater capacity cushion Organizations that have standard products and services generally use smaller capacity cushion MIS 373: Basic Operations Management 15
DEMAND MANAGEMENT STRATEGIES Strategies used to offset capacity limitations and that are intended to achieve a closer match between supply and demand Appointments Pricing Promotions Discounts Other tactics to shift demand from peak periods into slow periods MIS 373: Basic Operations Management 16
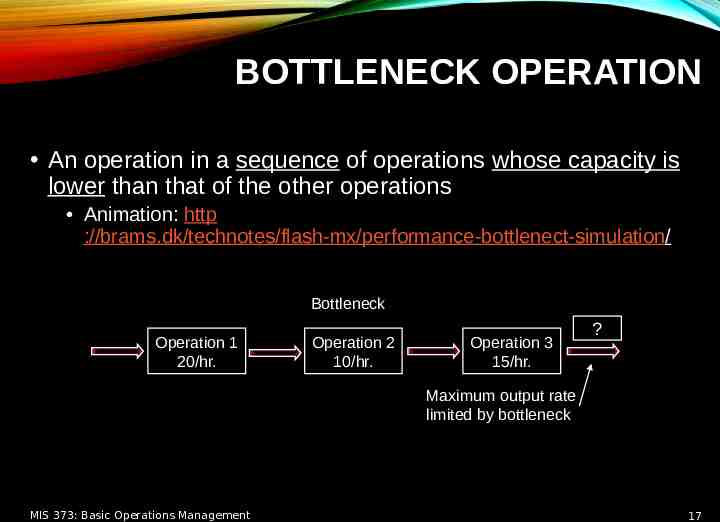
BOTTLENECK OPERATION An operation in a sequence of operations whose capacity is lower than that of the other operations Animation: http ://brams.dk/technotes/flash-mx/performance-bottlenect-simulation/ Bottleneck Operation 1 20/hr. Operation 2 10/hr. Operation 3 15/hr. ? 10/hr. Maximum output rate limited by bottleneck MIS 373: Basic Operations Management 17
CAPACITY STRATEGIES Leading Build capacity in anticipation of future demand increases E.g., let’s expand the restaurant because we expect to serve more customers in the next year Following Build capacity when demand exceeds current capacity E.g., let’s expand the restaurant because we have been full up all the time in the past year Tracking Similar to the following strategy, but adds capacity in relatively small increments to keep pace with increasing demand E.g., let’s expand the restaurant because we have been full up all the time in the past month MIS 373: Basic Operations Management 18
FORECASTING CAPACITY REQUIREMENTS Long-term considerations relate to overall level of capacity requirements Require forecasting demand over a time horizon and converting those needs into capacity requirements E.g., Our hotel expect to serve 10 thousand customers next year. Short-term considerations relate to probable variations in capacity requirements Less concerned with cycles and trends than with seasonal variations and other variations from average E.g., Our hotel expect to serve 10 thousand customers next year. But the demand will be higher in the summer, lower in the winter, and normal in the spring and fall. MIS 373: Basic Operations Management 19
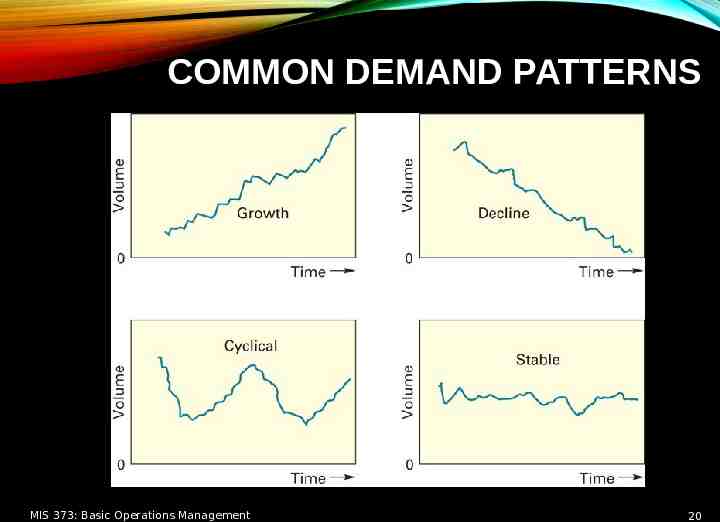
COMMON DEMAND PATTERNS MIS 373: Basic Operations Management 20
EXERCISE Suppose that you are a capacity planner in General Motor. Discuss with a partner. What would you do to make sure you have the right capacity in GM? Prediction? How? Planning? How? What other information do you need?
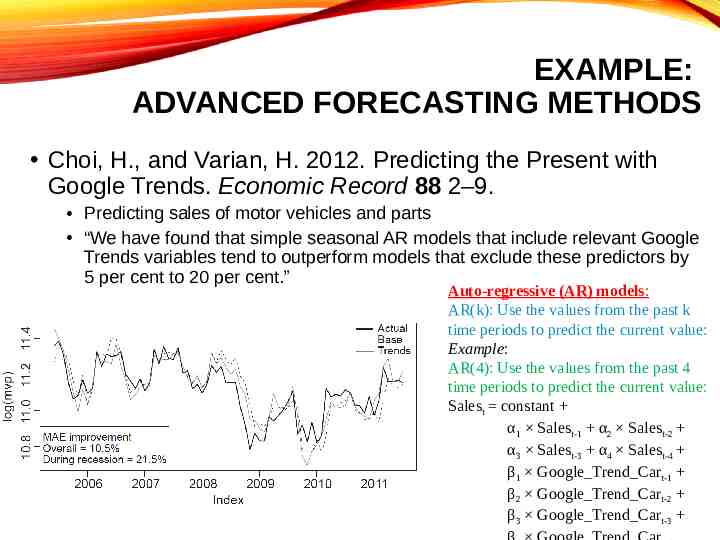
EXAMPLE: ADVANCED FORECASTING METHODS Choi, H., and Varian, H. 2012. Predicting the Present with Google Trends. Economic Record 88 2–9. Predicting sales of motor vehicles and parts “We have found that simple seasonal AR models that include relevant Google Trends variables tend to outperform models that exclude these predictors by 5 per cent to 20 per cent.” Auto-regressive (AR) models: AR(k): Use the values from the past k time periods to predict the current value: Example: AR(4): Use the values from the past 4 time periods to predict the current value: Salest constant α1 Salest-1 α2 Salest-2 α3 Salest-3 α4 Salest-4 β1 Google Trend Cart-1 β2 Google Trend Cart-2 β3 Google Trend Cart-3
EXAMPLE: ADVANCED FORECASTING METHODS Google Flu Trend
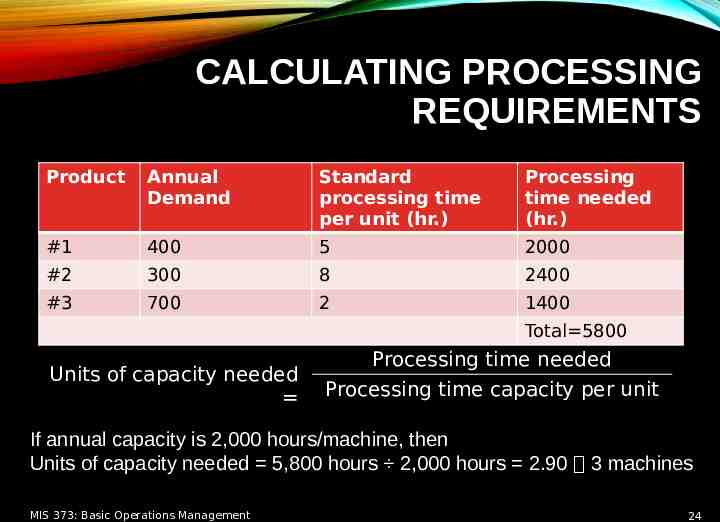
CALCULATING PROCESSING REQUIREMENTS Product Annual Demand Standard processing time per unit (hr.) Processing time needed (hr.) #1 400 5 2000 #2 300 8 2400 #3 700 2 1400 Total 5800 Units of capacity needed Processing time needed Processing time capacity per unit If annual capacity is 2,000 hours/machine, then Units of capacity needed 5,800 hours 2,000 hours 2.90 3 machines MIS 373: Basic Operations Management 24
SERVICE CAPACITY PLANNING Service capacity planning can present a number of challenges related to: The need to be near customers Convenience The inability to store services Cannot store services for consumption later The degree of demand volatility Volume and timing of demand Time required to service individual customers MIS 373: Basic Operations Management 25
IN-HOUSE OR OUTSOURCE Once capacity requirements have been determined, the organization must decide whether to produce a good or provide a service itself, or to outsource from another organization. Factors to consider when deciding whether to operate in-house or outsource Available capacity Expertise Quality considerations The nature of demand Cost Risks MIS 373: Basic Operations Management 26
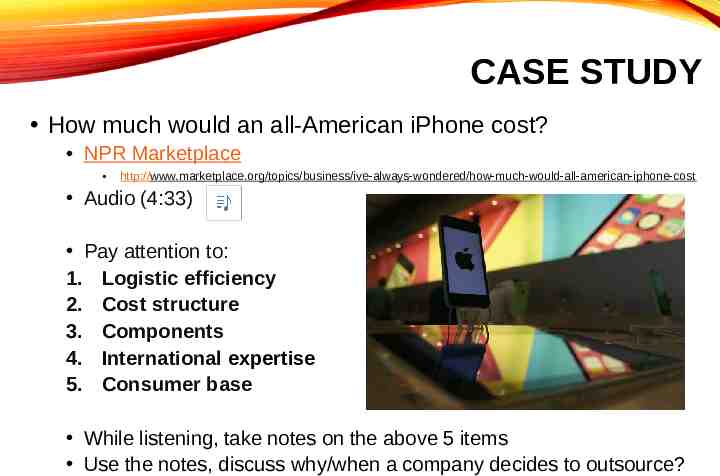
CASE STUDY How much would an all-American iPhone cost? NPR Marketplace http://www.marketplace.org/topics/business/ive-always-wondered/how-much-would-all-american-iphone-cost Audio (4:33) Pay attention to: 1. Logistic efficiency 2. Cost structure 3. Components 4. International expertise 5. Consumer base While listening, take notes on the above 5 items Use the notes, discuss why/when a company decides to outsource?
DEVELOPING CAPACITY STRATEGIES There are a number of ways to enhance development of capacity strategies: 1. Design flexibility into systems E.g., SSD and USB Flash Drive 2. 3. 4. 5. Take a “big-picture” (i.e., systems) approach to capacity changes Attempt to smooth out capacity requirements Take stage of life cycle into account Identify the optimal operating level: economies of scale MIS 373: Basic Operations Management 28
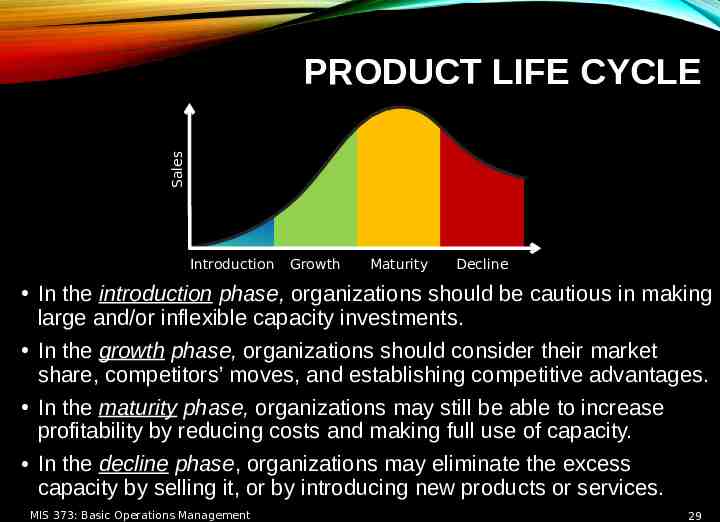
Sales PRODUCT LIFE CYCLE Introduction Growth Maturity Decline In the introduction phase, organizations should be cautious in making large and/or inflexible capacity investments. In the growth phase, organizations should consider their market share, competitors’ moves, and establishing competitive advantages. In the maturity phase, organizations may still be able to increase profitability by reducing costs and making full use of capacity. In the decline phase, organizations may eliminate the excess capacity by selling it, or by introducing new products or services. MIS 373: Basic Operations Management 29
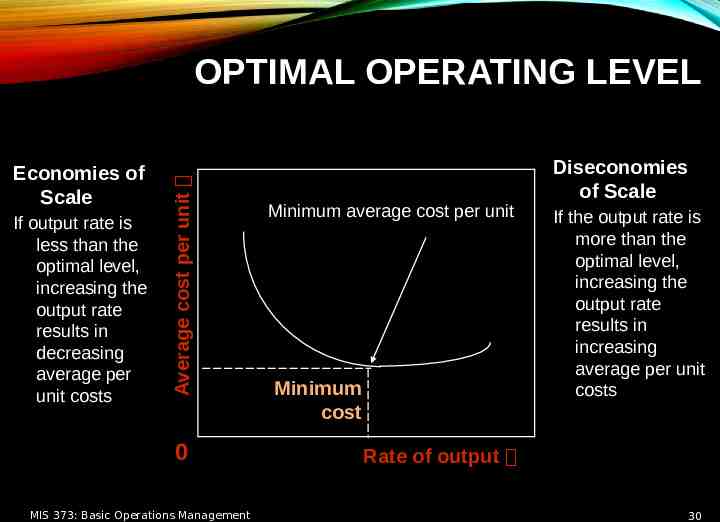
Economies of Scale If output rate is less than the optimal level, increasing the output rate results in decreasing average per unit costs Average cost per unit OPTIMAL OPERATING LEVEL 0 MIS 373: Basic Operations Management Minimum average cost per unit Minimum cost Diseconomies of Scale If the output rate is more than the optimal level, increasing the output rate results in increasing average per unit costs Rate of output 30
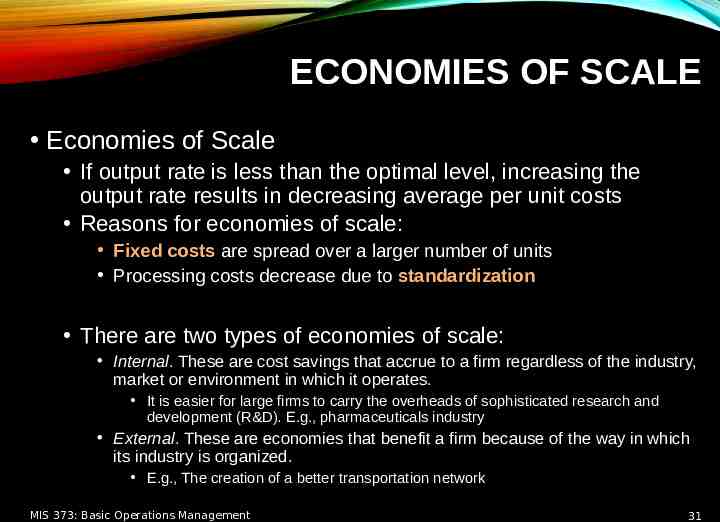
ECONOMIES OF SCALE Economies of Scale If output rate is less than the optimal level, increasing the output rate results in decreasing average per unit costs Reasons for economies of scale: Fixed costs are spread over a larger number of units Processing costs decrease due to standardization There are two types of economies of scale: Internal. These are cost savings that accrue to a firm regardless of the industry, market or environment in which it operates. It is easier for large firms to carry the overheads of sophisticated research and development (R&D). E.g., pharmaceuticals industry External. These are economies that benefit a firm because of the way in which its industry is organized. E.g., The creation of a better transportation network MIS 373: Basic Operations Management 31
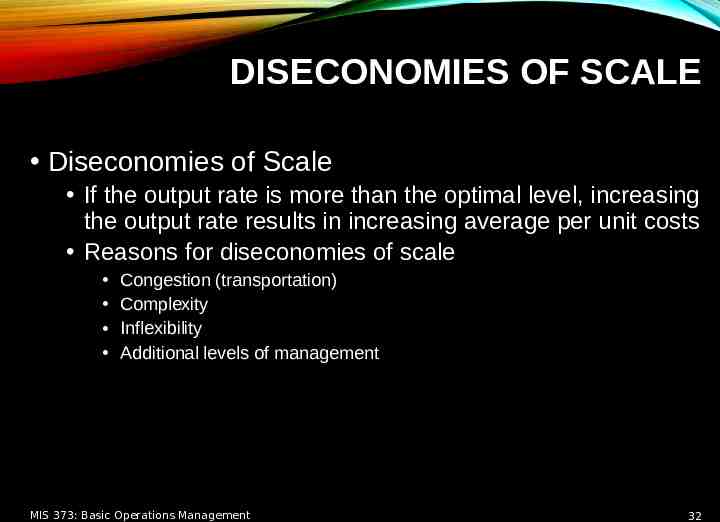
DISECONOMIES OF SCALE Diseconomies of Scale If the output rate is more than the optimal level, increasing the output rate results in increasing average per unit costs Reasons for diseconomies of scale Congestion (transportation) Complexity Inflexibility Additional levels of management MIS 373: Basic Operations Management 32
DISCUSSIONS Discuss with a partner: What are the examples that a company/product failed because it did not achieve economies of scale (i.e., too small to compete)? If possible, also discuss why they failed to achieve economies of scale. Was it because of the problems in marketing, finance, or operations? What are the examples that a company/product failed because of it encountered diseconomies of scale (i.e., too big to compete)?
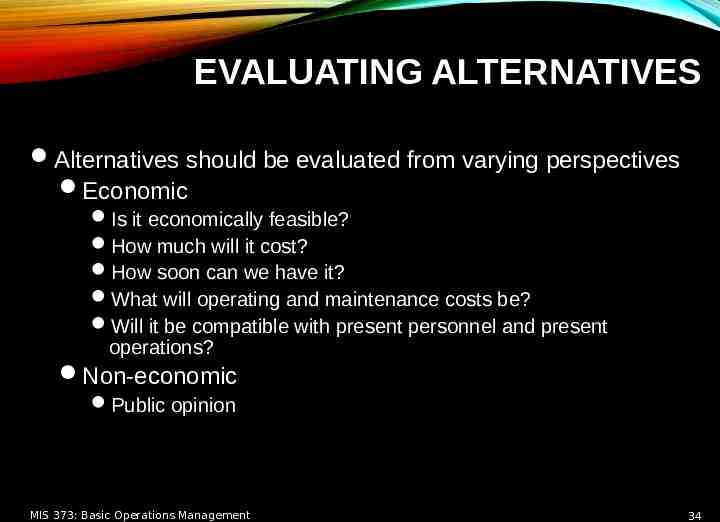
EVALUATING ALTERNATIVES Alternatives should be evaluated from varying perspectives Economic Is it economically feasible? How much will it cost? How soon can we have it? What will operating and maintenance costs be? Will it be compatible with present personnel and present operations? Non-economic Public opinion MIS 373: Basic Operations Management 34
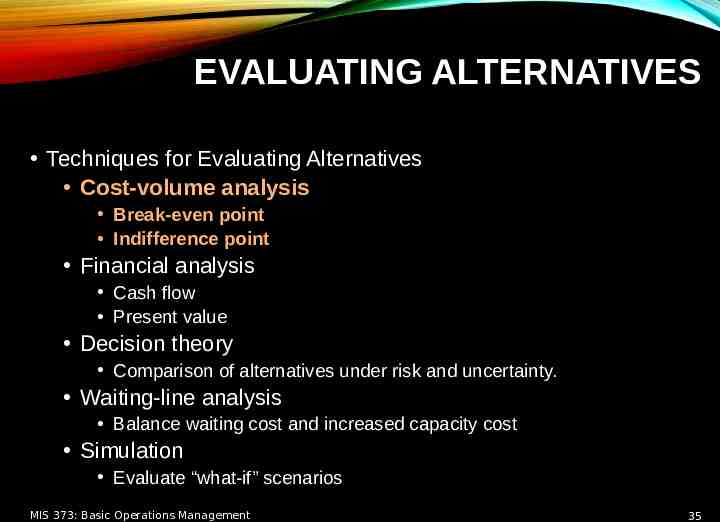
EVALUATING ALTERNATIVES Techniques for Evaluating Alternatives Cost-volume analysis Break-even point Indifference point Financial analysis Cash flow Present value Decision theory Comparison of alternatives under risk and uncertainty. Waiting-line analysis Balance waiting cost and increased capacity cost Simulation Evaluate “what-if” scenarios MIS 373: Basic Operations Management 35
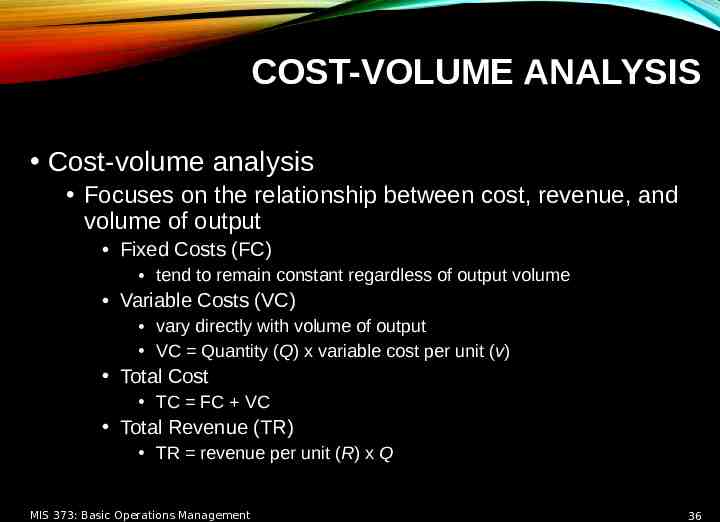
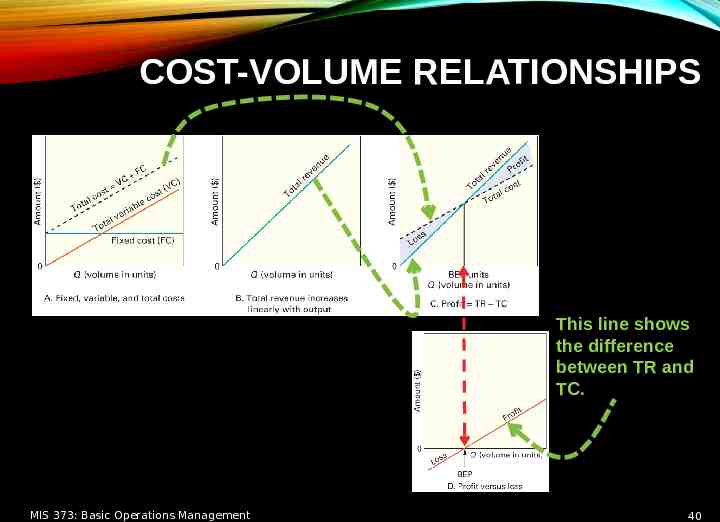
COST-VOLUME ANALYSIS Cost-volume analysis Focuses on the relationship between cost, revenue, and volume of output Fixed Costs (FC) tend to remain constant regardless of output volume Variable Costs (VC) vary directly with volume of output VC Quantity (Q) x variable cost per unit (v) Total Cost TC FC VC Total Revenue (TR) TR revenue per unit (R) x Q MIS 373: Basic Operations Management 36
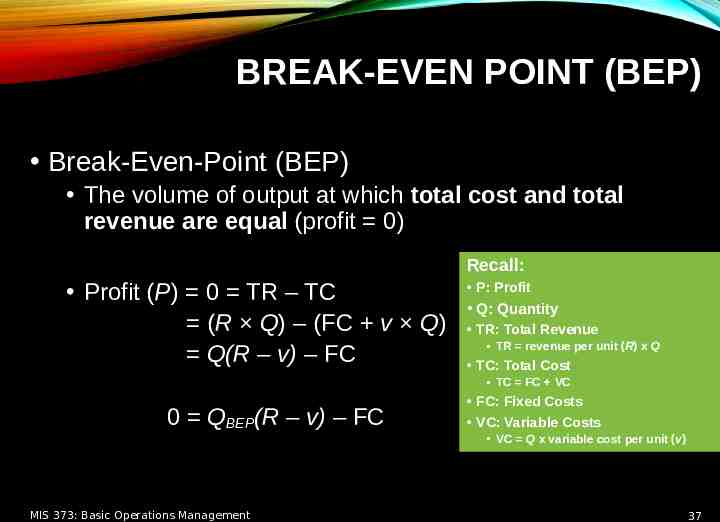
BREAK-EVEN POINT (BEP) Break-Even-Point (BEP) The volume of output at which total cost and total revenue are equal (profit 0) Recall: Profit (P) 0 TR – TC (R Q) – (FC v Q) Q(R – v) – FC P: Profit Q: Quantity TR: Total Revenue TR revenue per unit (R) x Q TC: Total Cost TC FC VC 0 QBEP(R – v) – FC FC: Fixed Costs VC: Variable Costs VC Q x variable cost per unit (v) MIS 373: Basic Operations Management 37
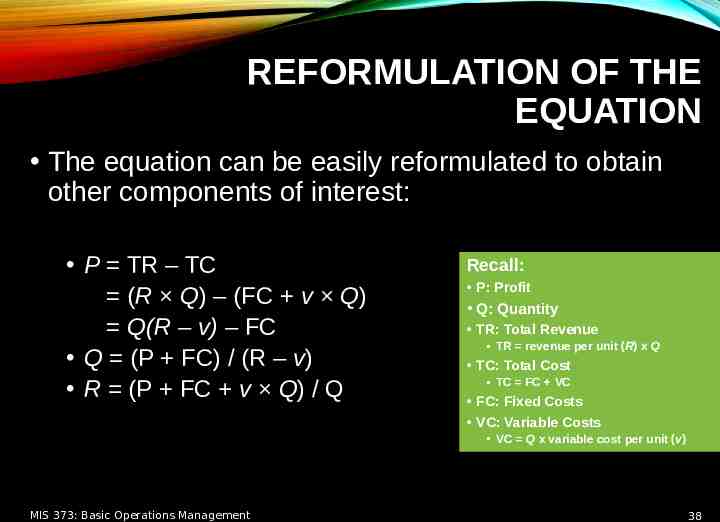
REFORMULATION OF THE EQUATION The equation can be easily reformulated to obtain other components of interest: P TR – TC (R Q) – (FC v Q) Q(R – v) – FC Q (P FC) / (R – v) R (P FC v Q) / Q Recall: P: Profit Q: Quantity TR: Total Revenue TR revenue per unit (R) x Q TC: Total Cost TC FC VC FC: Fixed Costs VC: Variable Costs VC Q x variable cost per unit (v) MIS 373: Basic Operations Management 38
COST-VOLUME RELATIONSHIPS MIS 373: Basic Operations Management 39
COST-VOLUME RELATIONSHIPS This line shows the difference between TR and TC. MIS 373: Basic Operations Management 40
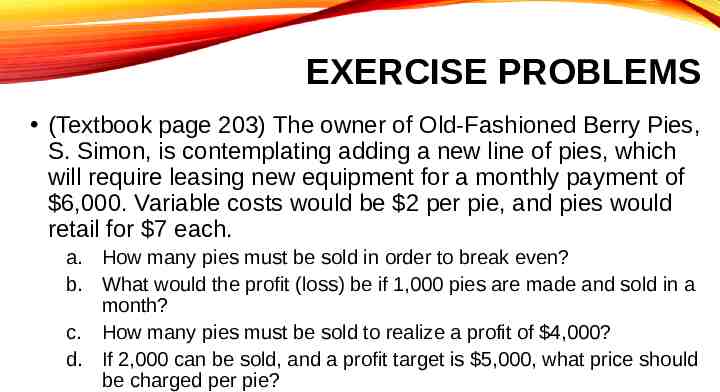
EXERCISE PROBLEMS (Textbook page 203) The owner of Old-Fashioned Berry Pies, S. Simon, is contemplating adding a new line of pies, which will require leasing new equipment for a monthly payment of 6,000. Variable costs would be 2 per pie, and pies would retail for 7 each. a. How many pies must be sold in order to break even? b. What would the profit (loss) be if 1,000 pies are made and sold in a month? c. How many pies must be sold to realize a profit of 4,000? d. If 2,000 can be sold, and a profit target is 5,000, what price should be charged per pie?
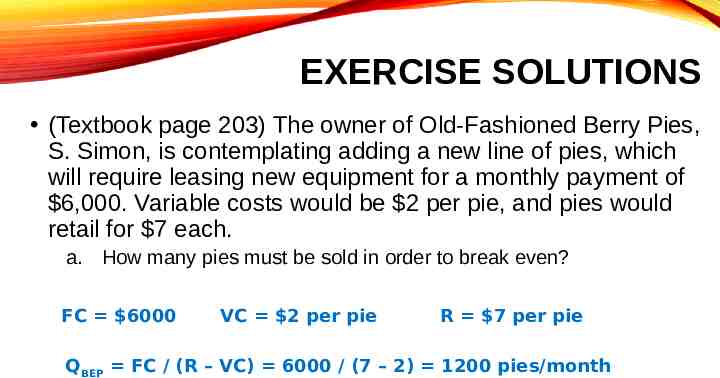
EXERCISE SOLUTIONS (Textbook page 203) The owner of Old-Fashioned Berry Pies, S. Simon, is contemplating adding a new line of pies, which will require leasing new equipment for a monthly payment of 6,000. Variable costs would be 2 per pie, and pies would retail for 7 each. a. How many pies must be sold in order to break even? FC 6000 VC 2 per pie R 7 per pie QBEP FC / (R – VC) 6000 / (7 – 2) 1200 pies/month
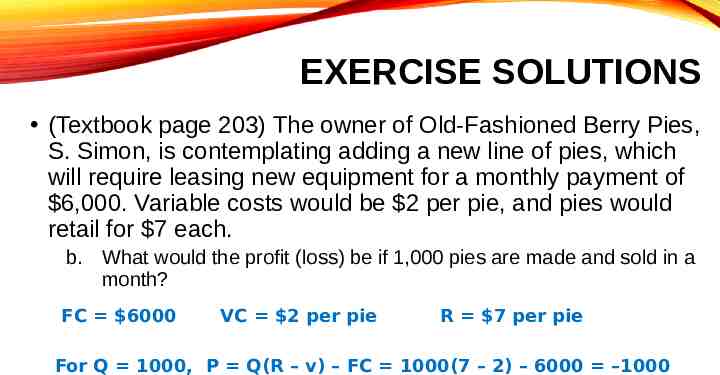
EXERCISE SOLUTIONS (Textbook page 203) The owner of Old-Fashioned Berry Pies, S. Simon, is contemplating adding a new line of pies, which will require leasing new equipment for a monthly payment of 6,000. Variable costs would be 2 per pie, and pies would retail for 7 each. b. What would the profit (loss) be if 1,000 pies are made and sold in a month? FC 6000 VC 2 per pie R 7 per pie For Q 1000, P Q(R – v) – FC 1000(7 – 2) – 6000 –1000
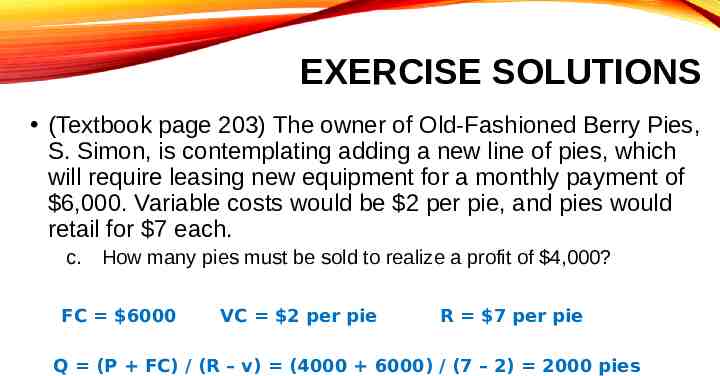
EXERCISE SOLUTIONS (Textbook page 203) The owner of Old-Fashioned Berry Pies, S. Simon, is contemplating adding a new line of pies, which will require leasing new equipment for a monthly payment of 6,000. Variable costs would be 2 per pie, and pies would retail for 7 each. c. How many pies must be sold to realize a profit of 4,000? FC 6000 VC 2 per pie R 7 per pie Q (P FC) / (R – v) (4000 6000) / (7 – 2) 2000 pies
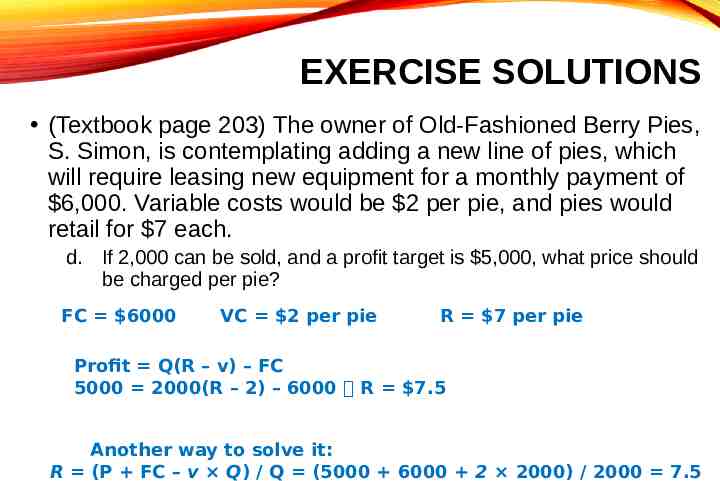
EXERCISE SOLUTIONS (Textbook page 203) The owner of Old-Fashioned Berry Pies, S. Simon, is contemplating adding a new line of pies, which will require leasing new equipment for a monthly payment of 6,000. Variable costs would be 2 per pie, and pies would retail for 7 each. d. If 2,000 can be sold, and a profit target is 5,000, what price should be charged per pie? FC 6000 VC 2 per pie R 7 per pie Profit Q(R – v) – FC 5000 2000(R – 2) – 6000 R 7.5 Another way to solve it: R (P FC – v Q) / Q (5000 6000 2 2000) / 2000 7.5
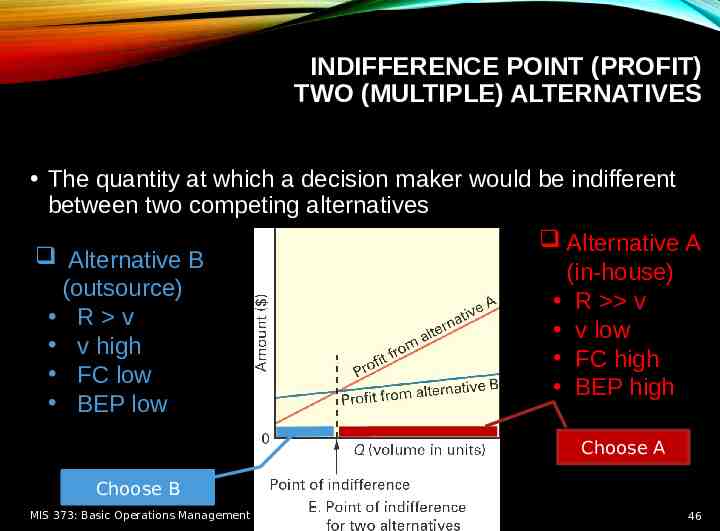
INDIFFERENCE POINT (PROFIT) TWO (MULTIPLE) ALTERNATIVES The quantity at which a decision maker would be indifferent between two competing alternatives Alternative A Alternative B (in-house) (outsource) R v R v v low v high FC high FC low BEP high BEP low Choose A Choose B MIS 373: Basic Operations Management 46
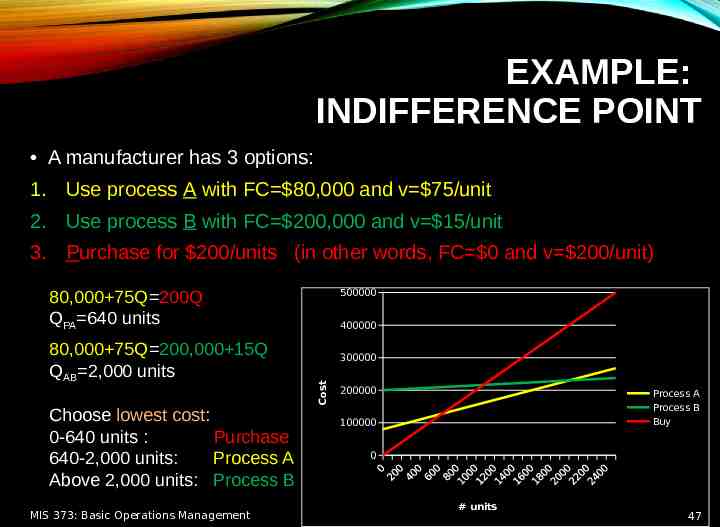
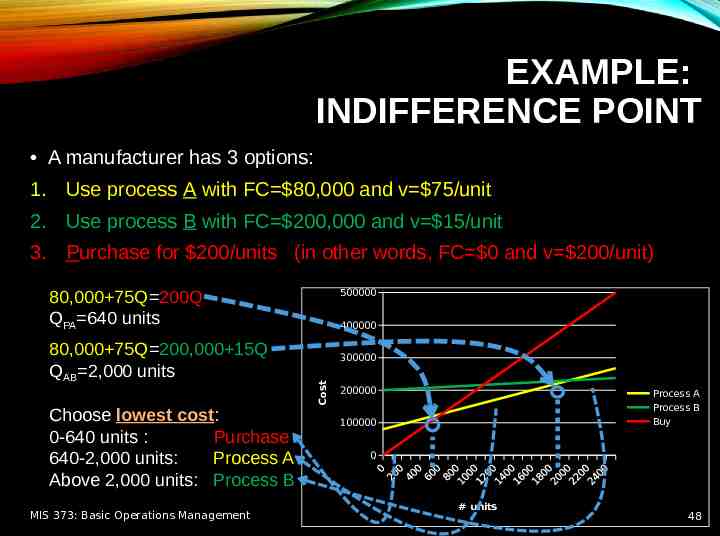
EXAMPLE: INDIFFERENCE POINT A manufacturer has 3 options: 1. Use process A with FC 80,000 and v 75/unit 2. Use process B with FC 200,000 and v 15/unit 3. Purchase for 200/units (in other words, FC 0 and v 200/unit) 80,000 75Q 200Q QPA 640 units Choose lowest cost: 0-640 units : Purchase 640-2,000 units: Process A Above 2,000 units: Process B MIS 373: Basic Operations Management 400000 300000 Cost 80,000 75Q 200,000 15Q QAB 2,000 units 500000 200000 Process A Process B Buy 100000 0 # units 47
EXAMPLE: INDIFFERENCE POINT A manufacturer has 3 options: 1. Use process A with FC 80,000 and v 75/unit 2. Use process B with FC 200,000 and v 15/unit 3. Purchase for 200/units (in other words, FC 0 and v 200/unit) 80,000 75Q 200Q QPA 640 units Choose lowest cost: 0-640 units : Purchase 640-2,000 units: Process A Above 2,000 units: Process B MIS 373: Basic Operations Management 400000 300000 Cost 80,000 75Q 200,000 15Q QAB 2,000 units 500000 200000 Process A Process B Buy 100000 0 # units 48
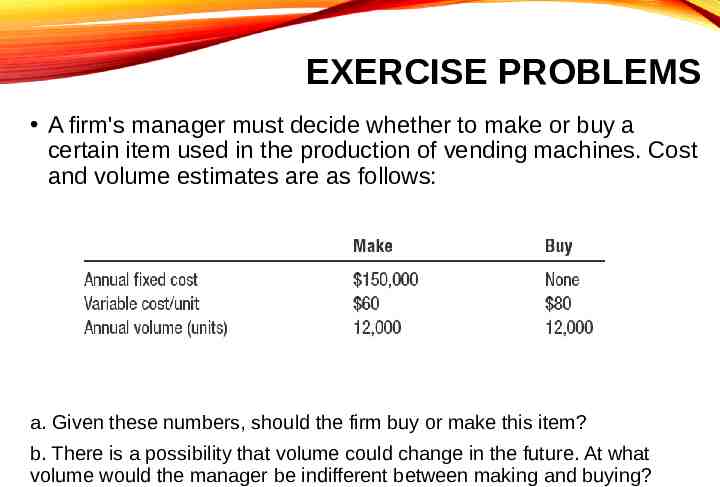
EXERCISE PROBLEMS A firm's manager must decide whether to make or buy a certain item used in the production of vending machines. Cost and volume estimates are as follows: a. Given these numbers, should the firm buy or make this item? b. There is a possibility that volume could change in the future. At what volume would the manager be indifferent between making and buying?
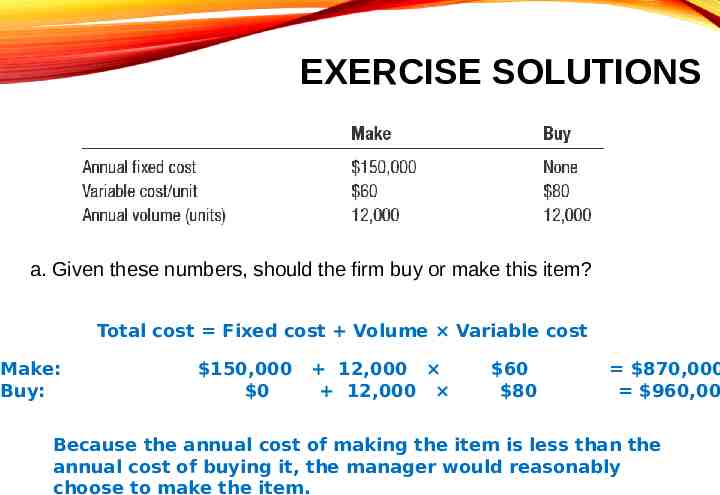
EXERCISE SOLUTIONS a. Given these numbers, should the firm buy or make this item? Total cost Fixed cost Volume Variable cost Make: Buy: 150,000 0 12,000 12,000 60 80 870,000 960,00 Because the annual cost of making the item is less than the annual cost of buying it, the manager would reasonably choose to make the item.
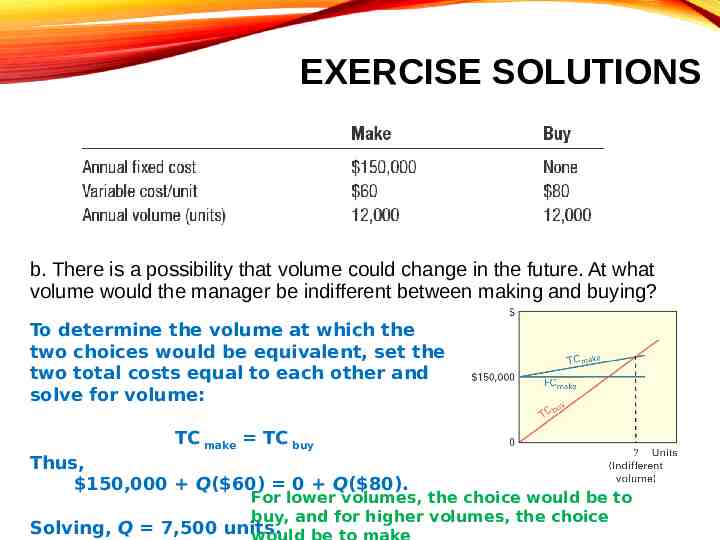
EXERCISE SOLUTIONS b. There is a possibility that volume could change in the future. At what volume would the manager be indifferent between making and buying? To determine the volume at which the two choices would be equivalent, set the two total costs equal to each other and solve for volume: TC make TC buy Thus, 150,000 Q( 60) 0 Q( 80). For lower volumes, the choice would be to buy, and for higher volumes, the choice Solving, Q 7,500 units.
KEY POINTS Capacity decisions can be critical to the success of a business organization because capacity is the supply side of the supply-demand equation, and too little or too much capacity is costly. The key issues in capacity planning relate to determining what kind of capacity is needed, how much is needed, and when it is needed. Volatile demand and long lead times to achieve capacity changes can be challenging. Cost-volume analysis (break-even point and indifference point) can give useful information for capacity planning. MIS 373: Basic Operations Management 52